Differential Voltage Analysis of Two Phase Intercalation Hysteresis in Lithium Iron Phosphate Packs
Differential voltage analysis decouples phase transition hysteresis from degradation mechanisms in lithium iron phosphate packs to ensure accurate state of charge calibration.
Phase
Solid-state lithium insertion into triphylite crystal lattices produces different thermodynamic energy states depending on whether current flows during charge or discharge. In lithium iron phosphate cells, the transition between the lithium-rich phase and the lithium-poor heterosite phase spans a broad state-of-charge plateau. This first-order phase transformation generates pronounced open-circuit voltage hysteresis, as elastic strain energy accumulates at the moving phase interface and shifts the quasi-equilibrium potential.
Consequently, the equilibrium potential measured during lithiation sits 15 mV to 35 mV below the potential measured during delithiation, even when cycling at near-zero C-rates such as C/100.
Misfit dislocations along the crystallographic interface introduce an asymmetric energy barrier: extracting a lithium ion from the lattice requires overcoming structural resistance distinct from the energy required to insert that same ion back into the host matrix. At ambient temperatures, this thermodynamic hysteresis operates independently of ohmic resistance and charge-transfer kinetics. Standard relaxation periods of 24 hours fail to collapse the voltage gap between charge and discharge paths, leaving a permanent path-dependent energy offset.
Micro-scale elastic strain during lithium extraction fixes minimum open-circuit hysteresis independent of cycle rate reduction.
Quantifying this underlying thermodynamic offset requires quasi-equilibrium open-circuit voltage measurements taken across incremental state-of-charge steps. When a cell operates within the two-phase region, small variations in lithium concentration produce negligible voltage changes, obscuring early-stage capacity loss under conventional voltage monitoring.
| Parameter | Charge Phase (Delithiation) | Discharge Phase (Lithiation) | Hysteresis Offset |
|---|---|---|---|
| Platform Open-Circuit Voltage | 3.432 V | 3.401 V | 31 mV |
| Phase Boundary Strain Energy | 4.2 J/g | 3.1 J/g | 1.1 J/g |
| Quasi-Equilibrium C-Rate Limit | C/50 | C/50 | Zero-current limit |
| Transition Region SOC Band | 15% to 85% | 15% to 85% | 70% SOC span |
Ignoring path-dependent energy offsets during battery management system calibration corrupts state-of-charge calculations, leading to unpredicted energy cutoffs in field operations.
Differential Features and Asymmetry Analysis


Peak
Differential voltage curves highlight structural changes along the voltage plateau by plotting the derivative of cell potential with respect to capacity. This mathematical operation converts flat voltage curves into distinct derivative peaks and valleys. In lithium iron phosphate chemistry, differential voltage analysis converts subtle slope transitions at stoichiometric boundaries into sharp signal features whose peak positions correspond directly to phase transition limits within the positive electrode and staging ratios within the graphite negative electrode.
Hysteresis distorts the symmetry between charge and discharge differential voltage profiles. During charging, phase transformation features shift toward higher capacities and elevated voltages; during discharging, those same features shift toward lower capacities and depressed voltages. This directional displacement creates a systematic offset when attempting to align charge-derived differential curves with discharge-derived reference profiles.
At C/50 discharge rate at 25°C, loss of lithium inventory shifts the secondary differential features lower by 2.4 Ah per thousand equivalent full cycles.
Evaluating cell degradation requires separating phase transition hysteresis from true capacity loss mechanisms. In a 100 Ah commercial cell subjected to degradation testing, the fresh-state differential voltage peak representing full graphite intercalation occurs at 88 Ah during C/20 charge and at 85 Ah during C/20 discharge, establishing a baseline hysteresis displacement of 3 Ah. After 1,500 full equivalent cycles, the charge peak moves to 81 Ah while the discharge peak moves to 74 Ah, expanding total peak displacement from 3 Ah to 7 Ah. This expansion indicates a 4 Ah loss of lithium inventory combined with a 3 Ah loss of active material, demonstrating how differential peak alignment tracks distinct degradation modes.
Loss of lithium inventory decreases total available capacity while narrowing the horizontal distance between primary differential voltage peaks, whereas loss of active material reduces peak height and alters peak area. Isolating these two degradation pathways requires differential voltage profiles captured under low-current conditions to prevent kinetic polarization from swamping the thermodynamic hysteresis signature.
How micro-hysteresis paths within partial state-of-charge sub-cycles recombine into major thermodynamic envelope curves remains an open analytical challenge for online pack diagnostics.

Multi-Cell Aggregation and Dispersion Effects
String
Combining single cells into multi-series battery packs introduces cumulative impedance variance and localized state-of-charge dispersion across the connected assembly. Individual cells within a series string possess slight variations in active material mass, electrolyte volume, and internal resistance. When evaluating a series string containing 16 or 112 cells, the overall pack differential voltage curve reflects the mathematical summation of all individual cell responses, which broadens discrete peak features.

Does Cell Aging Alter the Thermodynamic Hysteresis Gap?
Long-term cycling alters electrode microstructures, increasing localized stress and mechanical defect density within individual particles. These structural changes widen the thermodynamic hysteresis gap in aged cells. When individual cells within a series string age at unequal rates due to thermal gradients across the pack enclosure, their hysteresis gaps expand asynchronously.
This asynchronous expansion distorts the aggregate pack voltage signature, introducing multi-peaked differential voltage profiles that complicate automated diagnostic analysis.
| Cell Dispersion Level | Capacity Spread (Ah) | Resistance Spread (mΩ) | DVA Peak Width Expansion | Feature Resolution |
|---|---|---|---|---|
| Tight Factory Grading | < 0.5% | < 0.05 | + 8% | High Resolution |
| Standard Commercial Grade | 0.5% to 1.5% | 0.05 to 0.12 | + 28% | Moderate Smearing |
| Aged Field Pack | 1.5% to 3.5% | 0.12 to 0.35 | + 65% | Severe Smearing |
Active and passive balancing systems further alter pack-level differential signals. Passive balancing shunts current around fully charged cells near top-of-charge, creating artificial capacity increments in the differential calculation. Active balancing transfers charge between series modules during operation, creating transient voltage shifts that introduce high-frequency noise into the derivative signal.
Non-compliance with IEC 62619 differential voltage screening standards invalidates manufacturer warranty coverage when cell mismatch exceeds two percent.
Pack-level differential voltage distortion frequently stems from cell manufacturing tolerances rather than active degradation within parallel branches.

Channel
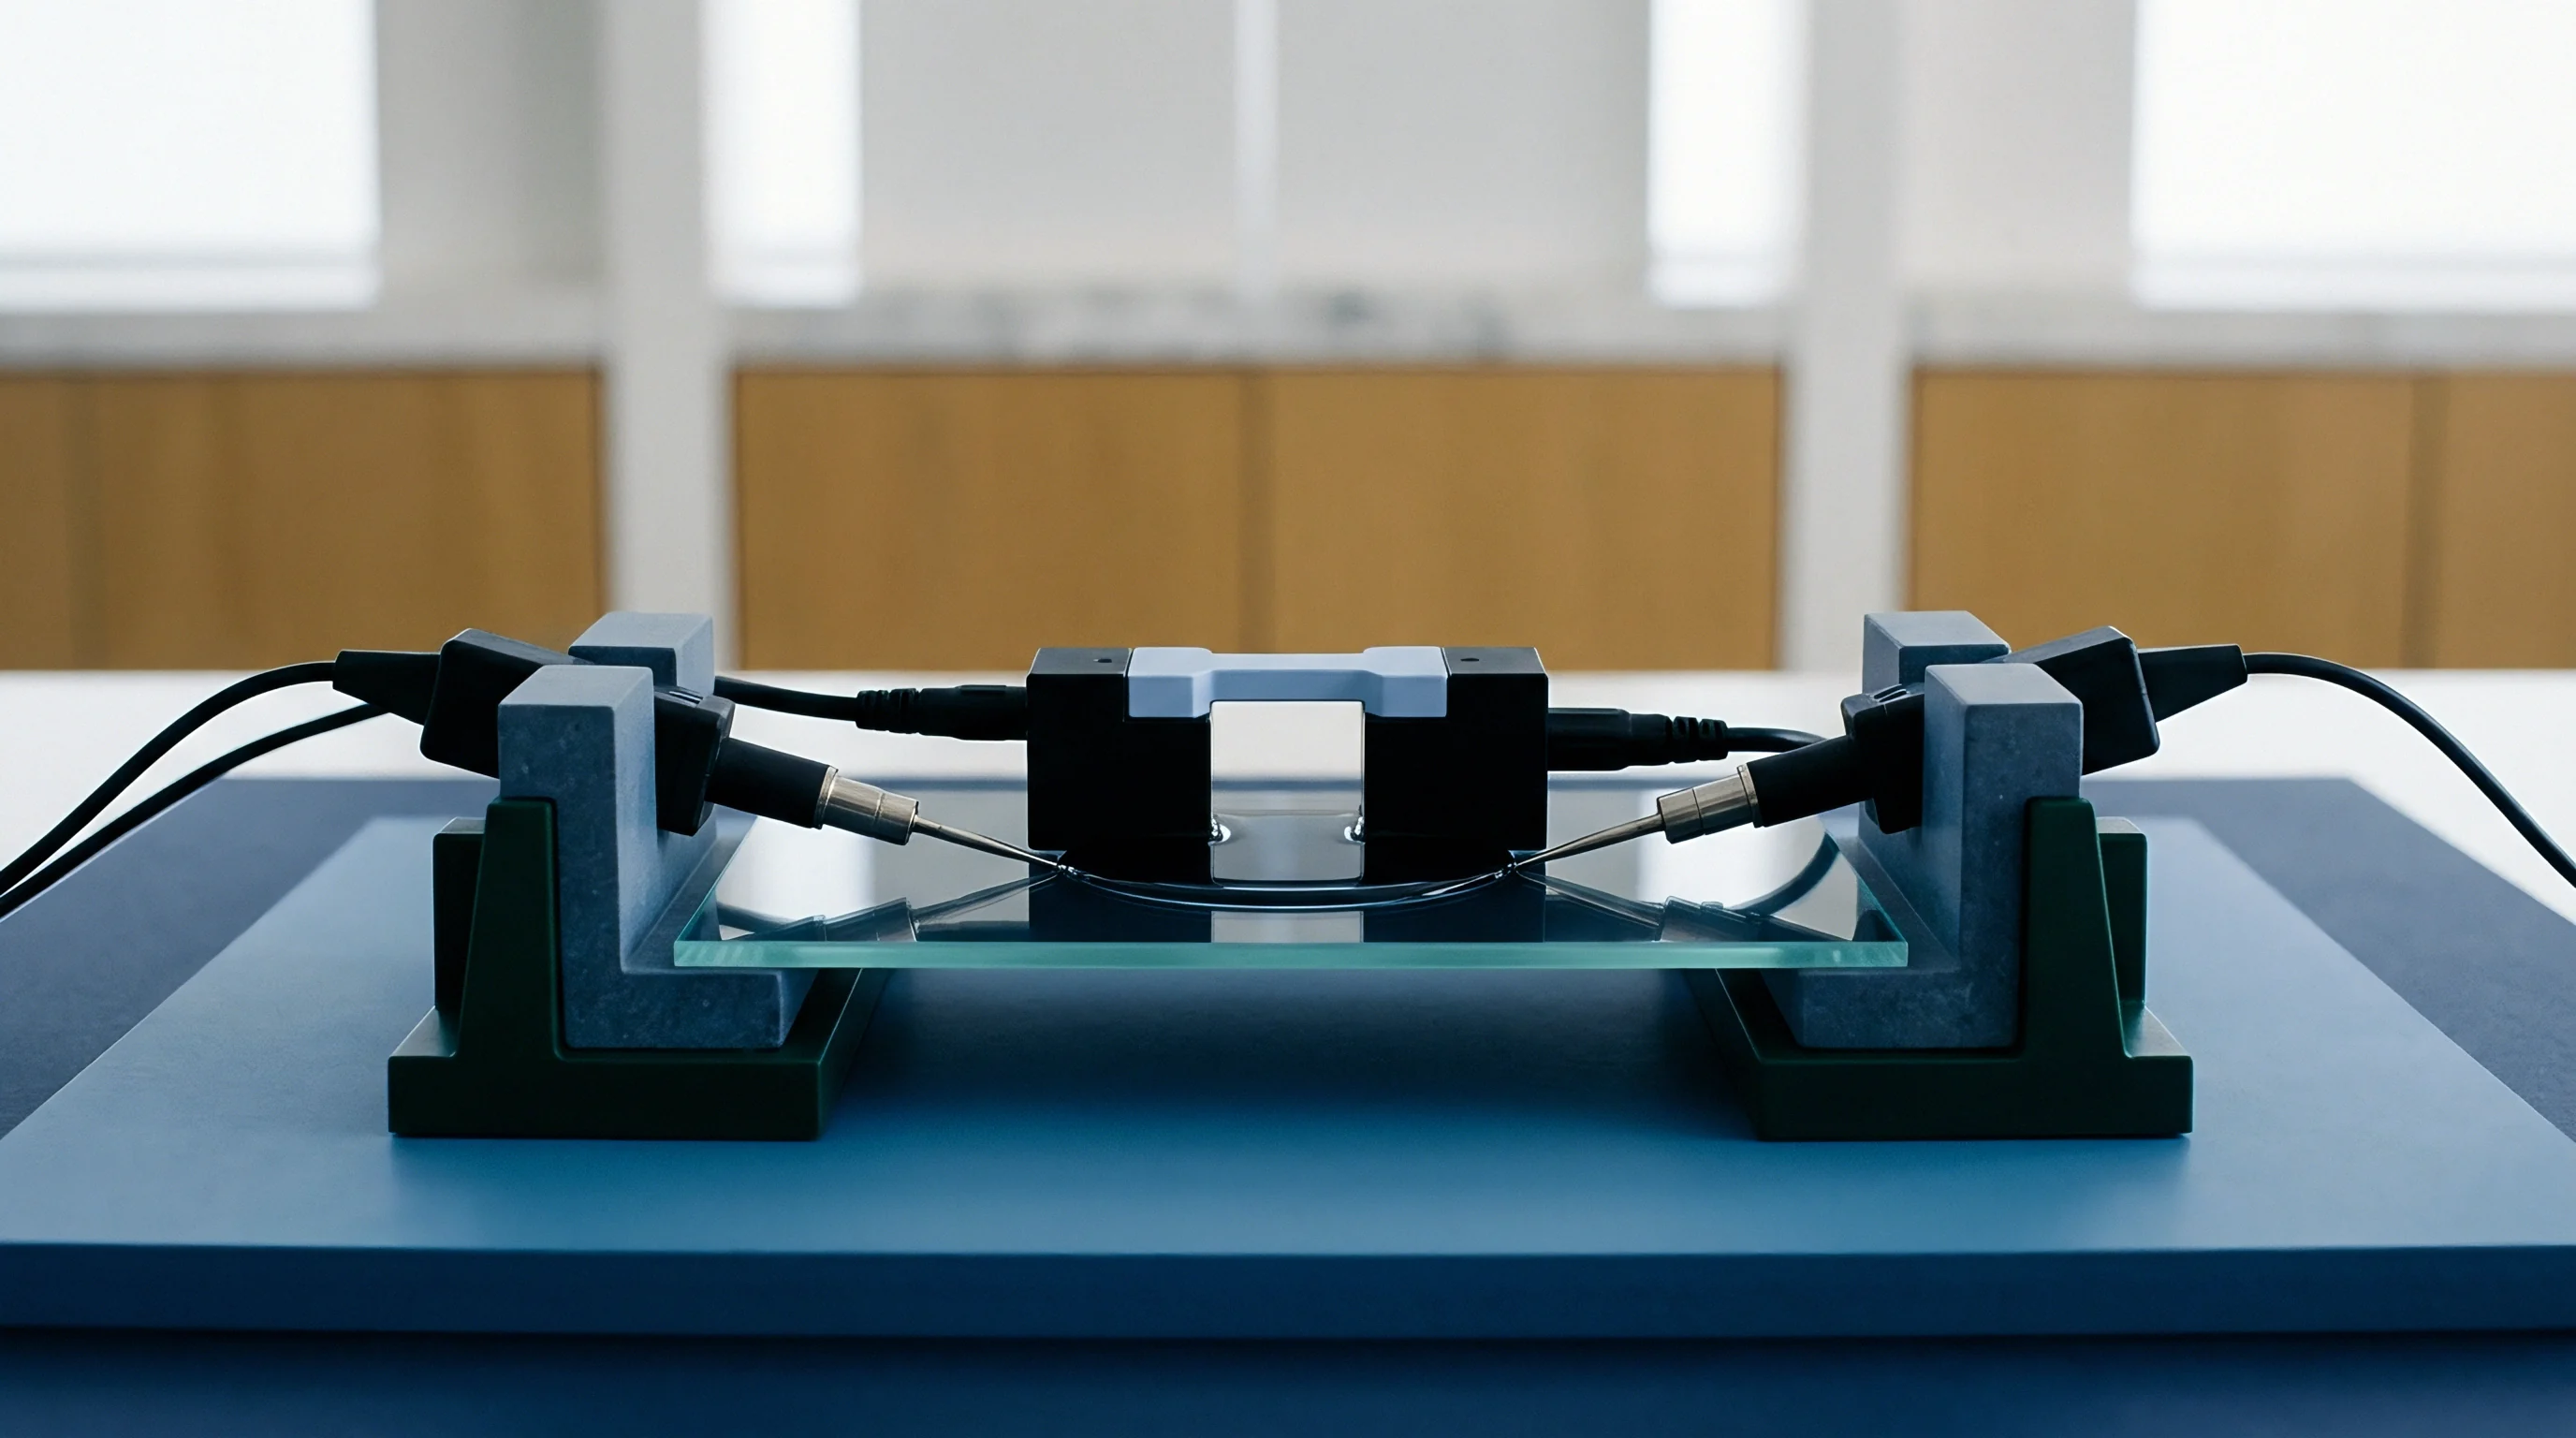
Extracting low-noise differential voltage metrics demands high-precision cycler hardware operating under tightly regulated thermal environments. Calculating derivatives amplifies raw voltage noise by several orders of magnitude, turning microvolt-level instrumentation ripple into destructive spikes on the differential curve. Test channels must feature 24-bit analog-to-digital converters and current regulation stability within 0.02% of full-scale output.
Temperature fluctuations as small as 0.5°C cause voltage shifts that eclipse the subtle open-circuit voltage gradients characteristic of lithium iron phosphate plateaus. Diagnostic testing requires environmental chambers holding temperatures within a 0.1°C window throughout the entire charge and discharge test sequence.
Signal acquisition failures during pack qualification stem from identifiable hardware and environmental deficiencies:
- Quantization Noise derived from low-resolution analog converters that introduce discrete step functions into continuous derivative voltage calculations.
- Thermal Oscillation caused by unstable climate chamber control loops that project external temperature cycles onto cell voltage records.
- Current Ripple produced by switching power supplies that inject high-frequency electrical noise into cell sense wires.
- Contact Resistance Instability occurring when mechanical test clamps expand or oxidize under continuous current load.
Acquiring clean differential voltage profiles follows a structured experimental execution sequence on high-precision laboratory test channels:
- Mount the target battery pack inside an environmental chamber calibrated to 25.0°C and allow a four-hour thermal soak period.
- Perform a full discharge down to lower cutoff voltage followed by a two-hour open-circuit rest period to establish baseline state-of-charge equilibrium.
- Apply a constant charge current of C/50 until reaching the upper cut-off voltage, logging voltage and current data continuously at one-second intervals.
- Enforce a four-hour rest period at full charge state to record potential relaxation kinetics across the phase boundary.
- Apply a constant discharge current of C/50 down to the lower voltage cutoff while maintaining identical data acquisition logging parameters.
- Process the raw time-series data using a Savitzky-Golay filtering algorithm with a second-order polynomial and a window size set to 2% of total capacity points.
Over-filtering removes critical phase transformation features, while under-filtering leaves quantization noise that masks genuine electrode structural changes.
Adherence to standard testing protocol UN 38.3 section 38.3.4 requires full data logging at five-second intervals during cell qualification runs.
Yield
Commercial pack performance metrics directly govern financial returns, warranty liability reserves, and landed cost efficiency over multi-year deployment lifecycles. Hysteresis introduces uncertainty into state-of-charge estimation algorithms: on the flat voltage plateau of lithium iron phosphate, a 20 mV hysteresis error translates to a state-of-charge error between 5% and 12%. Systems operate with artificially expanded buffer bands to avoid unexpected low-voltage cutoffs, reducing the usable battery capacity delivered to the end customer.
| System Parameter | Uncalibrated BMS Model | Hysteresis-Aware DVA Model | Commercial Financial Variance |
|---|---|---|---|
| Usable State-of-Charge Window | 80% Nameplate | 92% Nameplate | + 12% Usable Energy Yield |
| State-of-Charge Estimation Error | ± 8.5% | ± 1.2% | 7.3% Precision Improvement |
| Preventative Buffer Oversizing | 10% Capacity Margin | 3% Capacity Margin | 7% Initial Capital Reduction |
| Projected Lifecycle Cost per kWh | $0.078 per Cycle | $0.062 per Cycle | 20.5% Operational Cost Reduction |
When battery systems underperform due to uncalibrated state-of-charge drift, project operators issue performance bond claims against pack manufacturers. Integrating differential voltage metrics into factory acceptance testing enables precise screening of incoming cell lots, identifying high-hysteresis, low-yield batches before pack assembly operations begin.
Uncalibrated voltage hysteresis in flat-plateau chemistries leads directly to false residual capacity ratings during second-life grading.
Procurement contract specifications require explicit validation metrics to ensure delivered cell quality matches signed datasheets:
- Hysteresis Window Upper Limit setting maximum allowable potential divergence between C/50 charge and discharge open-circuit curves.
- Differential Peak Shift Tolerance establishing acceptable horizontal displacement limits for primary phase transition features across cycle milestones.
- Thermal Stability Coefficient specifying maximum permissible voltage change per degree Celsius during quasi-equilibrium rest steps.
- Cell-to-Cell Dispersion Band defining maximum allowable capacity and resistance variance across incoming manufacturing batches.
Establishing verified differential voltage profiles during initial qualification equips procurement teams with indisputable reference baselines during warranty dispute arbitrations. Integrating differential voltage metrics directly into battery management system algorithms closes the gap between laboratory characterization and field operational reliability.