Determining Basic Metrology Drift Limits for Automated Battery Test Channels
Automated battery test channel drift limits require guardbanding specifications based on expanded uncertainty to prevent costly cell lot misclassification.
Noise
High-density automated cell cyclers route high currents through compact multi-busbar cabinets. When hundreds of channels charge and discharge simultaneously, high-frequency switching artifacts from buck-boost converters propagate through common ground planes. These electrical disturbances obscure small voltage and current changes during battery characterization.
Precision measurement depends on placing sense taps directly at the cell terminal lugs. Wiring topologies that share current and sense lines introduce voltage drops across lead resistances, corrupting cell terminal voltage readings during high-rate pulses.
Differential voltage taps eliminate common-mode potential differences between adjacent channel grounds. Lead resistance skews sensor measurements. In a multi-channel cycler chassis, ground loops form when channel isolation breaks down, causing stray currents to flow through signal shields.
A low-pass passive filter at the analog-to-digital converter input attenuates high-frequency ripple from pulse-width modulated power stages. Filtering must balance noise suppression against signal bandwidth; over-filtering rounds off sharp voltage transients during direct-current internal resistance tests, masking true electrochemical cell response.
A 100-microvolt voltage measurement bias over a three-hour discharge cycle shifts calculated cell capacity by 0.12 percent at a 1C rate.
Sensing Line Parasitics and Common Mode Interference
Thermal electromotive forces generate parasitic direct-current offsets across physical connections. Dissimilar metal interfaces, such as copper circuit board traces mated to brass terminal screws, act as thermocouples when temperature gradients develop inside the test enclosure. A temperature differential of ten degrees Celsius across a copper-brass junction generates several microvolts of parasitic potential.
ADC quantization sets baseline resolution. Automated calibration algorithms must measure and zero these thermal offsets before starting multi-day cycling programs.
| Error Source | Physical Mechanism | Typical Magnitude | Calibration Mitigation |
|---|---|---|---|
| Thermal EMF | Seebeck effect across copper-brass terminal junctions | 2 to 15 microvolts per degree Celsius | Automated zero-point offset subtraction before test execution |
| Ground Loop Bias | Current leakage through shared signal return paths | 0.05 to 0.50 millivolts | Galvanic channel-to-channel isolation above 500 volts DC |
| Switching Ripple | High-frequency noise from pulse-width modulation cycler stages | 5 to 30 millivolts peak-to-peak | Hardware low-pass active filtering coupled with digital integration |
| Shunt Aging | Microstructural strain and thermal annealing of manganin elements | 0.02 to 0.10 percent per year | Periodic secondary standard current injection re-calibration |
Differential Voltage Tap Configurations
Separating current-carrying conductors from measurement pathways prevents resistive IR drops from corrupting readings. Four-wire Kelvin connections isolate high-current delivery lines from high-impedance voltage sense lines. When contact resistance at the cell holder lug increases due to surface oxidation, current-carrying terminals experience local heating.
The voltage sense tap remains unaffected only if its input impedance exceeds tens of megaohms. High input impedance prevents measurement current from flowing through the sense wires, keeping parasitic voltage drops negligible. Test equipment integrators frequently argue that factory zero-point calibrations eliminate ground loop impacts over extended operational cycles.

Guardband
Instrument measurement uncertainty reduces the effective tolerance window available for battery capacity and internal resistance grading. If a cell specification demands a discharge capacity between 50.00 and 50.50 Ampere-hours, channel drift expands the risk of accepting non-conforming cells or rejecting compliant ones. Establishing guardbands pulls the acceptance criteria inward by an amount proportional to the expanded measurement uncertainty of the test channel.
Guardbands protect contractual capacity specs.
Calculating the required guardband width depends on the Test Uncertainty Ratio, which compares the cell specification tolerance band to the expanded measurement uncertainty of the automated test channel. A minimum ratio of four to one maintains high statistical confidence in sorting operations. When channel drift degrades this ratio below four to one, the probability of false acceptance rises sharply.
Engineers shrink the target band by subtracting the expanded uncertainty from the upper specification limit and adding it to the lower specification limit.
ANSI NCSL Z540 3 mandates a maximum allowable probability of false acceptance of two percent for commercial compliance testing.

Establishing Upper and Lower Acceptance Limits
Engineers apply statistical confidence intervals to define clean boundaries between conforming and non-conforming cells. Assuming a normal distribution of channel measurement error, an expanded uncertainty calculated at a 95 percent confidence level uses a coverage factor of k equals two. When the combined channel uncertainty equals 10 milliamperes on current and 1.5 millivolts on voltage, ampere-hour integration drift over a five-hour test yields an uncertainty of 0.05 Ampere-hours.
The effective acceptance window contracts from 50.00 to 50.50 Ampere-hours down to 50.05 to 50.45 Ampere-hours.
Worked Channel Uncertainty Budget
Calculating total measurement uncertainty for a 50 Ampere-hour lithium-ion cell requires combining individual channel error components. Consider a channel evaluating a cell under a 1C discharge rate for one hour. The nominal current is 50.00 Amperes and the voltage cut-off limit is 2.500 Volts.
The individual standard uncertainties associated with the signal acquisition chain are:
Voltage gain error equals 0.02 percent of reading, contributing 0.50 millivolts standard uncertainty. Voltage offset error equals 0.20 millivolts flat. Current shunt resistance tolerance equals 0.03 percent of nominal value, contributing 15.0 milliamperes standard uncertainty.
Current ADC gain drift contributes 8.0 milliamperes. Timebase drift of the internal clock equals 100 milliseconds over one hour, contributing 1.38 micro-ampere-hours during integration.
Combining current-related standard uncertainties using the root-sum-of-squares method yields a combined standard current uncertainty of 17.0 milliamperes. Multiplying by a coverage factor of k equals two gives an expanded current uncertainty of 34.0 milliamperes. Integrated capacity over one hour carries an expanded uncertainty of 0.034 Ampere-hours.
Adding guardbands equal to this expanded uncertainty reduces the allowable capacity window by 0.068 Ampere-hours total. Incorporating ISO 17025 Section 7.8.6 into supply contracts forces cell suppliers to subtract expanded measurement uncertainty directly from pass-fail specification limits.

Thermal
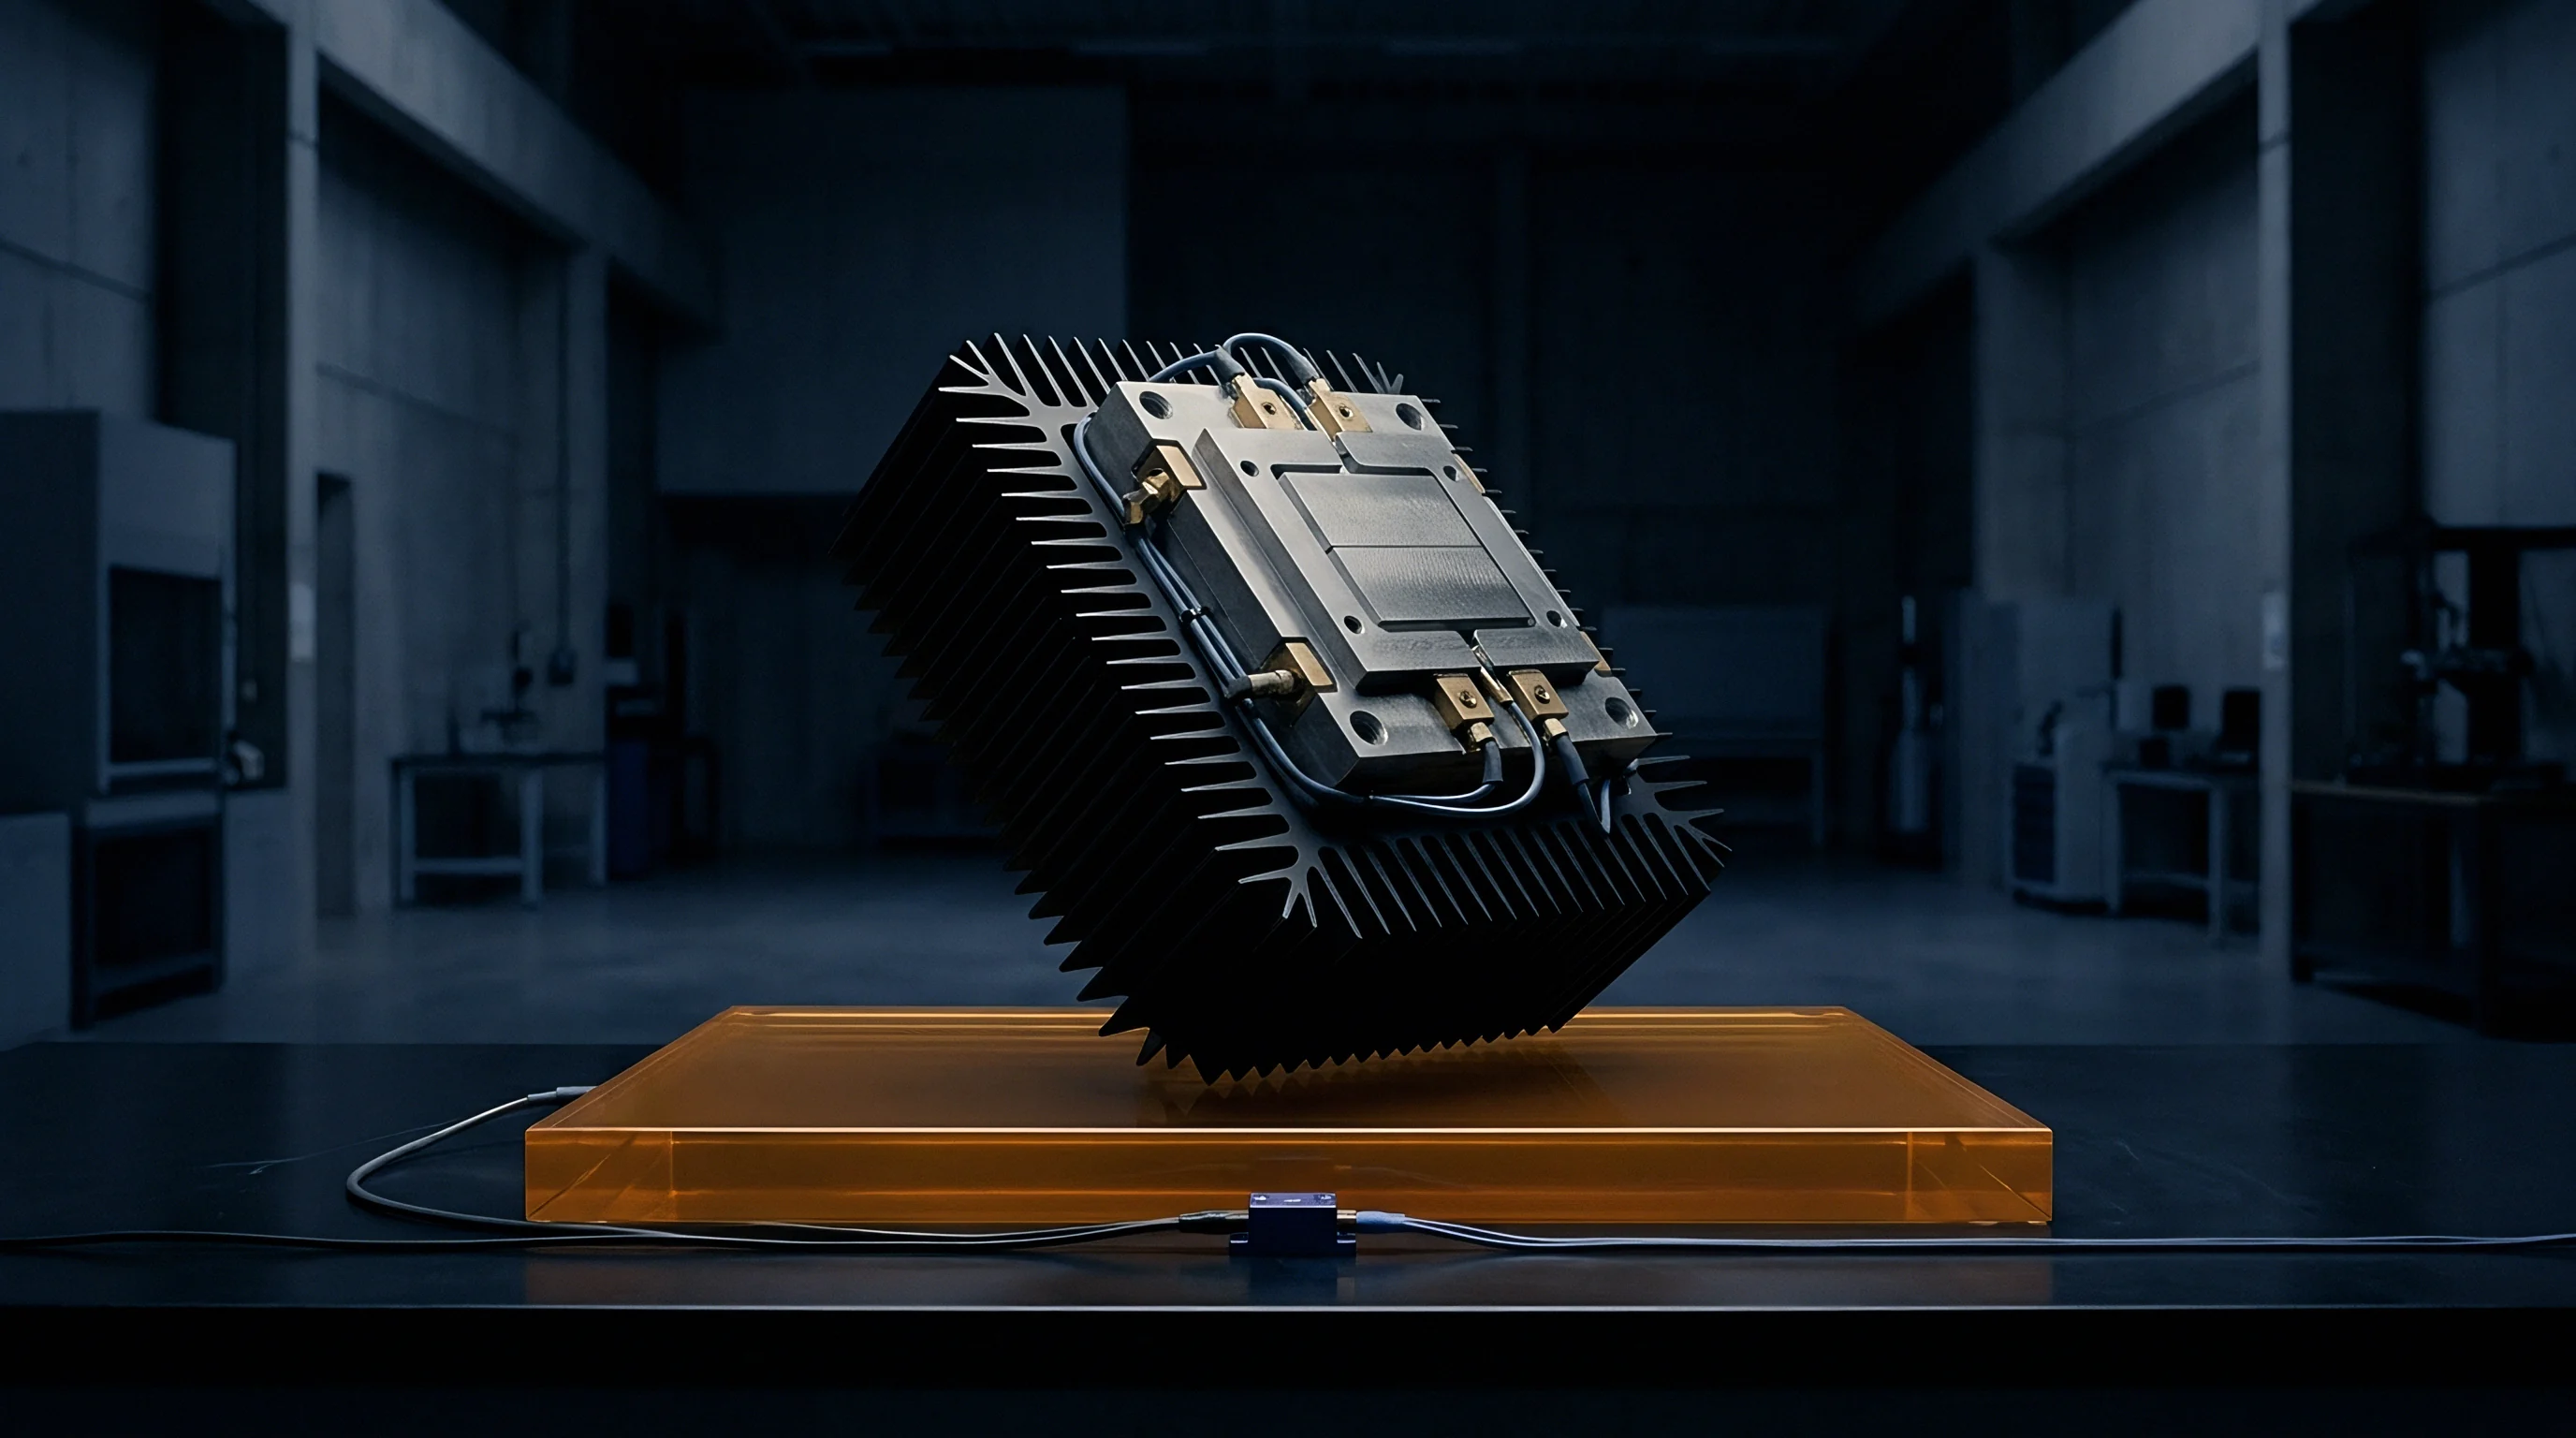
Current sensing shunts experience continuous temperature variations during multi-phase charge and discharge cycling. Joule heating inside the resistive alloy elevates element temperature above ambient enclosure levels. Temperature swings distort sensor readings.
As the resistor heats up, its absolute resistance changes according to its intrinsic temperature coefficient of resistance. High-rate charge pulses produce localized thermal spikes that alter current measurement accuracy within milliseconds.
Cabinet enclosure ventilation controls ambient baseline temperatures surrounding analog measurement cards. Thermal gradients induce unwanted voltage. Variable fan speeds create moving air currents that cool signal conditioning boards unevenly, inducing localized drift in voltage reference chips.
Precision test racks place sensitive analog circuitry inside shielded, thermally isolated sub-enclosures to decouple voltage references and precision operational amplifiers from external rack airflow changes.
Resistor Alloy Stability and Self Heating
Solid metal alloy shunts dissipate heat under continuous current loads, causing predictable changes in resistance. Manganin, Zeranin, and Evanohm alloys exhibit distinct resistance-versus-temperature profiles. Manganin exhibits a parabolic temperature response centered near 25 degrees Celsius, while Evanohm provides a flatter curve across a broader thermal range.
Selecting appropriate alloy formulations minimizes gain drift during high-rate battery testing.
- Manganin Element Drift Thermal self-heating past 40 degrees Celsius shifts resistance downward, artificially inflating recorded current values during long discharge cycles.
- Zeranin Thermal Hysteresis Rapid cooling cycles induce mechanical stress in the resistor foil, altering baseline resistance calibration after repeated high-current steps.
- Evanohm Gain Stability Low temperature coefficients below 2 ppm per degree Celsius preserve calibration stability under heavy current loads up to 60 degrees Celsius.
- Copper Terminal Thermal EMF Temperature imbalances between shunt end-blocks generate secondary DC voltage offsets that distort low-current measurement accuracy.
| Alloy Material | Temperature Coefficient (ppm/K) | Thermal EMF vs Copper (µV/K) | Long-Term Drift (% per 1000 hrs) |
|---|---|---|---|
| Manganin | ±15 (between 15°C and 35°C) | < 1.0 | 0.015 |
| Zeranin | ±3 (between 20°C and 50°C) | < 0.3 | 0.008 |
| Evanohm | ±1 (between -20°C and 100°C) | < 0.5 | 0.005 |
Active forced-air cabinet cooling maintains shunt temperature equilibrium faster than passive conduction plates.
Interval
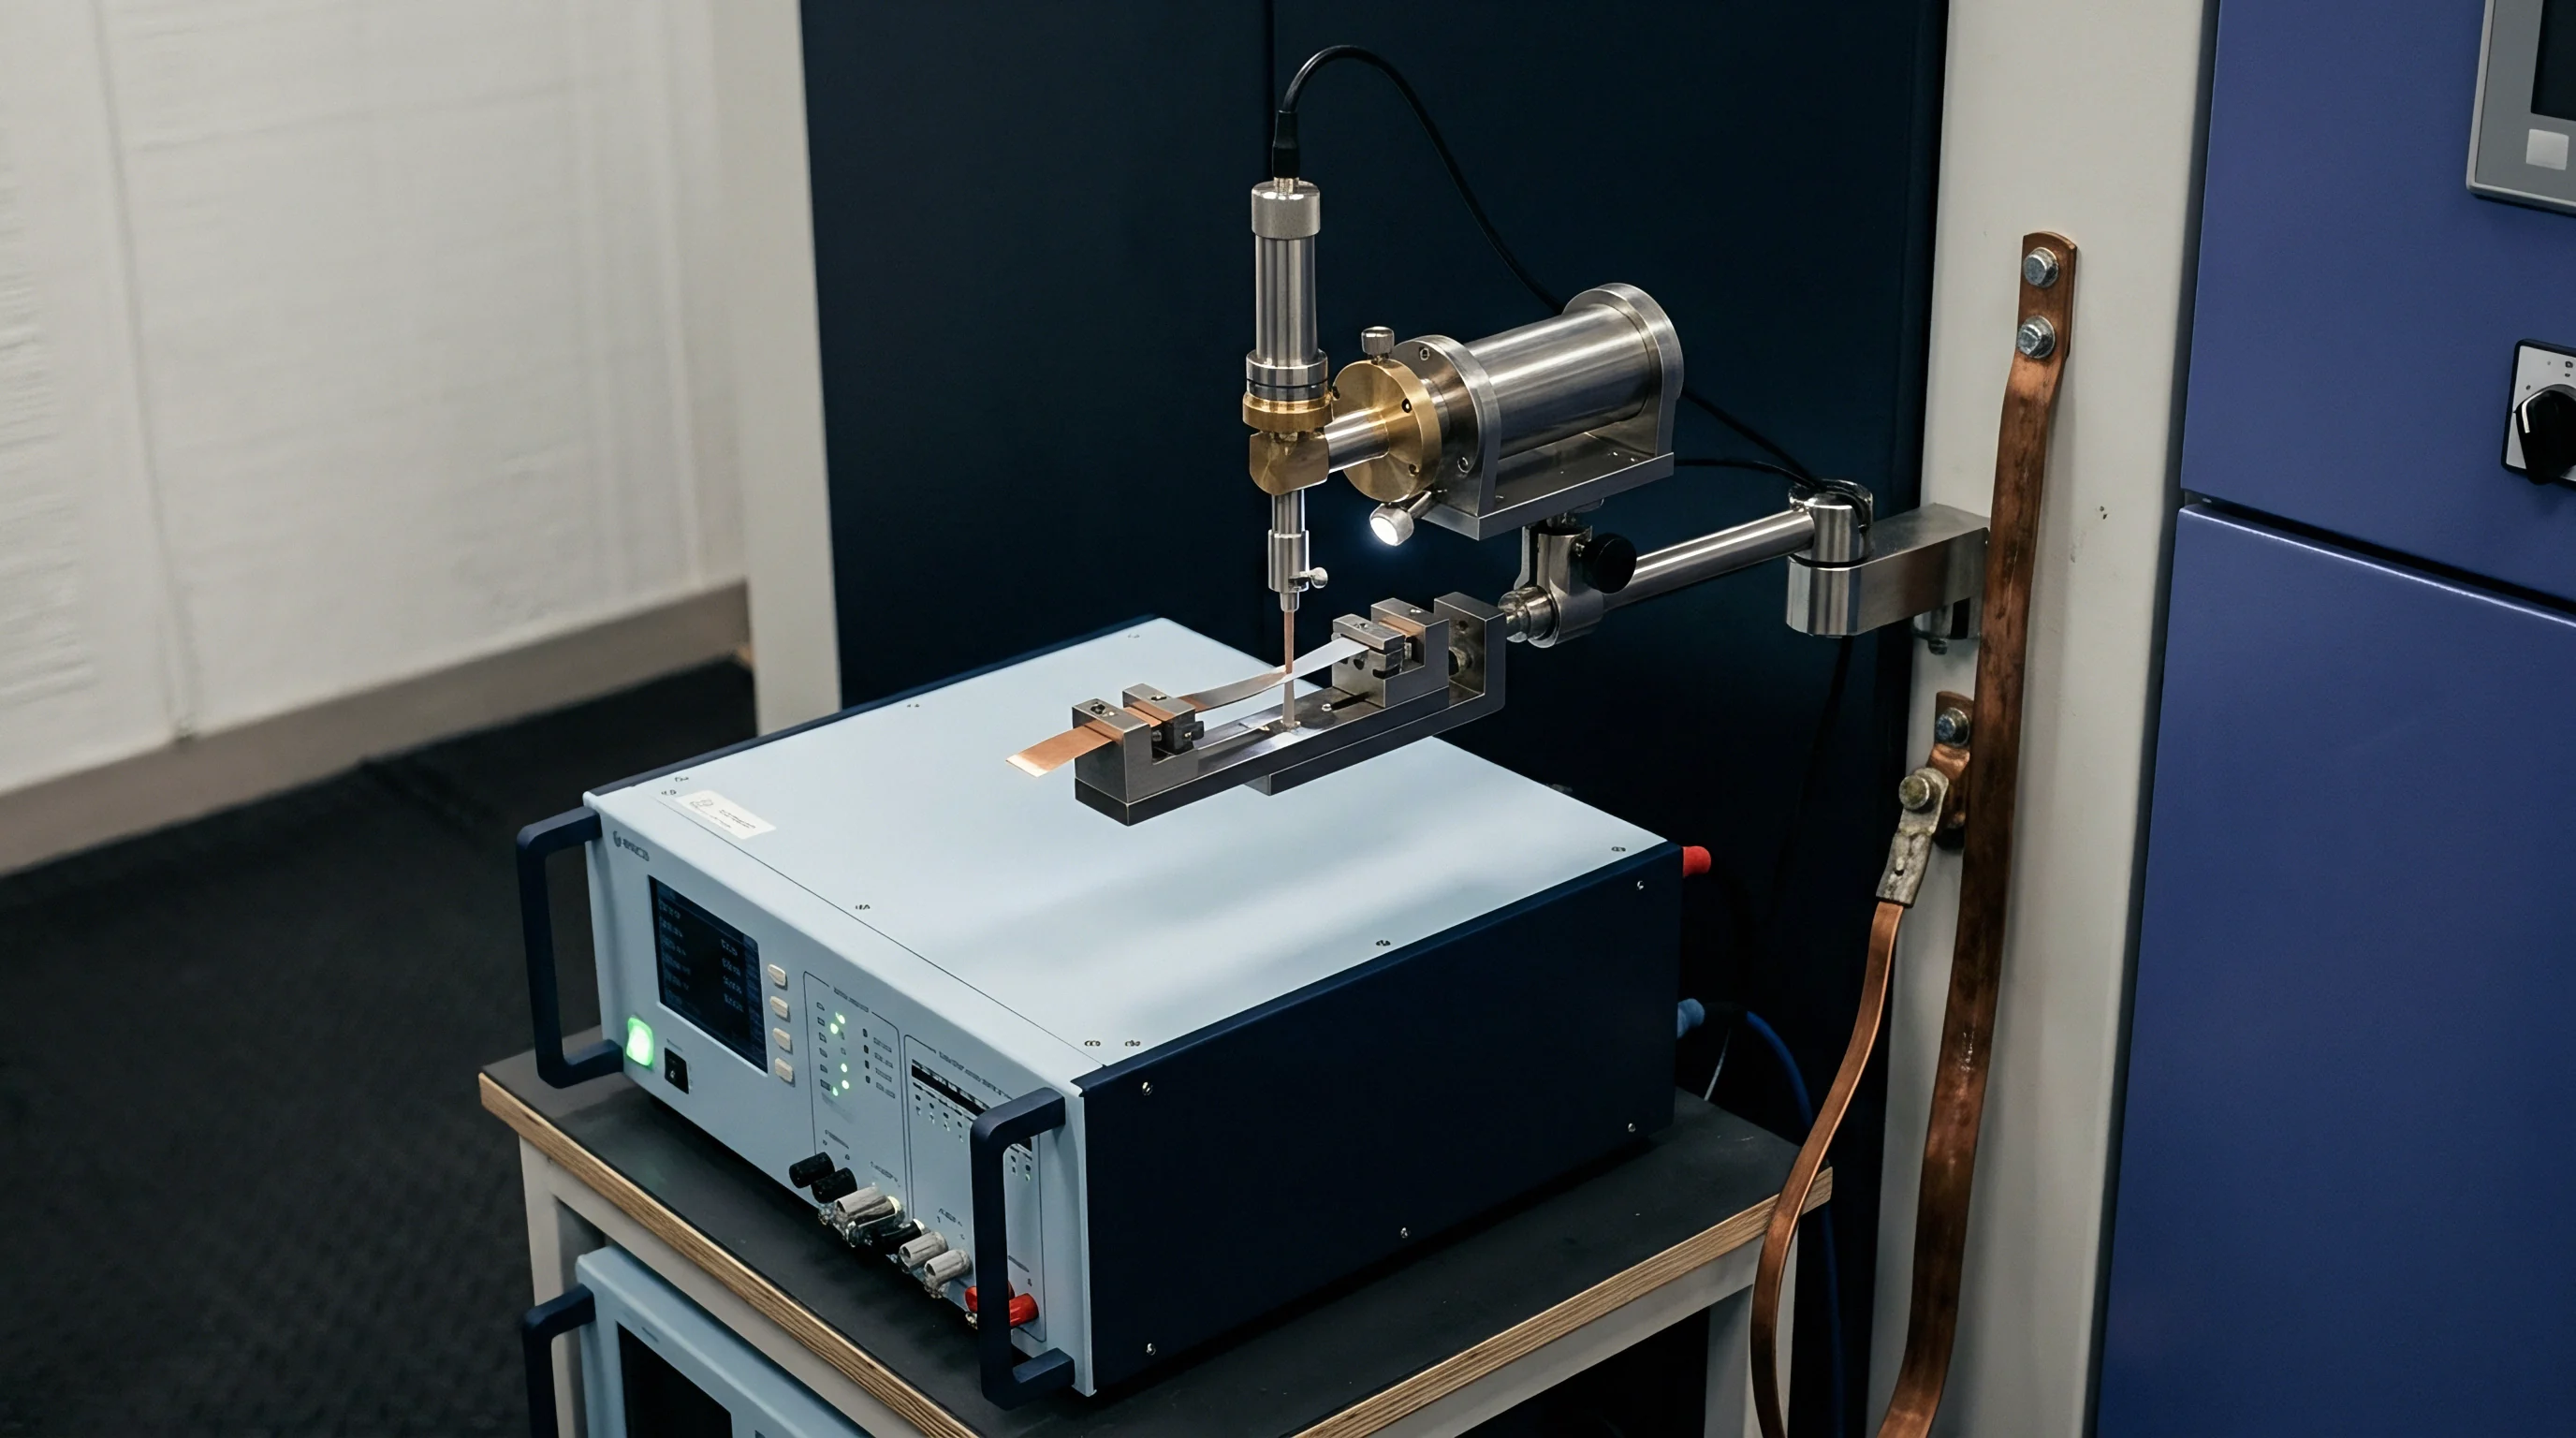
Automated test equipment accuracy degrades continuously across thousands of operational hours. Calibration seals preserve measurement integrity. Component aging, solid-state dielectric relaxation, and thermal cycling stress analog-to-digital converters, operational amplifiers, and current shunts.
Setting re-calibration intervals requires tracking historical calibration drift rates to project when a channel will exceed its maximum allowable measurement uncertainty threshold.
Empirical drift modeling relies on periodic verification data collected across multiple calibration cycles. If a voltage measurement channel drifts by 0.01 percent over 90 days, setting a 180-day recalibration schedule risks non-compliance toward the end of the operating window. Shorter intervals increase calibration costs and lower equipment availability.
Longer intervals risk invalidating qualification data collected on out-of-tolerance test channels.
Time Dependent Degradation of Analog Signal Chains
Component aging inside high-precision analog-to-digital converters causes baseline output voltages to shift over extended operational periods. Zener voltage references exhibit predictable logarithmic drift during their first thousand hours of continuous operation. Precision operational amplifiers experience input bias current shifts due to package stress relaxation.
Systematic recalibration restores zero points and scale factors to nominal standards.
How Do Automated Channels Self Check between Calibrations?
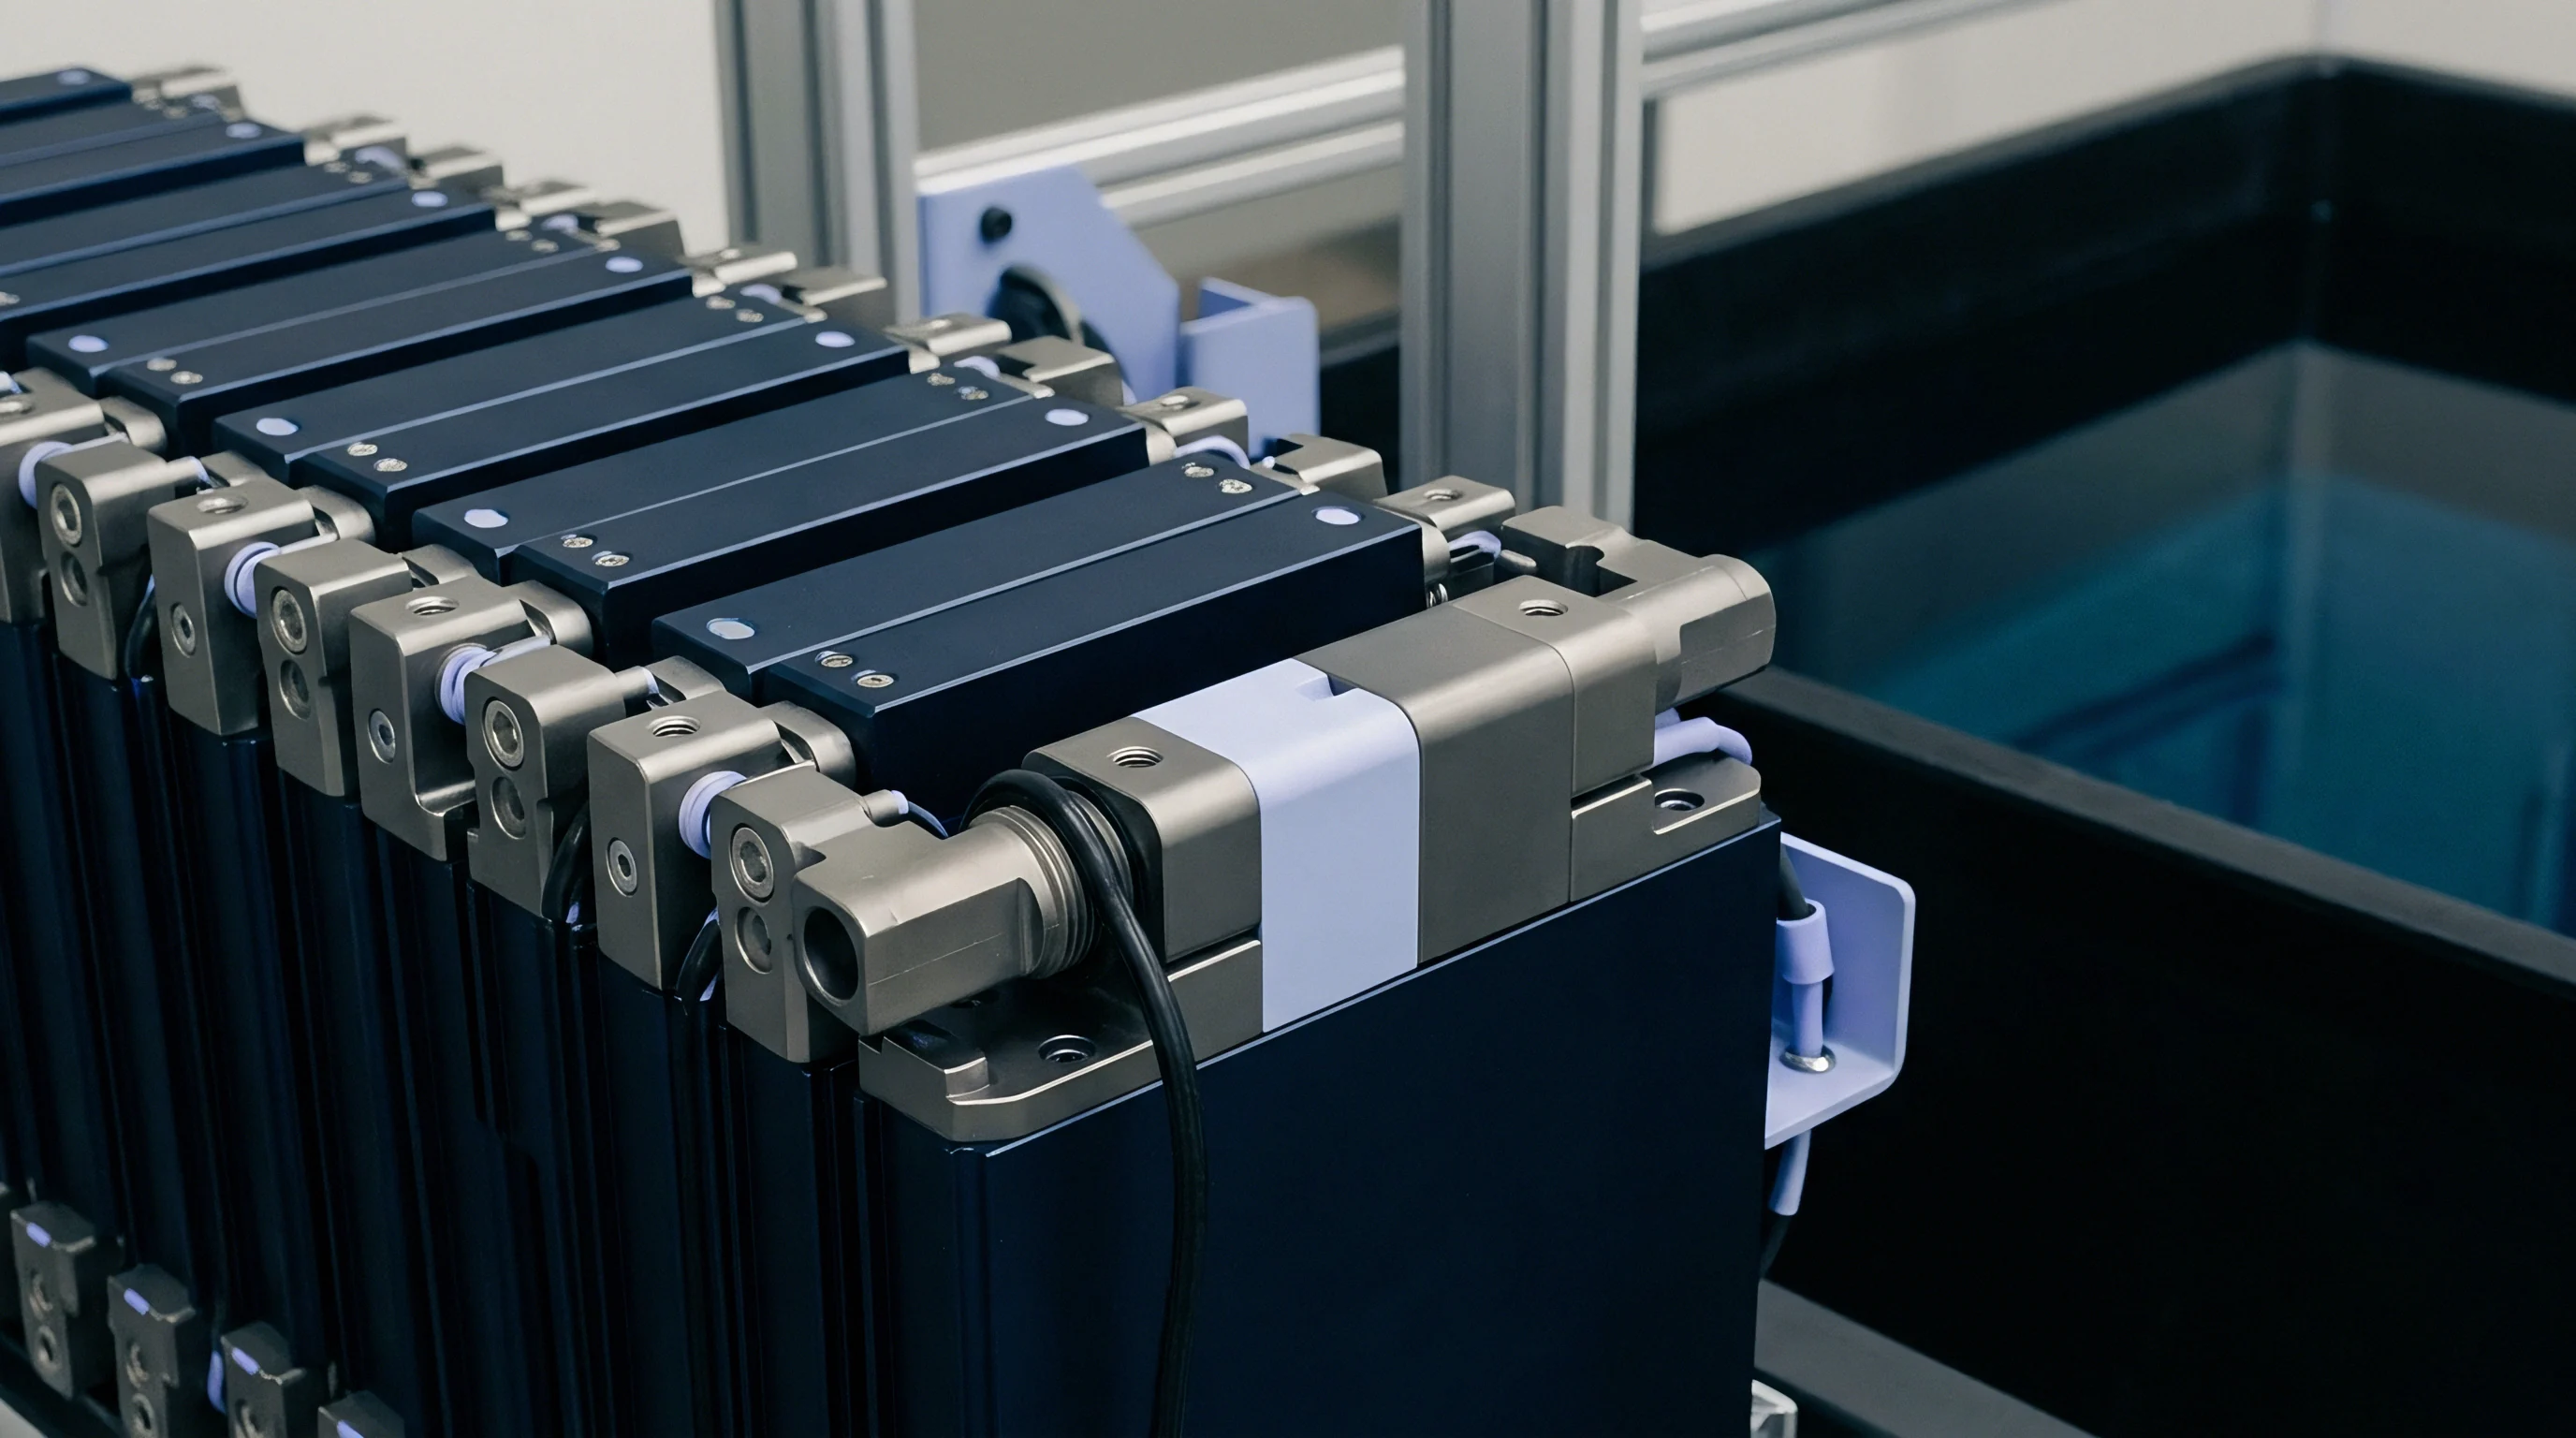
Automated test racks execute automated internal reference checks between cell testing cycles. Internal precision voltage sources and reference shunts verify channel health without manual technician intervention. The channel verification procedure operates through fixed sequential steps:
- Disconnect the test channel from the external cell holder terminals using high-reliability isolation relays.
- Apply a high-precision 2.5000-volt internal reference standard across the analog-to-digital converter input terminals.
- Record one thousand voltage samples and compute the mean channel reading along with peak-to-peak noise level.
- Compare the calculated mean value against stored calibration limits maintained inside internal flash memory.
- Flag the channel for manual technician recalibration if the offset error exceeds 0.02 percent of full scale.
Daily automated zero-point reference checks catch open-circuit sense wire failures before full batch cycling runs complete.
Extending calibration schedules past instrument drift limits results in invalidating months of qualification data and forfeiting cell warranty claims.
Dispute
Cell procurement contracts define strict capacity, rate capability, and impedance limits across commercial production lots. When cell buyers perform incoming inspection testing on automated cyclers that differ in calibration status from the cell manufacturer’s end-of-line testers, measurement mismatches arise. Uncalibrated channels skew sorting yields.
A systematic 0.2 percent difference in current measurement accuracy between factory and buyer test channels leads to lot rejection disputes involving thousands of battery cells.
Resolving commercial delivery disputes requires harmonizing measurement protocols and metrology standards between buyer and seller. Contracts must designate reference metrology equipment and calibration interval schedules. If incoming inspection records lower discharge capacity than factory release records, both parties verify test channel calibration histories and uncertainty budgets using certified secondary calibration standards.
- Standardized Reference Hardware Contracts specify master calibration fixtures used by both parties to verify test rack accuracy prior to lot acceptance testing.
- Harmonized Guardband Limits Purchase agreements explicitly define whether expanded measurement uncertainty is subtracted from cell specification boundaries during lot qualification.
- Shared Calibration Logs Equipment calibration certificates and automated internal reference check logs form mandatory components of incoming inspection records.
- Third-Party Arbitration Protocol Independent ISO 17025 accredited test laboratories arbitrate capacity disagreement cases using agreed-upon reference channels.
| Parameter Bias | Physical Cell Impact | Yield Misclassification Rate | Financial Consequence |
|---|---|---|---|
| +0.10% Current Drift | Over-reports capacity on discharge | 1.5% false acceptance of low-capacity cells | Increased field failure rate and pack-level module imbalance |
| -0.10% Current Drift | Under-reports capacity on discharge | 2.2% false rejection of premium grade cells | Unnecessary scrap costs and supplier margin erosion |
| +2.0 mV Voltage Bias | Prematurely hits upper charge cut-off limit | 1.1% false low-capacity classification | Down-grading cells to lower-value commercial applications |
| Assumes a 100,000-unit monthly production lot evaluated at a 50 US Dollar average unit selling price. | |||
Establishing transparent drift thresholds protects both cell manufacturers and pack integrators from financial friction caused by measurement bias.