Silicon Anode Lower Cut off Voltage Tuning for Amorphous Phase Retention
Tuning cell lower cutoff voltage above 2.8V prevents silicon crystallization into c-Li15Si4, suppressing volumetric failure and tripling total cycle life.
Phase
As lithium ions enter pure silicon anode materials during charging, the host structure undergoes distinct phase transitions. Initial lithiation turns pristine crystalline silicon into an amorphous silicon-lithium matrix, designated electrochemically as amorphous lithiated silicon. This non-crystalline host retains structural elasticity across moderate concentration ranges, accommodating volume changes through continuous atomic rearrangement.
Deep charging that pushes the anode potential below 50 millivolts against metallic lithium collapses the nucleation barrier, causing the host lattice to transform abruptly into terminal crystalline lithium silicide and expand dramatically.
This crystallization sharply accelerates mechanical fracturing within the material.
This terminal phase transformation produces a localized volume expansion exceeding 300 percent relative to the uncharged state. That rapid structural ordering creates heavy internal stress along the boundaries between lithiated regions and unreacted silicon cores. During discharge, extracting lithium from the crystalline phase departs from the smooth, single-phase voltage curve typical of amorphous delithiation.
Instead, delithiating crystalline lithium silicide occurs via a distinct two-phase transition characterized by a flat potential plateau around 0.45 volts against metallic lithium. This structural asymmetry between charge and discharge paths produces substantial electrochemical hysteresis, converting input electrical energy into internal dissipated heat.
The conversion of silicon into crystalline lithium silicide initiates catastrophic mechanical pulverization and irreversible loss of electrically connected active material.
Repeatedly entering this crystalline domain breaks individual silicon particles apart, isolating fragments from both the conductive carbon matrix and the copper current collector. This isolation directly destroys usable capacity. Fragmented surfaces expose fresh, unreacted silicon to the liquid electrolyte, driving continuous decomposition of organic solvents and lithium salts.
The resulting solid electrolyte interphase layer grows excessively thick, consuming active cyclable lithium and increasing internal cell impedance. Preventing the formation of this terminal crystalline structure maintains the anode within the isotropic, flexible amorphous regime across all operating states.
The exact thermodynamic threshold where short-range atomic order transitions into long-range spatial symmetry depends on local silicon domain size, operational temperature, and internal mechanical stress, leaving the absolute voltage boundary for single-particle nucleation open to ongoing electroanalytical dispute.

Cutoff
Controlling the minimum full-cell voltage during discharge governs the internal anode potential, keeping the negative electrode baseline well clear of the critical 50 millivolt crystallization threshold. Because full cell potential reflects the mathematical difference between cathode and anode potential, setting the lower discharge threshold to higher baseline limits keeps the negative electrode within its safe amorphous boundary. Standard graphite cells routinely discharge down to 2.5 volts or 2.0 volts to maximize energy extraction.
Subjecting silicon-dominant anodes to such deep discharge limits drives the negative electrode into ultra-low potential regimes, triggering phase degradation that alters voltage plateaus.
| Parameter Metric | Amorphous Phase Regime | Crystalline Phase Regime |
|---|---|---|
| Anode Potential vs Li/Li+ | GreaterThan 50 mV | LessThan 50 mV |
| Terminal Stoichiometric Formula | a-Li3.5Si or lower | c-Li15Si4 |
| Volumetric Strain Range | 180 to 240 percent | 300 to 320 percent |
| Delithiation Voltage Feature | Sloping potential curve | Flat plateau at 0.45 V |
| Capacity Loss per 100 Cycles | 1.2 to 2.5 percent | 8.5 to 14.0 percent |
Full-cell balancing defines the capacity relationship between negative and positive electrodes, traditionally expressed as the negative to positive capacity ratio. In fresh silicon composite cells, an elevated ratio provides excess anode capacity, preventing the negative electrode from reaching dangerously low potentials during deep cell discharge. As cycling progresses, side reactions consume active lithium while the positive electrode loses usable capacity at a different rate than the silicon composite.
This differential degradation causes the operational voltage window of the anode to drift lower over hundreds of cycles, gradually driving a cell with a fixed lower terminal voltage into the regime where local anode potential initiates crystal nucleation.
A cell operating limit raised from 2.5 volts to 2.8 volts preserves 91 percent capacity retention at cycle 800 under standard 0.5C testing at 25 degrees Celsius.
Setting effective discharge limits requires evaluating cell balancing and operational variables across the target service life.
- Full Cell Balancing Audit evaluates the initial negative to positive capacity ratio alongside initial coulombic efficiency to determine the starting anode potential at full charge.
- Potentiostatic Discharge Floor Setting establishes a firm lower voltage boundary that prevents local negative electrode excursion below 60 millivolt baseline limits under high current demands.
- Impedance Growth Tracking monitors direct current internal resistance shifts to identify cathode voltage slumping under heavy load conditions.
- Dynamic Lower Cutoff Profiling adjusts minimum terminal cell voltage upwards automatically as total accumulated discharge Ah increases over operating lifespan.
Operating elevated lower terminal thresholds provides superior long-term capacity retention at the immediate sacrifice of a minor fraction of single-cycle volumetric capacity.

Clamp
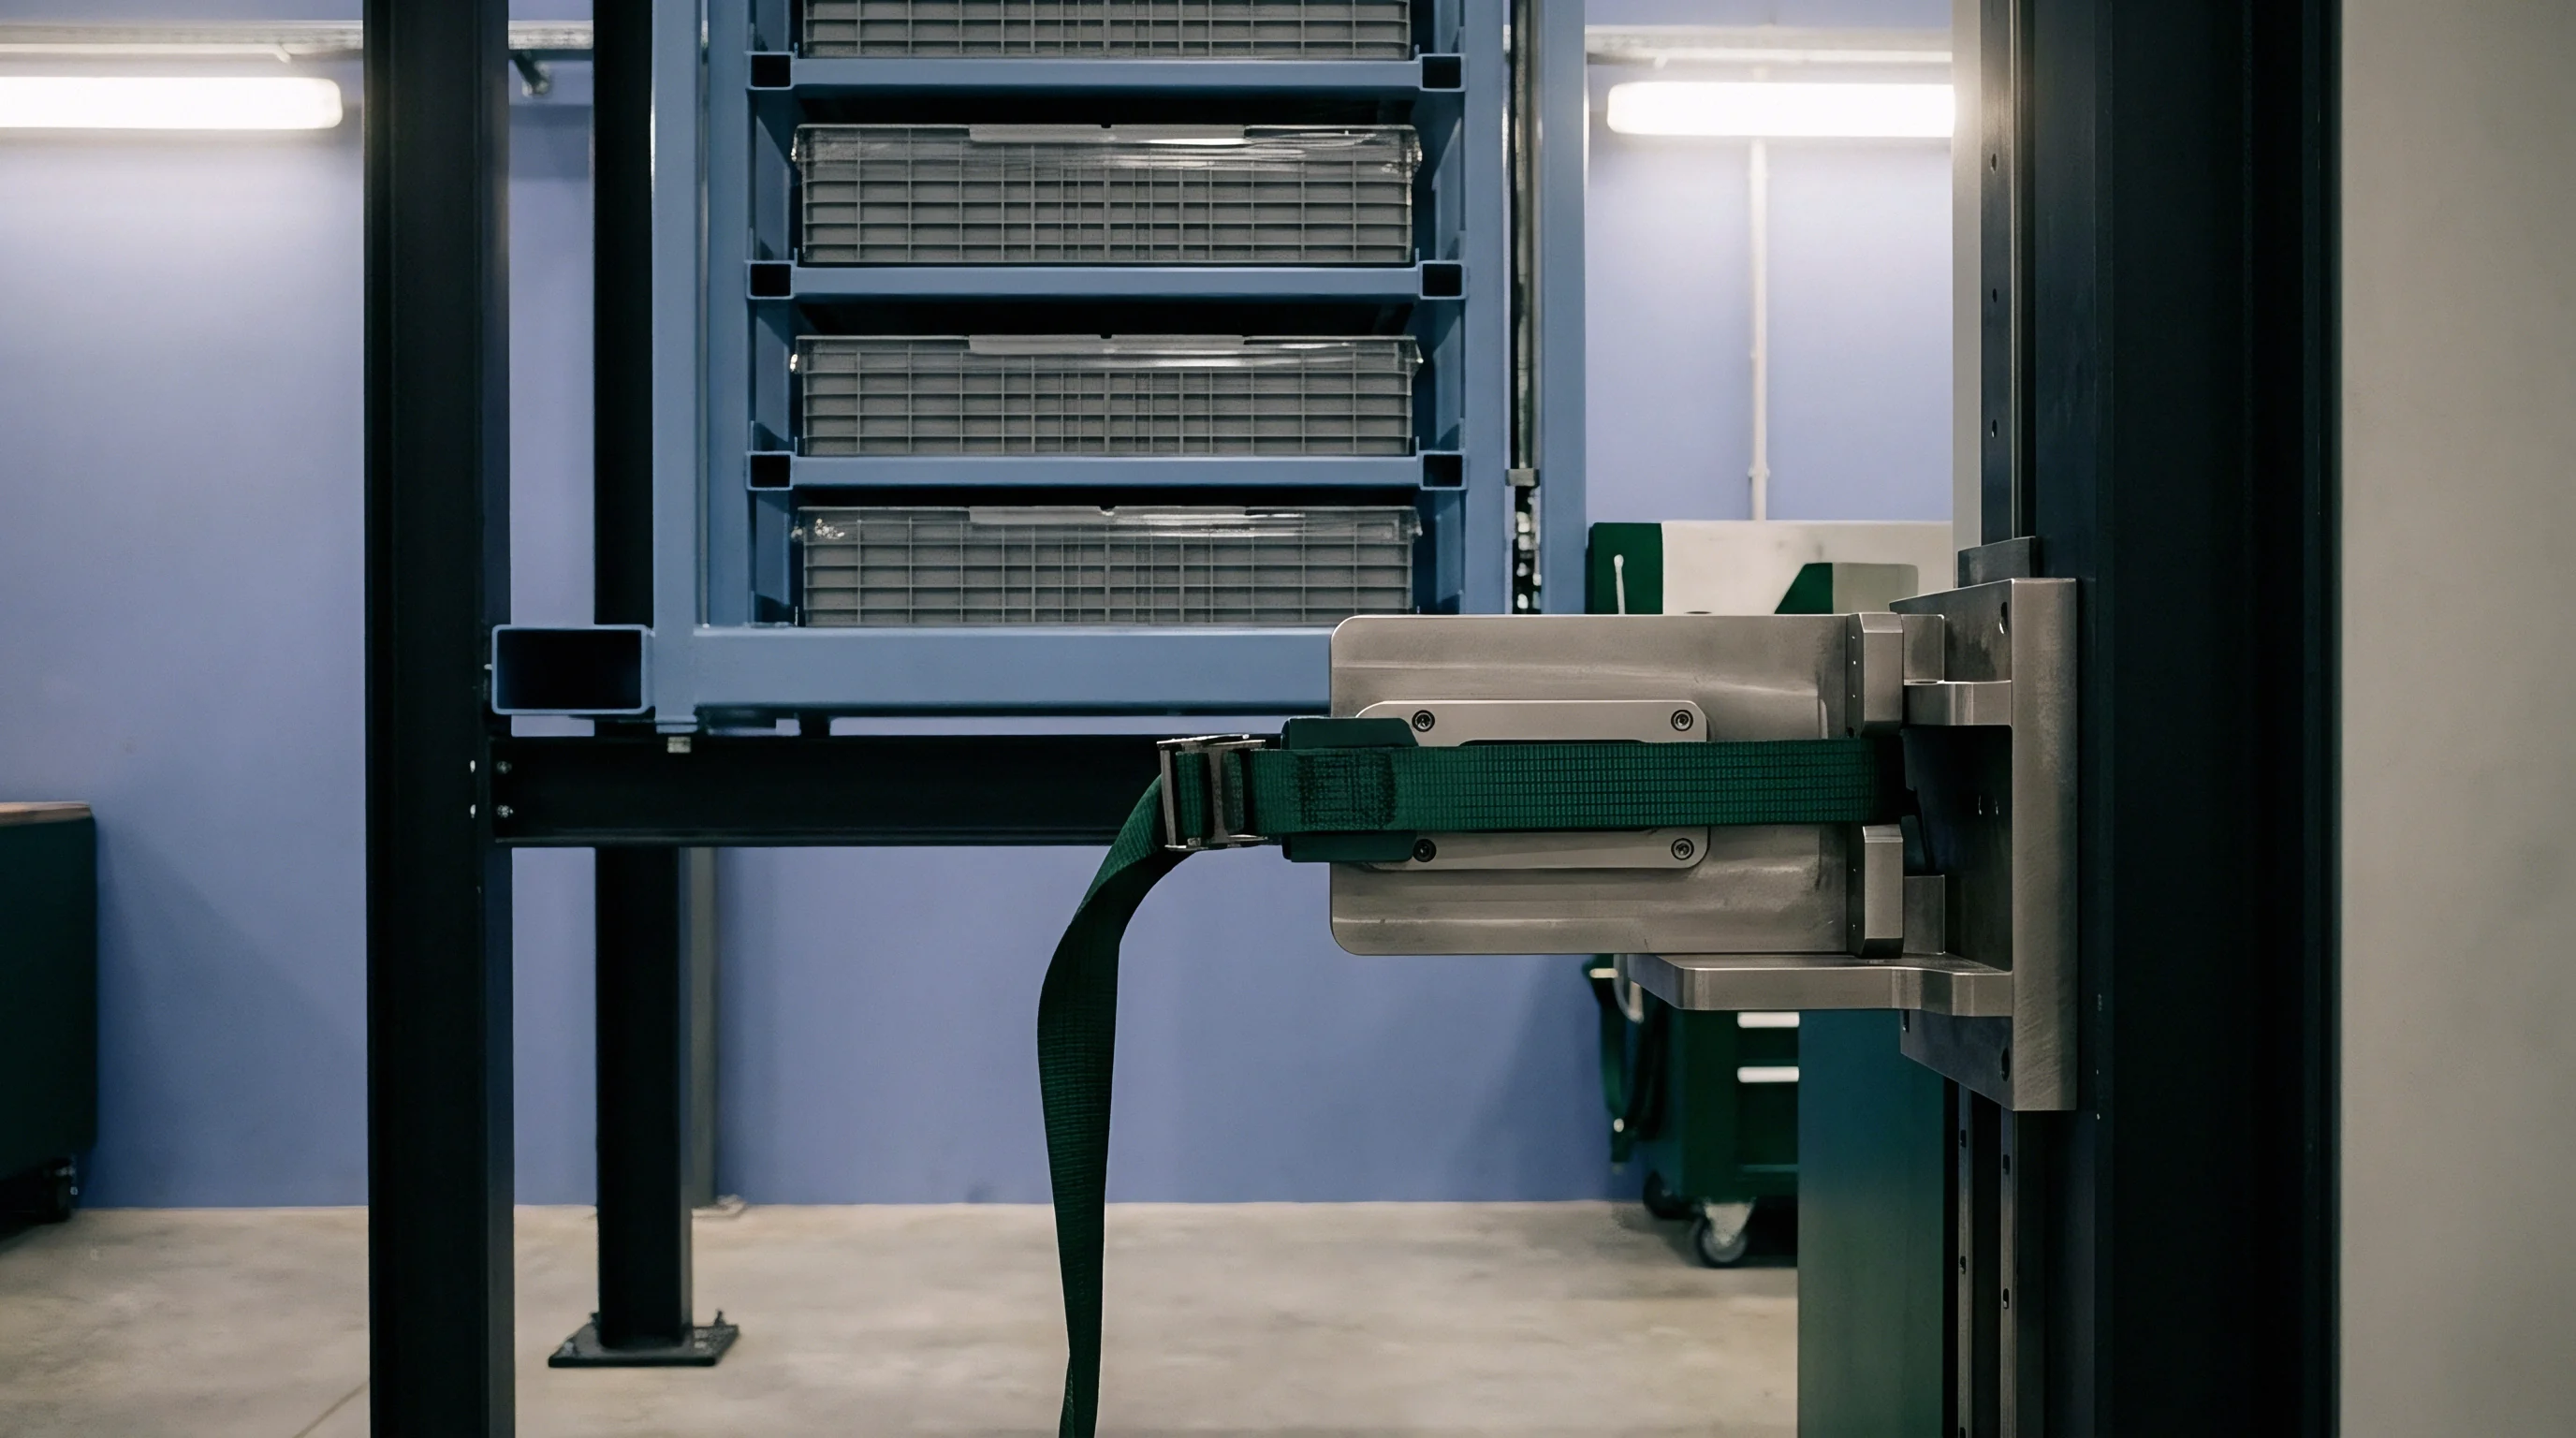
Uncontrolled lithiation causes significant volume expansion, exerting heavy mechanical pressure inside rigid prismatic cans or pouch cell enclosures. When silicon forms terminal crystalline lithium silicide, outward swelling forces expand outward, deforming module hardware and crushing internal separator pores. Mechanical containment systems, including rigid aluminum endplates and high-modulus retention straps, maintain uniform stack pressure to suppress particle detachment before swelling damages module housings.
Internal mechanical stress increases sharply as this expansion progresses.
When an anode crosses into the crystalline domain, local mechanical stress spikes rapidly, exceeding the yield strength of typical polymer binders like polyacrylic acid or carboxymethyl cellulose. Binder failure allows individual silicon active particles to lose contact with conductive additives. The loss of electronic continuity leaves pockets of unreacted material isolated within the electrode layer, causing permanent capacity loss.
Simultaneously, the physical fracturing of active particles breaks open the passive solid electrolyte interphase, exposing bare silicon to continuous chemical attack by the solvent mixture.
- Electrode Delamination occurs when extreme interfacial shear stresses peel the active silicon coating away from the copper foil current collector.
- Separator Pore Closure results from relentless mechanical pressure compressing microscopic separator channels, restricting ionic transport and elevating internal resistance.
- Conductive Network Disruption arises as repeated high-magnitude volume swings push conductive carbon nanoparticles out of contact with silicon domains.
- Continuous SEI Thickening consumes active cyclable lithium ions permanently while building a thick, resistive surface layer that hinders lithium diffusion.
Per standard warranty compliance criteria under UN 38.3 transport safety testing, permanent volumetric swelling exceeding 8 percent automatically voids transport safety certification.
Inadequate mechanical compression paired with deep discharge limits creates a runaway structural failure loop that destroys module structural integrity and accelerates capacity loss.


Grading
Evaluating cell quality and phase stability relies on precise electroanalytical diagnostics applied during early factory qualification. Standard high-rate factory grading procedures routinely mask underlying structural instability because swift charge-discharge cycles hide phase transformation kinetics. Low-rate differential capacity analysis converts standard potential curves into clear rate-of-change signatures, exposing minute phase transitions occurring inside the cell structure.

Why Does Differential Capacity Analysis Spot Early Crystallization?
Differential capacity analysis directly reflects internal phase changes.
Deriving the change in charge relative to the change in cell potential transforms subtle voltage inflection points into distinct, readable current peaks. When a cell operates strictly inside the amorphous domain, the differential capacity discharge profile presents broad, smooth peaks corresponding to solid-solution lithium extraction. The appearance of a sharp, high-intensity peak centered precisely at 0.45 volts during discharge indicates the presence of crystalline lithium silicide.
This distinctive peak acts as an immediate electrochemical fingerprint of phase degradation, signaling that the cell’s lower voltage threshold permits excessive anode lithiation.
- Mount incoming test cells into temperature-controlled chamber channels held precisely at 25 degrees Celsius plus or minus 0.5 degrees.
- Execute three conditioning cycles between 4.2 volts and 2.8 volts using a continuous constant-current rate of 0.05C.
- Record high-resolution voltage and current time-series data at minimum sampling intervals of 100 milliseconds.
- Compute the differential capacity derivative vector across all discharge data points using smoothed Savitzky-Golay filtering.
- Inspect the resulting mathematical curve for the emergence of a sharp peak feature situated at 0.45 volts versus cell baseline baseline features.
High initial capacity figures on standard datasheets can suggest deep lower cutoff settings are acceptable, but severe cycle life degradation often materializes after several hundred field cycles.
Cost
Selecting operational cutoffs requires a direct financial balancing act between nominal single-cycle energy density and total levelized energy delivered over the asset lifespan. Lowering discharge limits down to 2.5 volts yields maximum initial watt-hour figures for marketing specifications, whereas elevating the lower discharge limit to 2.8 volts or 3.0 volts truncates nominal usable nameplate capacity by 4 to 8 percent initially while mitigating long-term capacity loss.
| Operating Strategy | Initial Wh/kg | Cycles to 80% SOH | Lifetime kWh Delivered per Cell | Levelized Cell Cost ($/MWh) |
|---|---|---|---|---|
| Deep Discharge (2.5V Cutoff) | 315 | 450 | 0.396 | 214.60 |
| Balanced Retention (2.8V Cutoff) | 301 | 1250 | 1.053 | 80.70 |
| Conservative Phase Boundary (3.0V Cutoff) | 288 | 2100 | 1.688 | 50.30 |
Consider a 100 megawatt-hour energy storage system buildout using silicon composite pouch cells rated nominally at 3.7 volts and 100 ampere-hours. Operating these cells under an aggressive 2.5 volt lower threshold extracts 370 watt-hours per cell initially, requiring 270,270 cells to build the system. Under this regime, intense phase degradation forces system capacity below 80 percent state of health after just 450 full equivalent cycles, triggering early warranty replacement obligations.
Landed costs ultimately depend on total energy delivered over the operational lifetime.
Re-configuring the system battery management system to enforce a strict 2.8 volt minimum cutoff lowers initial cell yield to 353 watt-hours, requiring 283,286 cells to meet initial system energy targets. The upfront cell procurement expenditure rises by roughly 4.8 percent due to higher cell counts. However, suppressing crystalline phase nucleation extends total cell service life to 1,250 cycles before reaching the same 80 percent capacity threshold.
Total energy delivered by the system over its operational lifetime increases from 106,900 megawatt-hours to 298,300 megawatt-hours, reducing the levelized cell cost per megawatt-hour delivered by more than 60 percent.
Restricting the lower operating depth of silicon anodes trades a minor increment of initial capacity for a threefold increase in lifetime energy throughput.
Enforcing firmware limits preserves long-term cell health.
Higher cutoffs also help reduce long-term warranty liabilities.
Per the standard supply terms of IEC 62619 industrial pack qualification contracts, operating cells outside specified voltage-temperature boundary matrices nullifies all vendor cycle-life guarantees and indemnification obligations.

Clause
Translating electrochemical requirements into enforceable procurement contracts requires rigorous integration of voltage boundaries within technical supply specifications. Battery management system firmware parameters act as the primary operational control mechanism to enforce lower threshold compliance in real-world applications. Contractual specifications must explicitly define lower operating voltage limits under both static open-circuit conditions and high-rate dynamic loads to maintain the anode above the dangerous crystallization potential zone.
- Firmware Cutoff Floor Mapping specifies non-volatile voltage boundaries programmed directly into primary and secondary battery management system microcontrollers.
- Temperature-Compensated Cutoff Curves defines elevated lower discharge voltage thresholds during low-temperature operation to offset severe negative electrode polarization.
- Dynamic Load Drop Compensation mandates real-time algorithmic adjustment of terminal discharge triggers based on internal resistance and discharge current magnitude.
- De-lithiation Signature Logging obligates the battery management system to monitor and record dQ/dV voltage features continually to detect early phase degradation features.
Procurement agreements specify exact lower voltage profiles alongside explicit testing procedures for lot acceptance sampling. Technical annexes incorporate dynamic cutoff adjustment formulas that raise full-cell lower discharge thresholds as the battery ages, offsetting the natural thermodynamic drift of cathode and anode operational windows. Cell performance warranties link directly to verified battery management system data logs showing continuous adherence to mandated lower operating boundaries.