Modeling Phase Transformation Speed in Multi Component Solid State Battery Anodes
Phase transformation speed in multi-component solid-state battery anodes depends on stress-coupled lithium interdiffusion and stack pressure boundary conditions.


Kinetics
Multi-component intermetallic anodes undergo distinct solid-state structural transitions during electrochemical lithiation and delithiation cycles. Without liquid-phase ion relaxation in solid-state cell architectures, phase boundary migration rates set the upper limit for continuous C-rate capability. Active material systems incorporating multi-component formulations ~ such as silicon-germanium nanocomposites, lithium-magnesium binary alloys, or high-entropy metal matrices ~ rely on multi-stage interdiffusion processes that differ fundamentally from classical single-element intercalating host materials.

Thermodynamic Driving Forces in Multi Element Alloys
Chemical potential gradients control species transport within composite host materials. As lithium ions cross the solid electrolyte interface into a multi-component anode particle, localized surface stoichiometry shifts rapidly. This concentration accumulation generates a localized Gibbs free energy variance, initiating a phase transition from the initial host structure to lithium-rich intermetallic structures.
The total driving force for phase migration combines local chemical free energy differences with strain energy density derived from volume expansion. In a binary silicon-germanium matrix, lithiation proceeds through sequential amorphous and crystalline intermediate states. Chemical diffusion coefficients within binary lithium-silicon intermetallic phases drop from 2.4 x 10^-10 cm²/s in lithium-rich phases to 1.1 x 10^-12 cm²/s across the stoichiometric transformation plateau at 25°C.
Chemical diffusion coefficients within binary lithium-silicon intermetallic phases drop from 2.4 x 10^-10 cm²/s in lithium-rich phases to 1.1 x 10^-12 cm²/s across the stoichiometric transformation plateau at 25°C.

Phase Field Formulations for Diffuse Solid Transformations
Continuum models track partial mass distribution across broad interfacial zones. The Cahn-Hilliard equation governs species concentration profiles, while the Allen-Cahn equation models structural order parameters. Coupling these equations yields non-linear partial differential equations describing interface migration velocity v as a function of mobility M, interfacial gradient energy coefficient kappa, and local thermodynamic chemical potential mu.
Mathematical representation of the phase front velocity follows the continuous spatial gradient balance across the interface boundary:
v = -M ( d^2 mu / dx^2 – kappa d^3 eta / dx^3 )
Where eta represents the non-conserved order parameter separating phase states. Multi-component formulations complicate this balance because each alloying constituent introduces distinct partial molar volumes and chemical activity coefficients. In ternary alloy systems, solute drag effects slow phase boundary propagation relative to pure elemental hosts.
Local current density spikes at defects.
| Anode System Composition | Transformed Phase State | Diffusion Coefficient (cm²/s at 25°C) | Activation Energy (eV) | Volumetric Expansion (%) |
|---|---|---|---|---|
| Si60-Ge20-C20 Nanocomposite | Li13Si4-like Amorphous | 3.2 x 10^-11 | 0.42 | 185 |
| Li90-Mg10 Alloy Matrix | BCC Beta-Phase Li-Mg | 1.8 x 10^-8 | 0.21 | 18 |
| Si80-Sn10-C10 Alloy Composite | Li17Sn4 / Li13Si4 Phase Mixture | 8.5 x 10^-11 | 0.38 | 210 |
| High-Entropy Al-Bi-In-Sn-Pb | Multi-Intermetallic Solid Solution | 6.1 x 10^-10 | 0.29 | 95 |
Whether non-equilibrium phase nucleation pathways under extreme C-rates bypass crystalline intermetallic stages entirely remains an open analytical question.


Mesh
Spatial discretizations in numerical solver schemes determine computational accuracy when tracking steep concentration gradients. Solid-state anodes experience localized physical dimension changes during phase propagation, requiring dynamic spatial grids capable of resolving sub-nanometer concentration profiles without causing numerical mass loss or grid-induced artificial boundary locking.

Spatial Discretization of Moving Intermetallic Fronts
Nodal densities along narrow phase transitions dictate solver stability. A standard fixed Eulerian mesh requires extreme element refinement across the entire anode domain to capture phase interfaces that measure between 0.5 and 2.0 nanometers in thickness. This structural discretization leads to unmanageable computational overhead when modeling full particle geometry.
Adaptive Mesh Refinement (AMR) dynamically alters element sizes, placing high-density nodal clusters exclusively along the phase front gradient.
Because phase transformations generate internal stress, spatial elements within the active transformation zone must shrink to sub-nanometer scales while background structural nodes retain larger spatial dimensions. When element aspect ratios exceed three to one near moving boundary boundaries, artificial numerical diffusion artificially broadens the calculated phase transition width.
Spatial grid size across diffuse intermetallic boundaries cannot exceed one fifth of the characteristic gradient transition zone without introducing numerical pinning.
Sharp Interface Tracking versus Phase Field Methods
Explicit boundary tracking models enforce strict jump conditions across phase discontinuities. The Stefan problem formulation tracks the spatial position s(t) of the phase front by evaluating mass conservation directly at the boundary interface:
rho L ( ds / dt ) = -D1 ( dC1 / dx ) + D2 ( dC2 / dx )
Where rho represents local mass density, L represents latent enthalpy of transformation, and D1, D2 represent interdiffusion coefficients across adjacent phase regions. Sharp interface tracking works well for binary alloys with well-defined stoichiometric transitions. Multi-component alloys exhibit diffuse transformation regions where intermediate phases coexist over microscale domains, making diffuse phase-field continuum discretizations computationally superior.
Numerical simulation reliability drops when boundary conditions fail to capture physical failure mechanisms unique to solid-state systems:
- Spuriously sharp stress artifacts emerge when spatial element dimensions exceed the characteristic phase interface width of 1.5 nanometers during fast lithiation solver steps.
- Numerical lattice pinning forces artificial stagnation of phase transformation fronts on structured grids during low-rate discharge calculations.
- Mass conservation drift accumulates over cyclic phase changes when fixed Eulerian grids miss localized boundary migration across moving boundaries.
- Singular current densities develop at triple-phase junctions whenever finite element nodes misalign with solid electrolyte contact points.
Unexpected cell capacity degradation during fast charge often stems from unresolved meshing artifacts in baseline phase transformation models rather than chemical degradation at solid electrolyte contact surfaces.


Stress
Volumetric strain generated during intermetallic phase transitions creates severe hydrostatic pressure fields inside solid-state cell structures. Dense solid electrolytes like garnet-type LLZO or sulfide-based argyrodites provide rigid mechanical boundaries that prevent unconstrained anode swelling. This mechanical confinement alters the thermodynamic equilibrium state of the anode material, modifying local phase transformation velocities.
Electrochemical Mechanical Coupling under Solid Constraint
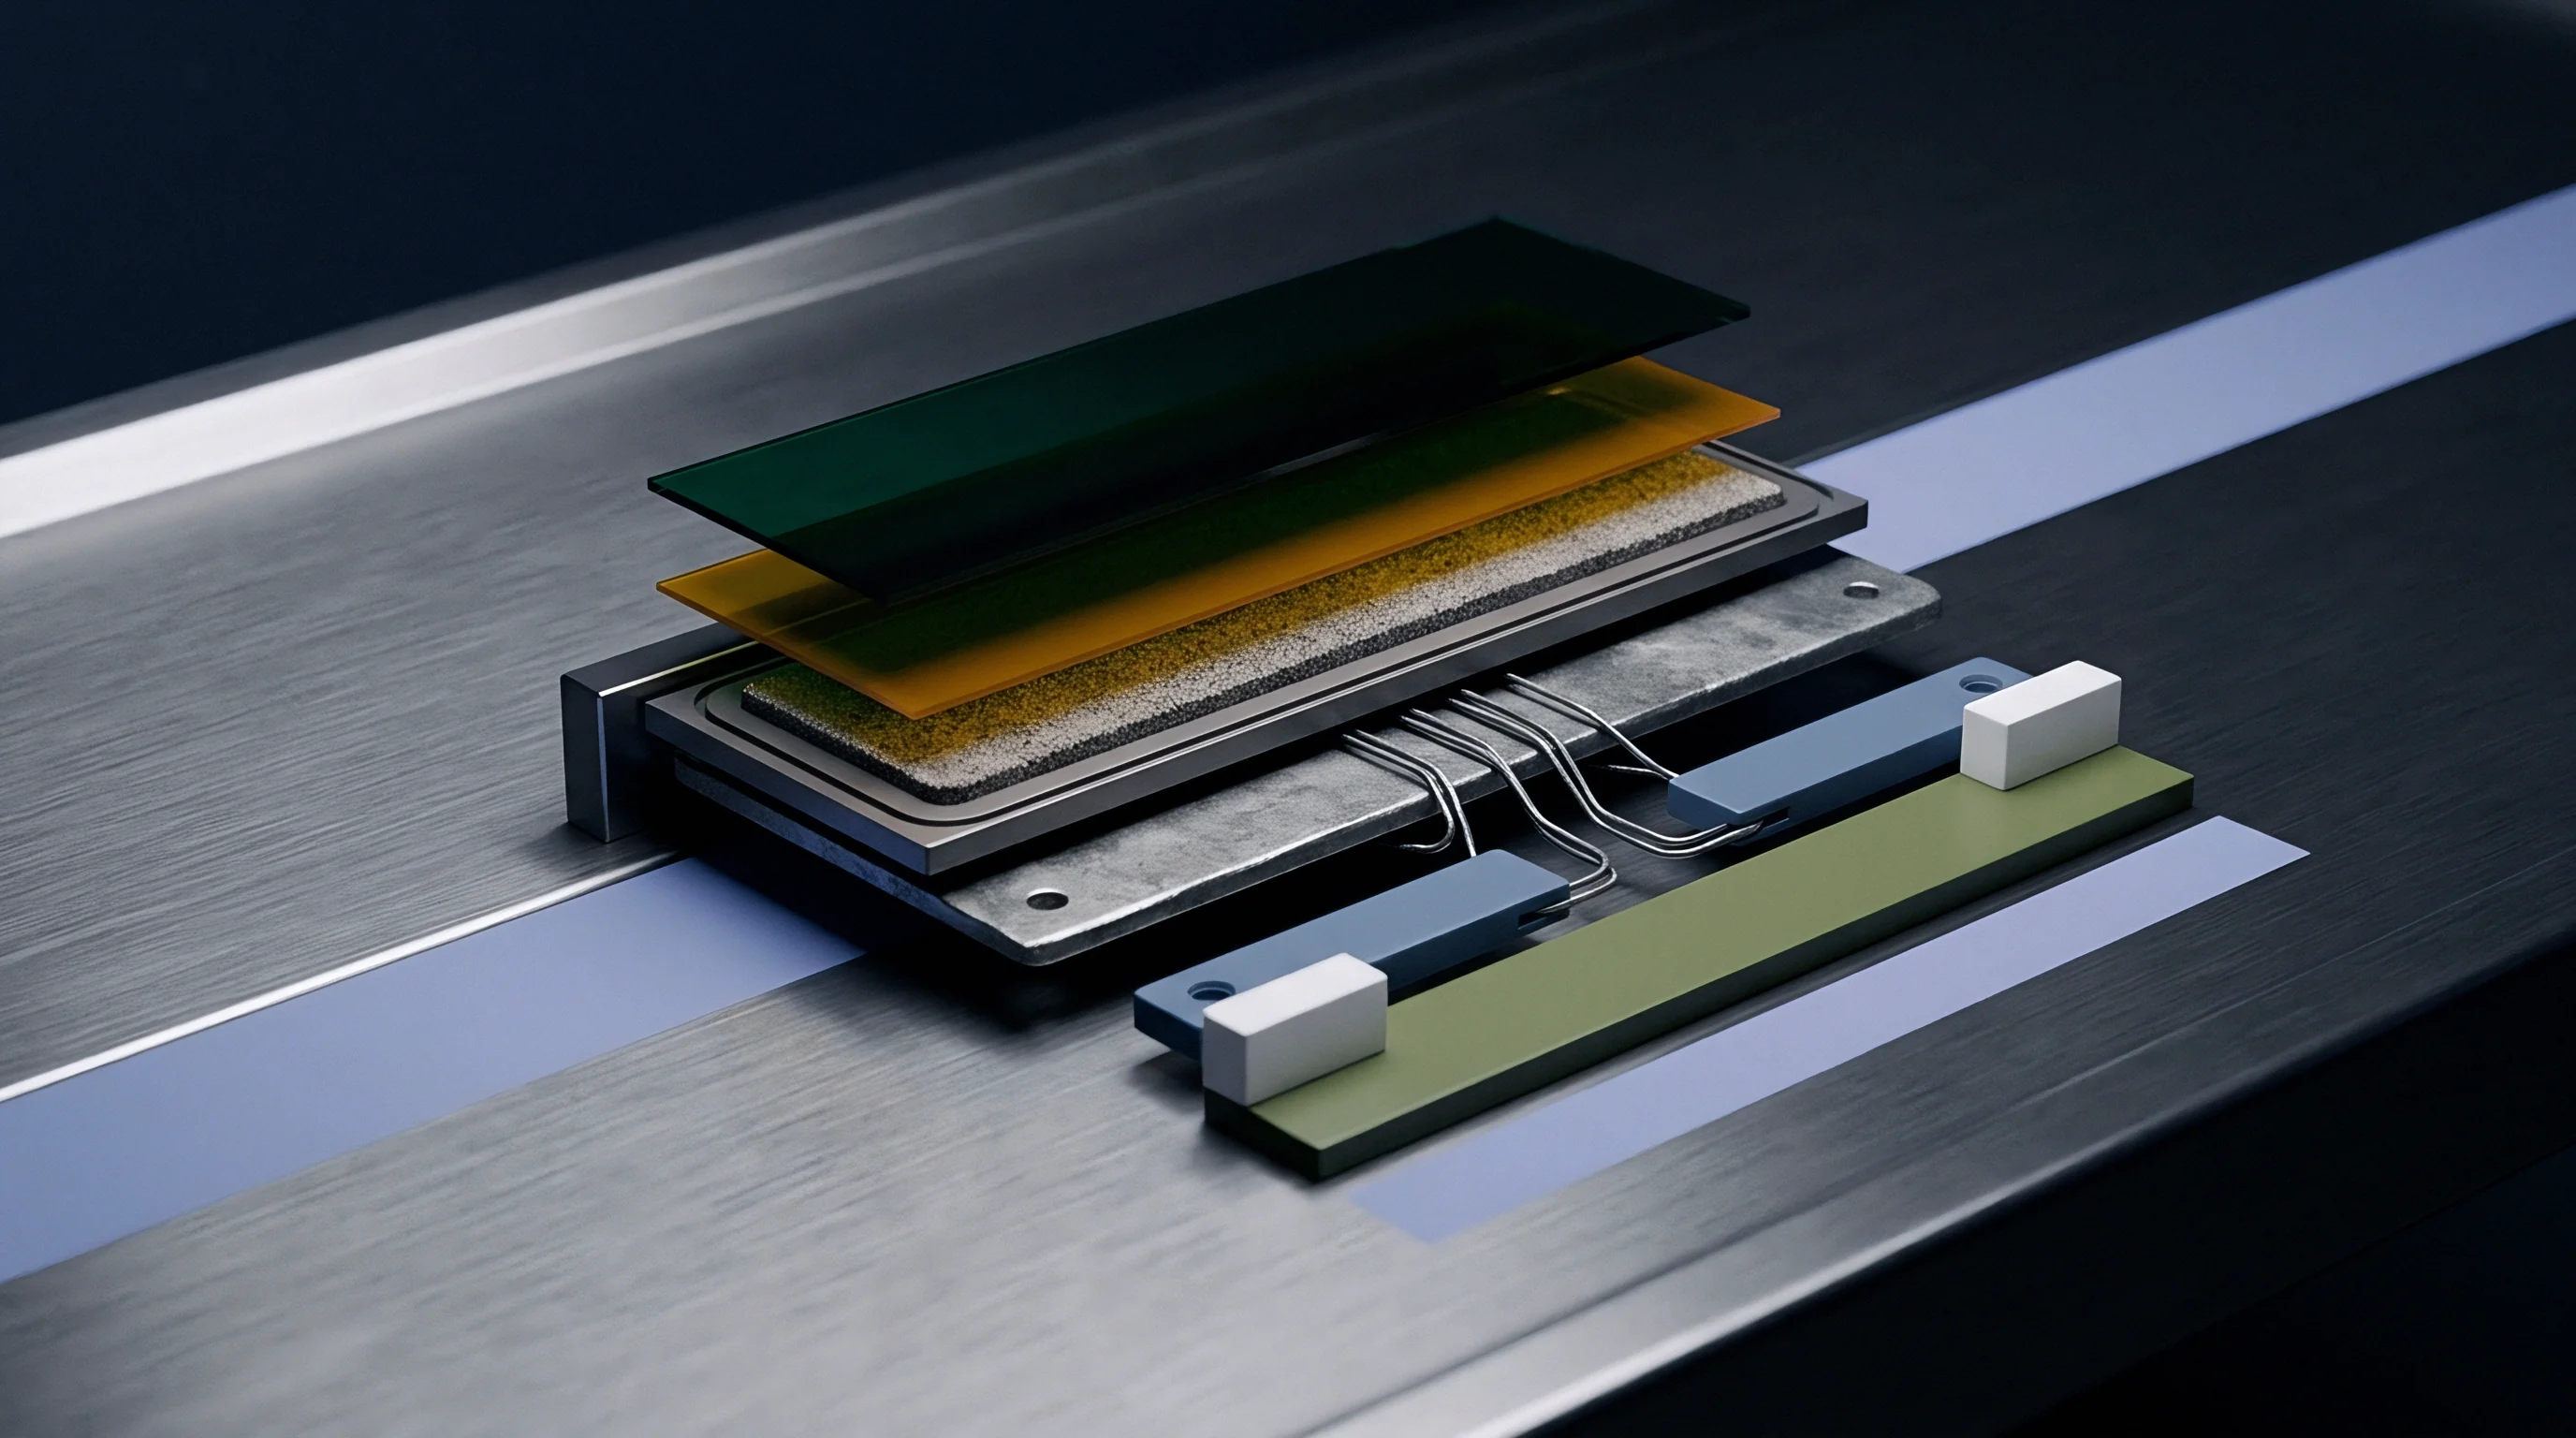
Rigid electrolyte layers restrict volumetric expansion of alloy active materials during lithiation. When an active anode particle transforms from a low-lithium phase to a lithium-dense intermetallic phase, volume expansion reaches 100 to 300 percent depending on baseline stoichiometry. Under external mechanical confinement, this suppressed volume change translates directly into elevated hydrostatic stress fields within the particle interior.
Hydrostatic stress modifies the effective chemical potential of lithium within the host lattice. The electro-chemo-mechanical potential equation governs species transport under stress:
mu_total = mu_0 – z F phi + Omega sigma_hydrostatic
Where mu_0 is baseline chemical potential, z is lithium ion valence, F is Faraday constant, phi is local electric potential, Omega is partial molar volume of lithium, and sigma_hydrostatic is trace of the Cauchy stress tensor divided by three. Compressive stress increases local chemical potential, opposing further lithium ion insertion and reducing driving force for phase migration.

Hydrostatic Pressure Suppression of Phase Propagation
Compressive fields alter the chemical potential drive for lithium insertion. Elevated compressive stress shifts the equilibrium phase transition voltage to lower potential levels relative to metallic lithium reference scale. At extreme stress levels, phase front movement halts entirely, a phenomenon termed stress-induced phase stagnation.
Consider a 40-micrometer thick multi-component silicon-germanium-carbon nanocomposite anode (60 wt% Si, 20 wt% Ge, 20 wt% C) paired with a solid sulfide electrolyte (Li6PS5Cl). Under an applied external stack pressure of 2.0 MPa, internal hydrostatic compressive stress within the anode remains below 45 MPa during initial lithiation. The intermetallic phase front migrates at an average velocity of 1.20 nanometers per second under a constant C/5 charge rate.
Increasing external mechanical stack pressure to 10.0 MPa alters internal mechanical stress state significantly. As phase transformation progresses, rigid separator boundary constraint elevates internal hydrostatic stress to 185 MPa. With partial molar volume Omega equal to 1.6 x 10^-5 m³/mol, the strain energy term adds 2.96 kJ/mol to the local lithium chemical potential, equivalent to an overpotential penalty of 30.7 mV.
This thermodynamic shift suppresses the driving force for the Li13Si4 to Li22Si5 transformation step. Phase front propagation velocity drops from 1.20 nanometers per second to 0.45 nanometers per second, representing a 62.5 percent velocity reduction.
| Applied Stack Pressure (MPa) | Peak Hydrostatic Stress (MPa) | Chemical Potential Shift (kJ/mol) | Phase Front Velocity (nm/s) | Relative Velocity Reduction (%) |
|---|---|---|---|---|
| 1.0 | 22.5 | 0.36 | 1.38 | 0.0 |
| 2.5 | 51.0 | 0.82 | 1.18 | 14.5 |
| 5.0 | 98.0 | 1.57 | 0.89 | 35.5 |
| 10.0 | 185.0 | 2.96 | 0.45 | 62.5 |
| 15.0 | 270.0 | 4.32 | 0.12 | 91.3 |
Viscoplastic creep in metallic phase regions relaxes peak compressive stress fields over extended time scales, altering local voltage. When lithiation rates exceed the plastic stress relaxation rate of the alloy matrix, internal hydrostatic pressure accumulates rapidly, inducing localized mechanical cracking in the solid electrolyte separator.
Neglecting stress-induced phase suppression in mechanical module designs leads to unexpected power fading, localized ceramic separator fracturing, and premature cell structural collapse.


Interface
Boundary dynamics between active multi-component anode particles and solid electrolytes govern overall current distribution. Interfacial charge transfer kinetics operating across phase-transforming alloy surfaces exhibit strong dependencies on localized phase composition, lattice mismatch, and mechanical contact area maintenance.
Charge Transfer Resistance along Intermetallic Plateaus
Impedance evolution tracks phase transformation steps across state-of-charge intervals. Electrochemical Impedance Spectroscopy (EIS) performed across phase transition plateaus reveals distinct variations in interfacial charge transfer resistance R_ct. As multi-component active materials transition through discrete intermetallic phases, the surface electronic work function and ionic adsorption energy alter continuously.
Because argyrodite electrolytes exhibit narrow stability windows, interfacial reaction layers formed between solid electrolytes and multi-component anodes add parasitic ionic transport resistance. Phase transformations that involve large lateral strain rates break this passivating interphase, continuously exposing fresh alloy surfaces to chemical side reactions.
Standard UN 38.3 vibration testing invalidates cell compliance when stack pressure fixtures exhibit mechanical deflection greater than 50 micrometers under cyclic load.
At What Velocity Do Intermetallic Phase Fronts Migrate?
Experimental measurements record migration rates between 0.1 and 5.0 nanometers per second depending on applied current density and external clamping force. High-resolution operando characterization demonstrates that phase fronts move via discrete structural jumps rather than uniform continuous progression. Local lattice misfits between adjacent intermetallic phases create energy barriers that require localized overpotential accumulation before boundary propagation resumes.
Extracting accurate phase migration speeds and interfacial charge transport kinetics under operando conditions follows a strict sequential analytical workflow:
- Mount the pouch cell inside a temperature-controlled compression fixture adjusted to 5.0 MPa baseline force.
- Perform a low-rate galvanostatic titration at C/50 while acquiring impedance spectra at 5 percent state-of-charge increments.
- Extract the charge transfer resistance from the mid-frequency arc of the Nyquist spectrum across phase transformation plateaus.
- Quantify lattice expansion rates using operando X-ray diffraction peak shifts mapped to titration steps.
As lithium leaves multi-component alloy hosts during high-rate delithiation, vacancy accumulation rates exceed the plastic creep rate of the active material, producing nanoscale voids along the solid electrolyte boundary that break ionic contact. These mechanical contact losses concentrate local current density on remaining contact spots, accelerating localized phase transformations and driving thermal hotspot development.
Interfacial impedance spikes during multi-component phase transitions indicate local contact loss long before gross capacity drop surfaces on cycler channels.
Dossier
Systematic qualification data proves cell compliance across operational temperature and pressure ranges. Validating phase transformation models requires comprehensive analytical datasets that correlate electrochemical performance curves with direct structural and mechanical observations gathered during cell cycling.

Experimental Qualification Protocols for Phase Transformation Rates
Standardized test schedules isolate chemical phase transformation speeds from overall cell polarization. Galvanostatic Intermittent Titration Technique (GITT) provides equilibrium open-circuit potential profiles and stoichiometry-dependent chemical diffusion coefficients D_Li. Long relaxation intervals between current pulses permit complete stress relaxation and chemical homogenization within active particles.
When relaxation periods fall short of mechanical equilibrium, measured diffusion values combine interdiffusion transport with stress-driven ion drift, distorting model calibration parameters. Model verification protocols demand step relaxation periods exceeding 12 hours for thick multi-component alloy electrodes.

Operando Characterization for Model Calibration
Advanced analytical techniques capture sub-micron structural shifts inside sealed pouch formats. Synchrotron operando X-ray diffraction tracks phase volume fraction evolution during continuous cycling. Matching observed phase growth kinetics against finite element phase-field predictions validates fundamental model transport parameters.
Engineers evaluating cell supplier qualification data apply rigid verification criteria to incoming analytical dossiers:
- Synchrotron diffraction spectrum resolution must match the two-theta reflection angles of intermetallic intermediate phases within 0.02 degrees.
- Stack pressure sensor calibration requires verified force linearity from 0.5 MPa up to 20.0 MPa across thermal operational windows.
- Galvanostatic titration pulse length needs stabilization periods exceeding 12 hours to isolate equilibrium open-circuit voltages.
- Cross-sectional ion beam imaging must quantify void volume fraction at solid electrolyte contact zones down to 10 nanometers.
| Analytical Technique | Target Physical Parameter | Operational Condition | Data Resolution | Acceptance Limit |
|---|---|---|---|---|
| Operando X-Ray Diffraction | Phase Volume Fraction (V_f) | C/20 to 1C at 25°C | 0.01 Phase Fraction | Model error under 5% |
| In Situ EIS Nyquist Tracking | Charge Transfer Resistance (R_ct) | 10 kHz to 10 mHz | 0.1 Ohm cm² | Variance under 8% |
| Operando FIB-SEM Tomography | Interfacial Contact Area Fraction | 0.5 to 10.0 MPa Pressure | 10 nm Spatial | Void mapping over 95% |
| High-Precision Titration GITT | Chemical Diffusivity (D_Li) | 5% SoC Steps, 12h Rest | 1.0 x 10^-12 cm²/s | Repeatability under 3% |
| Methods note: All qualification measurements conducted under inert argon atmosphere with external cell compression controlled within 0.1 MPa tolerance. | ||||
Section 6.3 of the IEC 62619 industrial cell standard mandates full mechanical containment verification when phase-transforming alloy anodes drive module enclosure swelling beyond specified dimensional limits.

Valuation
Commercial viability depends on balancing module tooling investments against cell power density gains. Integrating multi-component phase-transforming anodes into production battery packs introduces unique structural and electrical system constraints that alter landed cell costs and pack assembly economics.

Tooling Costs and Clamping Fixture Mechanics
Dynamic pressure containment assemblies demand precision engineered spring packs and rigid aluminum endplates. Pouch cells utilizing alloy anodes experience cyclic thickness variations reaching 15 to 25 percent across full charge-discharge cycles. Maintaining continuous mechanical compression within optimal phase transformation windows requires dynamic clamping fixtures capable of absorbing dimensional expansion without exceeding maximum allowable separator yield stress limits.
Fixed-gap module frames cause extreme pressure buildup during cell charging, accelerating stress-induced phase suppression and causing rapid solid electrolyte breakdown. Dynamic spring-loaded endplates prevent pressure spikes by absorbing thickness growth, though they increase pack mechanical Non-Recurring Engineering (NRE) costs.
Module enclosures engineered for active stack pressure maintenance increase initial pack mechanical NRE by up to thirty-five percent.

BMS Rate Capping and Warranty Seam Ownership
Firmware algorithms limit continuous charging rates during specific intermetallic phase transformation plateaus. Integrating phase transformation models directly into Battery Management System (BMS) software enables real-time estimation of internal hydrostatic stress states. When BMS algorithms detect state-of-charge regions corresponding to low diffusion phase transformation steps, rate-capping routines temporarily reduce current demand.
This operational rate capping protects cell longevity but alters vehicle fast-charging profiles. Cell manufacturers specify strict operational pressure limits within commercial datasheets. If pack integrators fail to maintain required stack pressure profiles, cell suppliers disclaim warranty liability for premature capacity loss resulting from interfacial delamination or stress-induced phase stagnation.
Establishing explicit rate-capping parameters based on verified phase transformation speeds protects solid-state packs against premature impedance growth while maintaining clear contractual boundary lines between cell suppliers and battery pack integrators.