Statistical Identification of Digital Filtering and Data Manipulation in Battery Cycler Logs
Digital filtering in cycler logs is identified by autocorrelation in voltage residuals, digit frequency shifts, and artificial collapse of variance floors.

Noise
High-precision battery cyclers recording current and voltage at 10 Hz generate uncompressed time-series streams containing high-frequency switching artifacts, quantisation steps, and thermal drift. These raw signal perturbations originate from switching power supplies, current shunt sensor thermal noise, and ambient chamber temperature fluctuations. Authentic laboratory test logs present a characteristic noise floor proportional to the instrument’s full-scale hardware range.
A cycler operating on a 10 A channel with 16-bit analog-to-digital converters produces distinct, deterministic quantisation steps around 305 microamps. Thermal oscillation in test chambers operating within plus or minus 0.5 degrees Celsius creates periodic, low-frequency voltage shifts across constant-current holds.
Quantisation Limits and Physical Signal Fluctuation
Analog-to-digital converters in cell testing hardware capture physical state changes alongside external electromagnetic interference. The physical noise floor of a commercial testing channel consists of three distinct components: thermal Johnson-Nyquist noise within the sensing shunts, analog-to-digital conversion quantisation error, and high-frequency switching noise from pulse-width modulated power stages. When a 21700 lithium-ion cell undergoes charge at a 1C rate, voltage measurements exhibit micro-scale fluctuations driven by lithium concentration gradients at the particle surfaces and localized temperature variations.
High-rate sampling preserves these physical phenomena.
Any sudden loss of physical signal resolution usually points to upstream filtering or buffer truncation in the acquisition hardware.
Removing these physical fluctuations through automated software processing alters the underlying statistical distribution of the dataset. Raw telemetry files generated by Arbin, Maccor, BioLogic, or Neware systems retain peak-to-peak noise amplitude across steady-state constant-current charge and discharge phases. Exporting raw binary logs to secondary formats often applies software filters that strip these high-frequency components to shrink output file sizes, even though underlying quantisation errors persist in the source.

Digital Filtering Mechanisms in Commercial Testing Software
Software packages bundled with cycler hardware routinely apply mathematical transformations to raw telemetry prior to storage. Common algorithmic filters include simple moving averages, finite impulse response low-pass filters, infinite impulse response filters, and Savitzky-Golay polynomial smoothing routines. These algorithms recalculate individual data points as weighted functions of neighboring points within a temporal window.
Downsampling routines discard intermediate voltage readings when the delta between consecutive records remains below a predefined software threshold, such as 5 millivolts or 10 seconds.
Sampling intervals exceeding five seconds during high-rate pulses obscure internal resistance voltage drops and invalidate transient thermal models.
Data reduction routines implemented at the cycler software level strip stochastic noise while introducing artificial correlation between sequential data points. A five-point moving average filter reduces voltage variance by a factor of five, smoothing real voltage steps caused by micro-structural changes within the cell electrode stack. Onboard low-pass digital filters are often enabled primarily to prevent storage drives from overflowing during long-term calendar aging programs.
Residuals
Calculated deviations between observed measurements and expected chemical models form the primary diagnostic baseline for data integrity audits. Subtracting a smoothed polynomial baseline or electrochemical model curve from raw voltage time series isolates the residual noise signal. Unadulterated experimental logs produce residual series that satisfy white noise criteria, characterized by zero mean, constant variance, and zero autocorrelation across non-zero time lags.
Digital filtering fundamentally alters these residual properties, leaving distinct statistical signatures in exported log files.
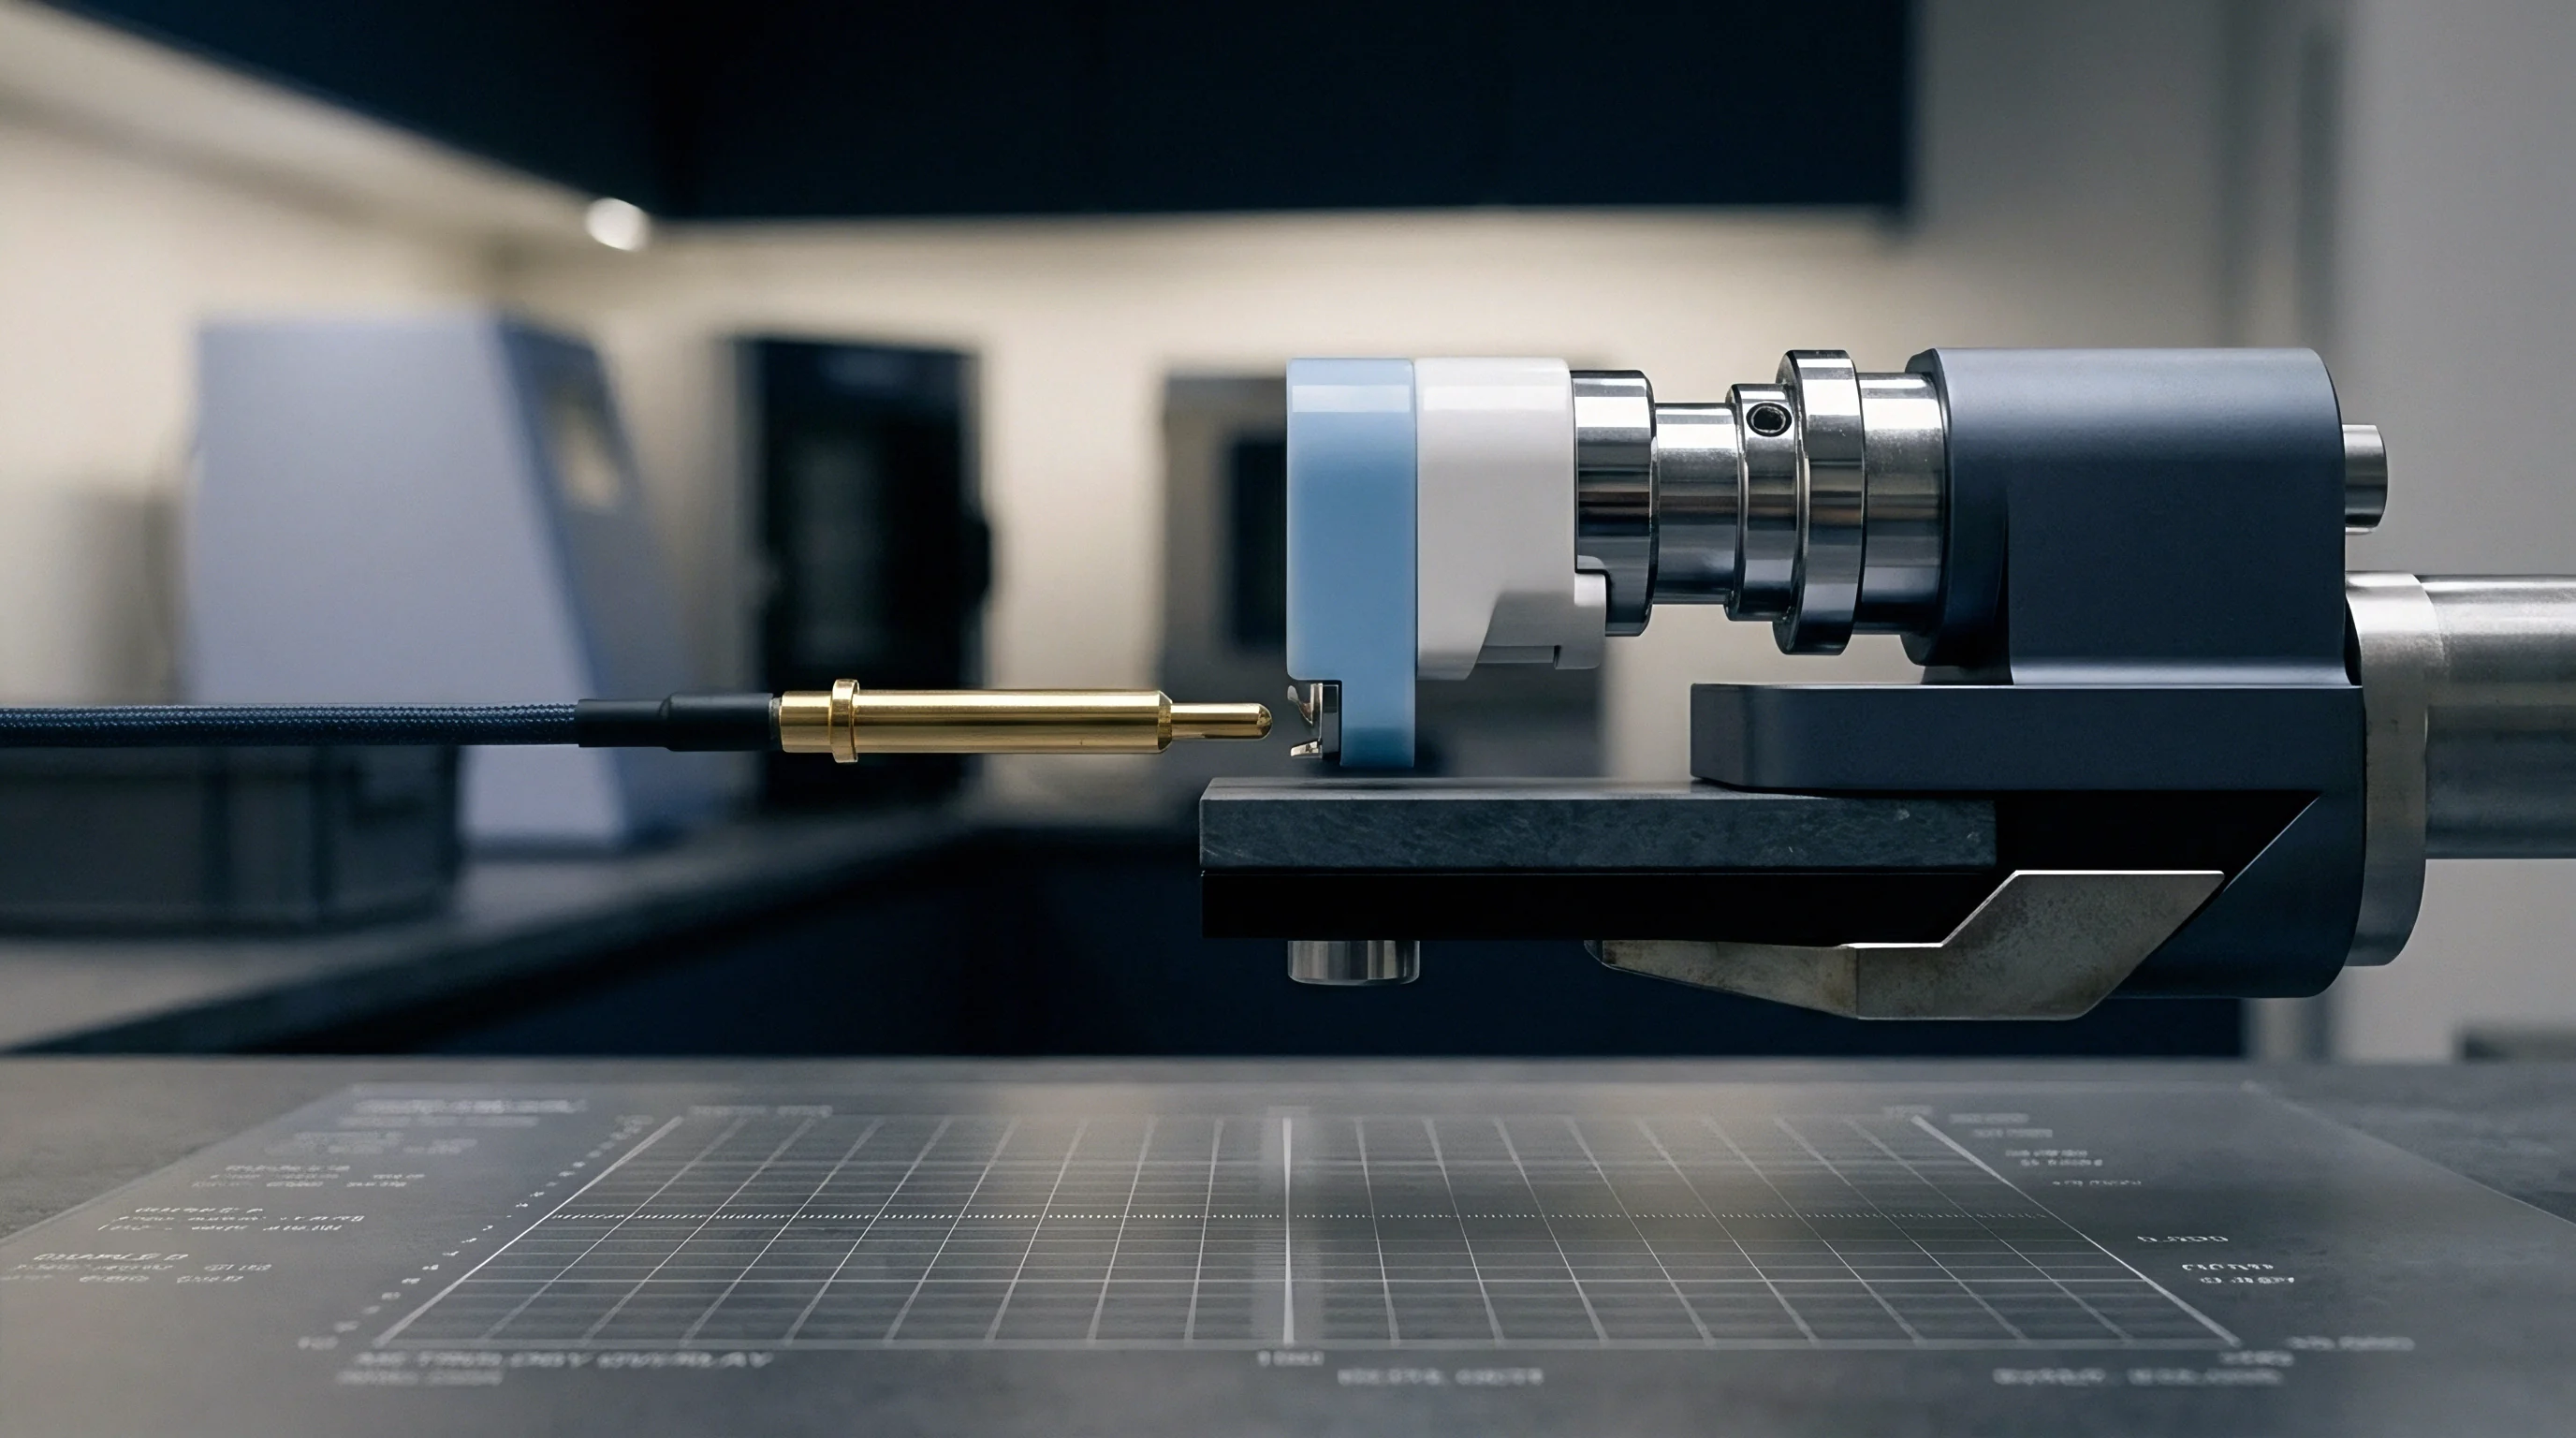
Autocorrelation Properties of Raw versus Filtered Time Series
Time-series measurements from unadulterated battery channels exhibit independent random noise distributions across consecutive sample intervals. Applying the Ljung-Box test or calculating the Durbin-Watson statistic on voltage residuals isolates digital alteration. For an uncompressed, unfiltered telemetry stream, the Durbin-Watson statistic yields a value near 2.0, confirming the absence of serial correlation between adjacent time steps.
Digital smoothing algorithms shift the Durbin-Watson statistic toward zero, indicating positive autocorrelation introduced by spatial or temporal averaging filters.
Applying spatial or temporal smoothing routines collapses the residual noise floor, replacing expected random scatter with structured trends.
Quantifying autocorrelation across time lags from 1 to 20 samples exposes the specific filter architecture applied. Moving average filters generate a linear decay in autocorrelation up to the window size, followed by zero correlation beyond the window boundary. Exponential smoothing routines produce an exponentially decaying autocorrelation function.
These statistical artifacts remain permanently embedded in the dataset even if the cycler log is subsequently re-sampled or downsampled.
| Telemetry Condition | Durbin-Watson Score | Autocorrelation Lag 1 | Variance Floor (V²) | Trailing Digit P-Value |
|---|---|---|---|---|
| Raw 24-Bit Binary Stream | 1.98 to 2.02 | < 0.03 | 1.2 e-5 | > 0.05 |
| 5-Point Moving Average | 0.42 to 0.65 | 0.78 to 0.85 | 2.4 e-6 | 0.01 to 0.04 |
| Savitzky-Golay (deg 3, win 11) | 0.21 to 0.38 | 0.89 to 0.94 | 8.1 e-7 | < 0.001 |
| Downsampled Delta-V Delta-t | 1.12 to 1.45 | 0.35 to 0.52 | Step Discontinuous | < 0.001 |

Variance Floor Collapse in Constant Current Holds
Rolling calculation window algorithms applied across static load steps expose artificial signal smoothing. During a 1-hour constant-current rest or charge hold, physical voltage changes slowly along a smooth chemical potential curve. Calculating variance across a moving 20-point window on raw cycler data identifies a constant hardware-dependent noise floor.
Digital filtering causes this variance floor to drop abruptly by several orders of magnitude, revealing non-physical stability in recorded potential.
Manual adjustments to time-series values break the underlying statistical distribution of the dataset, making the alteration evident under formal verification.
Auditing procedures identify manipulation by tracking the ratio of measured local variance to expected instrument hardware specifications. When the local variance drops below the physical limits of the channel’s analog-to-digital conversion stage, post-processing software has altered the file. Statistical validation techniques isolate these variance anomalies across thousands of consecutive cycling data frames.
- Autocorrelation Lag Profiling computes serial correlation coefficients across sequential time lags to identify moving average window lengths.
- Variance Floor Quantile Tracking calculates moving variance across constant-current steps to flag artificial noise suppression below hardware limits.
- Ljung-Box Portmanteau Testing evaluates cumulative residual randomness to confirm or reject claims of uncompressed binary logging.
- Spectral Power Density Estimation converts time-series voltage logs into frequency domain maps to expose brick-wall digital low-pass cutoffs.
Standard testing agreements incorporating ISO/IEC 17025 telemetry mandates stipulate that any post-acquisition signal processing applied prior to file export invalidates the accredited validation status of the dataset.
Distortion
Data manipulation tactics in commercial battery testing often focus on smoothing voltage curves to pass qualification gates. Raw cycling logs contain micro-steps, sensor dropouts, and thermal spikes that reveal internal electrode degradation, electrolyte oxidation, or mechanical tap-density non-uniformities. Third-party testing houses or cell vendors under tight performance contracts apply digital transformations to eliminate these diagnostic signatures before submitting datasets to prospective buyers.

Why Do Laboratories Apply Savitzky Golay Smoothing to Raw Logs?
Differential capacity analysis requires computing numerical derivatives of measured charge with respect to potential. Taking the derivative of raw, noisy voltage data amplifies high-frequency noise, turning smooth capacity peaks into uninterpretable scatter plots. Applying Savitzky-Golay polynomial smoothing fits local sub-sets of adjacent data points with low-degree polynomials, producing clean, continuous curves suitable for automated peak-fitting software by removing derivative noise.
Aggressive polynomial filtering removes the high-frequency voltage noise that would otherwise signal ongoing structural or chemical degradation.
Smoothing differential capacity curves obliterates subtle physical indicators of failure. Incipient lithium plating presents as a minor inflection point on the discharge dQ/dV profile during early stage cycling. Savitzky-Golay filtering with broad window parameters flattens these minor inflection points, converting a failing cell signature into a compliant degradation profile.
Phase change peak broadening in nickel-rich cathode chemistries is similarly obscured, masking structural fatigue within the active materials.
Submitting smoothed telemetry without disclosing polynomial filter coefficients violates IEC 62660-1 validation provisions, resulting in mandatory re-testing at supplier expense.
Spline Interpolation and Capacity Stitching Tactics
Laboratories facing unexpected channel power outages or cycler hardware resets during multi-month cycle life tests sometimes resort to synthetic data insertion. When a cycler drops offline for several hours, the cell relaxes toward open-circuit voltage, creating a massive discontinuity in time, temperature, and state-of-charge tracking. Test operators occasionally bridge these gaps by removing the dropped frames and applying cubic spline interpolation across the missing cycle steps.
1. Export raw cycler telemetry files in native binary formats directly from primary database servers.
2. Calculate time step deltas between consecutive rows to detect missing temporal records or offset resets.
3. Compute first and second numerical derivatives of voltage with respect to cumulative test time.
4. Flag instantaneous derivative shifts that lack corresponding changes in applied current or ambient temperature.
5. Cross-reference ambient temperature sensor channel logs against cell surface thermocouple readings for identical time steps.
Detecting spline interpolation relies on examining second-derivative continuity across suspected stitch boundaries. True physical interruptions exhibit thermal relaxation transients governed by dual-time-constant RC circuit equivalents. Synthetic spline bridges produce unnaturally smooth voltage derivatives that lack the characteristic dual-exponential relaxation profiles mandated by electrochemical double-layer physics.
Relying on suppressed differential capacity signatures causes false-positive pass marks on accelerated degradation protocols, pushing premature cell swelling and thermal runaway risks directly into field-deployed battery packs.

Entropy
Information density across consecutive telemetry frames serves as an unalterable signature of authentic physical testing. True analog data digitized by physical hardware carries high entropy in the least significant digits of floating-point values due to ambient thermal agitation, sensor drift, and electromagnetic background noise. Synthetically generated, interpolated, or heavily filtered data arrays exhibit significantly reduced information entropy.
Tracking entropy drop-offs across long-term testing logs provides a mathematical method for detecting batch-level data fabrication.
Least Significant Digit Frequency and Benford Law Diagnostics
Hardware analog-to-digital conversion generates floating-point trailing figures governed by physical thermal agitation. In a true 24-bit measurement system converting voltage inputs, the 4th, 5th, and 6th decimal places reflect ambient physical noise. The statistical distribution of these least significant digits must satisfy uniform random distribution criteria across long constant-current test phases.
When values are artificially generated or processed via fixed digital formulas, trailing digit distributions deviate measurably from uniformity.
Analyzing the frequency of least significant digits exposes systematic distribution shifts caused by post-processing or synthetic data generation.
Benford’s Law and uniform distribution tests apply directly to trailing mantissa digits in cycler log floating-point arrays. Evaluating trailing digits using Chi-square goodness-of-fit testing compares observed digit frequencies against expected uniform distributions. If a laboratory copies cycle data from a reference cell and adds synthetic linear decay, the trailing digits exhibit severe frequency bias, yielding Chi-square p-values well below 0.001.
Authentic noise returns a p-value above 0.05.
| Manipulation Technique | Primary Target Parameter | Statistical Indicator | Detection Sensitivity |
|---|---|---|---|
| Moving Average Filtering | High-frequency voltage noise | Durbin-Watson < 1.0 | High (over 5 samples) |
| Savitzky-Golay Smoothing | dQ/dV derivative peaks | High-lag autocorrelation > 0.7 | Very High |
| Spline Interpolation | Missing cycle gaps | Second derivative slope jump | Moderate (requires <1s logs) |
| Synthetic Log Generation | Capacity fade slope | Trailing digit Chi-square p < 0.001 | Absolute |
Allan Variance and High Frequency Noise Floor Drift
Stability analysis across varying averaging times identifies boundary transitions between white phase noise and systemic sensor drift. Allan deviation, originally developed for precision clock frequency stability, acts as a filter identifier when plotted against averaging times. Unfiltered hardware data shows a characteristic slope of negative 0.5 on a log-log Allan deviation plot at short integration times, corresponding to white phase and white frequency measurement noise.
Unfiltered raw data preserves the underlying physics of the cell, reflecting genuine electrochemical behavior alongside true sensor noise.
Applying digital filtering alters the slope of the Allan deviation curve at short integration intervals. Moving average filters steepen the short-term slope, while digital low-pass cutoffs introduce flat or non-monotonic regions in the Allan variance signature. Comparing measured Allan deviation curves against baseline hardware noise characterizations reveals the exact integration time scales modified by software intervention.
- Benford Mantissa Analysis tests trailing floating-point digits against uniform distribution models to expose synthetic array generation.
- Allan Deviation Profiling measures noise stability across logarithmic integration times to locate digital filter cutoffs.
- Shannon Entropy Calculation computes information density per telemetry frame to detect loss of stochastic hardware noise.
- Spectral Kurtosis Mapping evaluates non-Gaussian transient spikes to differentiate physical micro-shorts from digital filtering artifacts.
Whether automated neural network architectures can reliably separate physical micro-structural noise within silicon-anode cells from sophisticated anti-aliasing digital filters remains an open technical challenge for third-party laboratories.

Scrutiny
Establishing telemetry integrity requires institutional controls across the entire procurement chain. Buying cells on vendor-supplied summary reports or cleaned Excel files exposes energy storage integrators to severe field-reliability liabilities. Engineering practices must mandate the delivery of uncompressed, raw binary cycler outputs directly from accredited test channels, accompanied by verifiable audit trails and hardware calibration certificates.
Audit Procedures for Vendor Qualification Dossiers
Cell qualification files delivered by external suppliers require systematic statistical validation before entering engineering databases. Initial intake validation runs automated statistical scripts against incoming raw logs to evaluate Durbin-Watson residuals, variance floor stability, and trailing-digit entropy. Telemetry streams failing statistical thresholds trigger immediate holds on qualification sign-offs and initiate secondary audits of source binary files.
Generating cryptographic hash values at acquisition secures the telemetry stream against undisclosed edits or post-processing.
Sourcing agreements require cycler servers to generate real-time cryptographic SHA-256 hash digests upon completion of each individual test step. These hashes are automatically timestamped and appended to an append-only ledger on the laboratory local area network. Modifying historical data rows alters the downstream hash chain, instantly alerting compliance auditors to post-acquisition data post-processing.
Raw cycler logs carrying authentic ADC noise exhibit a uniform trailing digit distribution across the fourth decimal place with a Chi-square p-value exceeding 0.05.

Contractual Safeguards against Data Post Processing
Procurement legal frameworks bind cell vendors to raw logging compliance by defining explicit telemetry delivery standards. Supply agreements include technical annexes mandating native channel binary exports (.res, mpt, or native cycler SQL databases) without post-acquisition software filtering. Contracts define explicit penalties for undisclosed data manipulation, including forfeiture of qualification batch payments and mandatory re-testing at third-party accredited facilities.
| Clause Category | Mandated Telemetry Asset | Verification Standard | Non-Compliance Remedy |
|---|---|---|---|
| Format Verification | Unfiltered native binary files | Durbin-Watson score > 1.8 | Batch qualification rejection |
| Chain of Custody | SHA-256 automated hash logs | Cryptographic hash match | Third-party audit escalation |
| Filter Disclosure | Filter parameter metadata sheet | ISO/IEC 17025 disclosure | Vendor-funded re-testing |
| Derivative Integrity | Raw dQ/dV step outputs | Chi-square trailing digit p > 0.05 | Warranty coverage extension |
Accepting unverified summary metrics without raw channel telemetry increases exposure to premature cell failure and unexpected field risks.
Establishing rigorous automated intake verification protects grid-scale battery integrators and automotive original equipment manufacturers from hidden cell degradation liabilities. Telemetry files that lack observable voltage quantization noise during low-current rest periods represent altered records until raw channel binary files verify otherwise.