Structural Evaluation Parameters for Lithium Ion Module Vibration Certification
Structural evaluation parameters for module vibration certification require matching natural frequencies, joint shear fatigue limits, and G-RMS profiles.
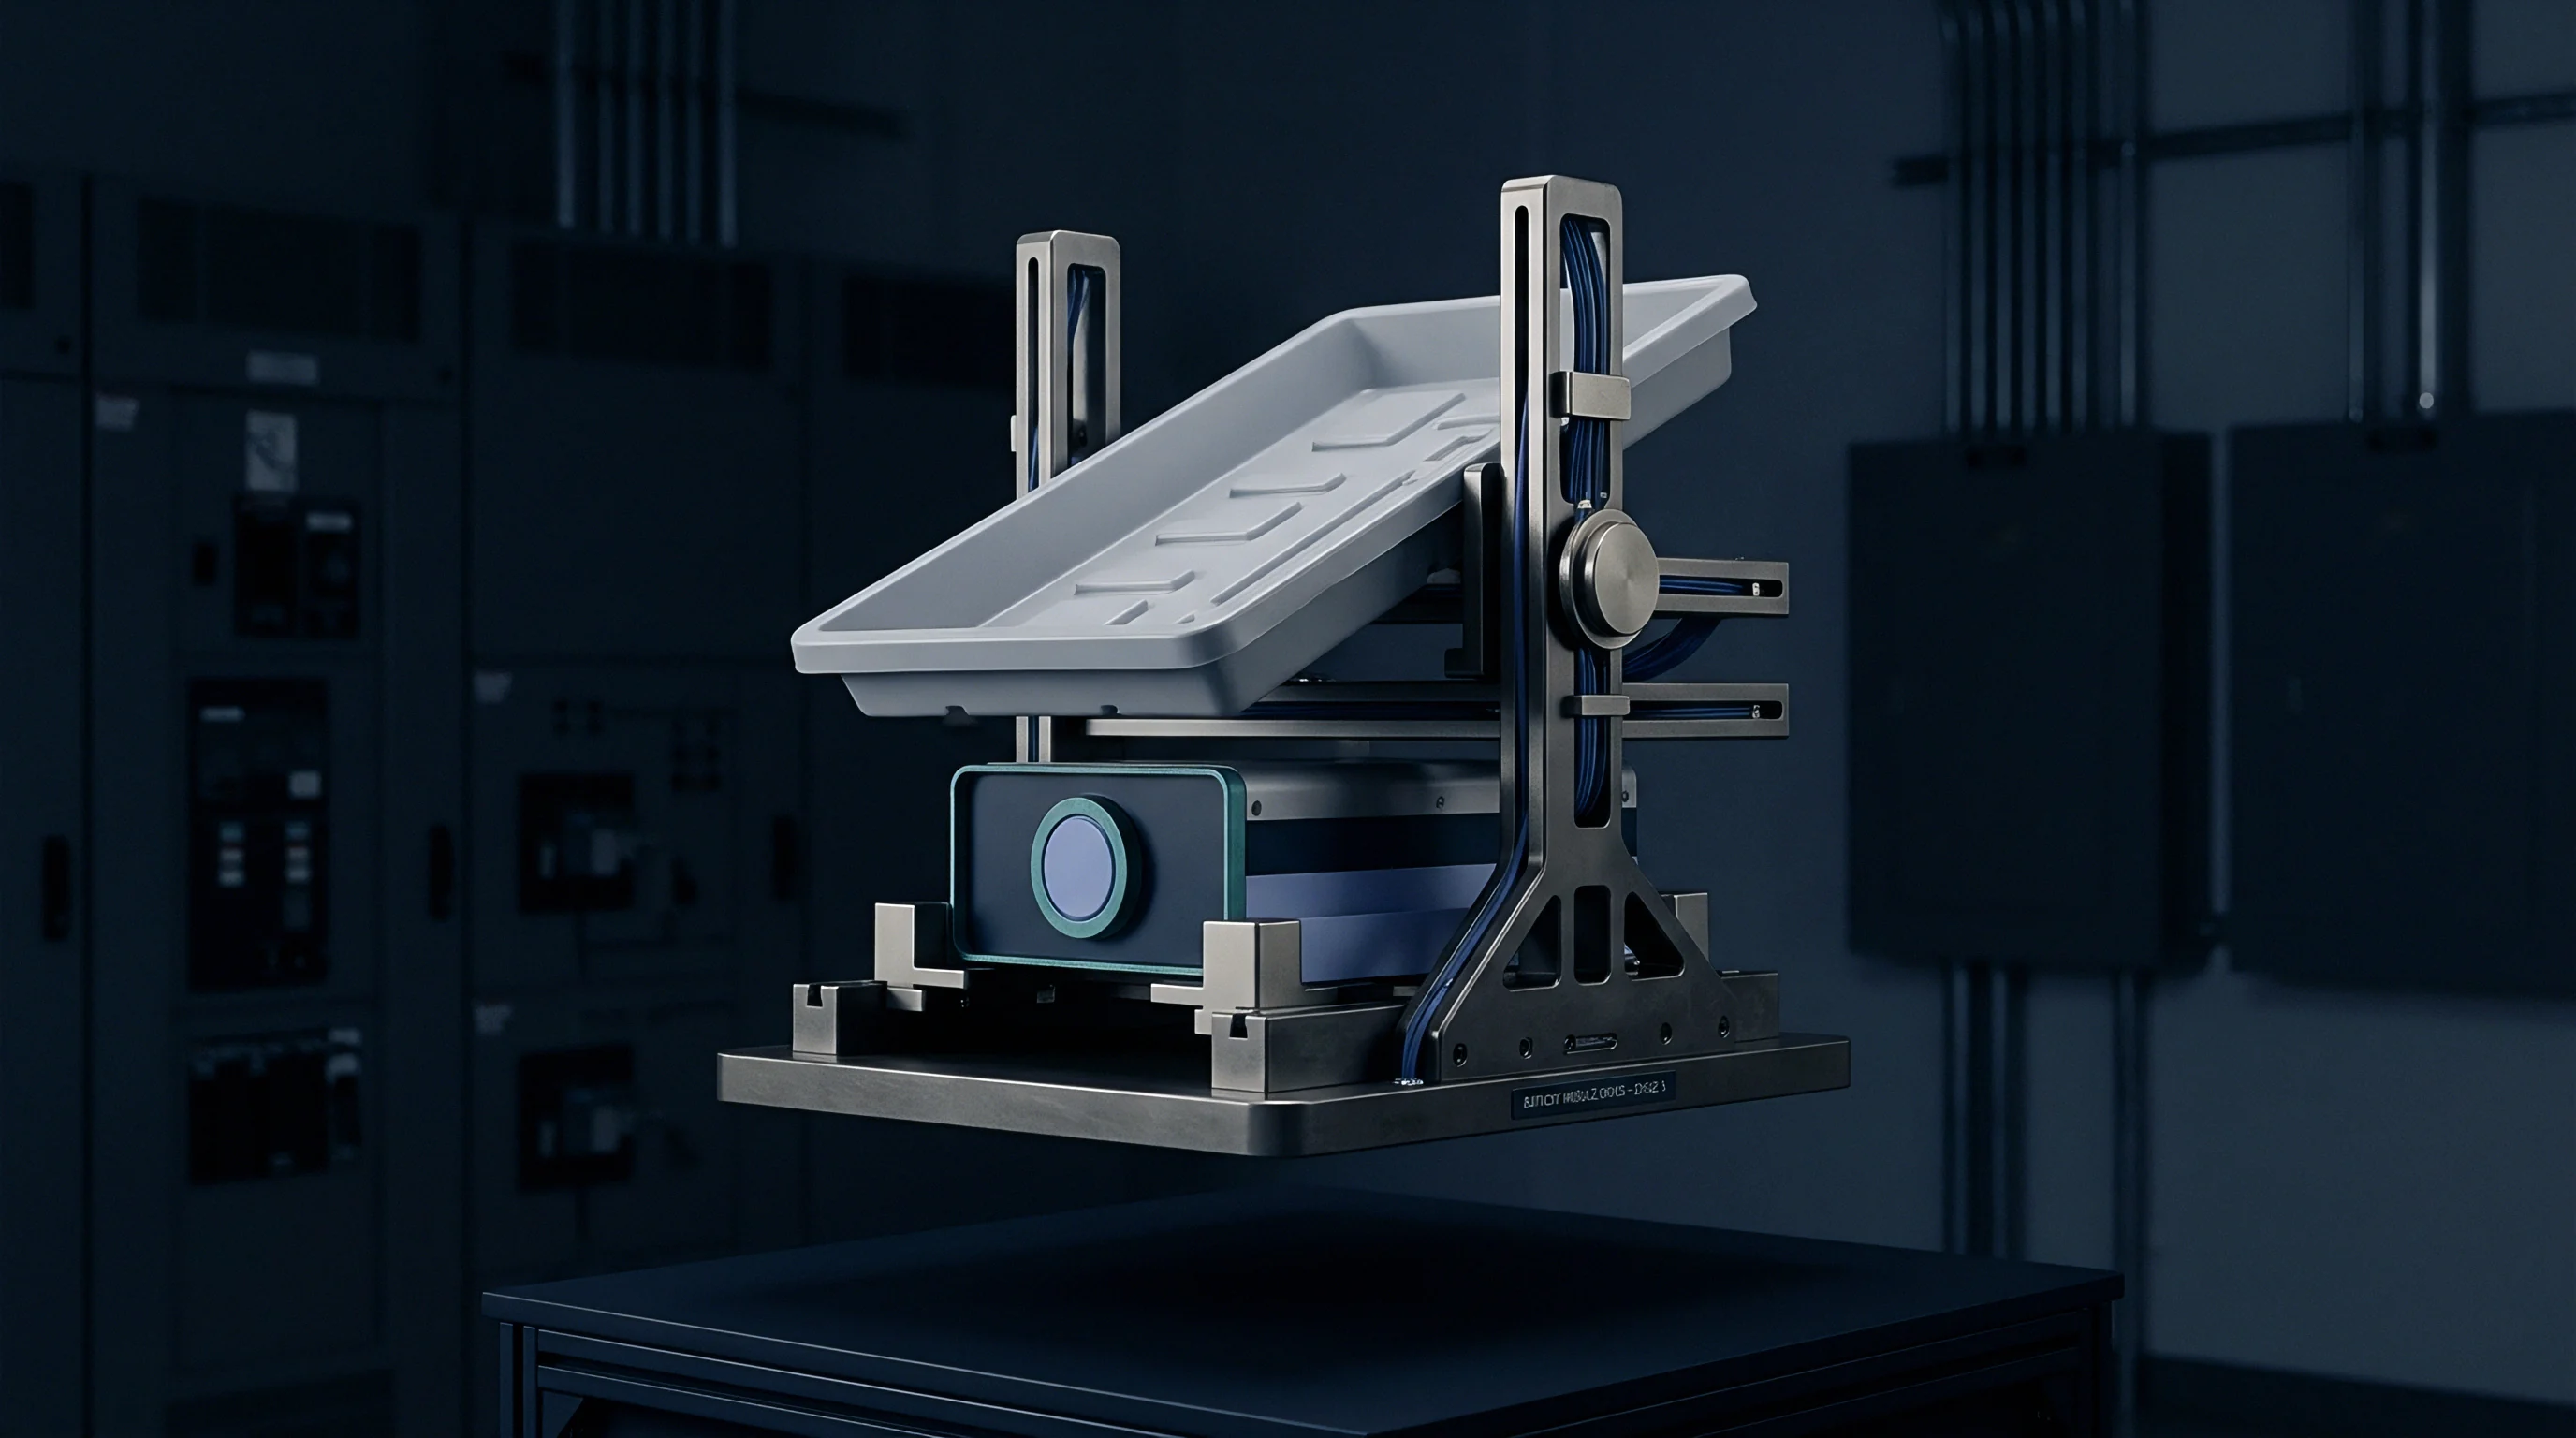

Resonance
Modal responses govern how battery pack structures amplify mechanical inputs during transport. Certification testing for lithium-ion modules starts by identifying natural frequencies across all three orthogonal axes. If transit frequencies align with a module’s natural frequency, dynamic amplification increases mechanical force by an amplification factor, Q. High Q values concentrate cyclic stress inside cell retention frames, cooling plates, and terminal joints.
Modal Identification and Fundamental Frequencies
Sinusoidal sweeps reveal natural structural modes across low-frequency transport bandwidths. Accelerometers on cell frames and top covers map resonant peaks during a standard one-octave-per-minute sweep from 7 Hz to 200 Hz. Transmissibility reaches its peak at these fundamental frequencies, with the transmissibility ratio ~ response acceleration divided by input acceleration ~ measuring structural damping performance.
Transmissibility values over 5.0 point to insufficient damping in module side plates or cell clamping frames. Peaks below 30 Hz are especially troublesome for vehicle modules, given that road inputs concentrate energy between 5 Hz and 25 Hz. Adequate damping suppresses peak dynamic amplification, while structural stiffening pushes fundamental modes above road disturbance frequencies to protect internal components from harmonic motion.
Modules exhibiting dynamic transmissibility peaks above 4.5 at frequencies below 30 Hz exceed standard chassis isolation margins.
Cell format directly shapes resonance behavior. Modules with potted 21700 cylindrical cells use structural foam or plastic retention grids, spreading resonance modes across 120 Hz to 350 Hz. Large prismatic modules show plate-like bending modes in end plates between 40 Hz and 90 Hz. Meanwhile, stacked pouch cell designs with cooling fins exhibit localized swelling resonance below 50 Hz if compression foam loses its initial preload.
| Module Architecture | Natural Frequency Range (Hz) | Transmissibility Peak Ratio (Q) | Primary Structural Weak Point | Damping Coefficient Range |
|---|---|---|---|---|
| Potted Cylindrical 21700 | 140 to 320 | 2.1 to 3.8 | Top-wire bond interfaces | 0.08 to 0.15 |
| Frame-Clamped Prismatic | 45 to 95 | 4.2 to 6.5 | End plate tie-rod threads | 0.03 to 0.07 |
| Stacked Pouch with Cooling Plates | 28 to 75 | 3.5 to 5.8 | Foam compression interfaces | 0.04 to 0.09 |
Designing module tie-downs to keep fundamental modes well above vehicle excitation bands avoids destructive dynamic amplification.
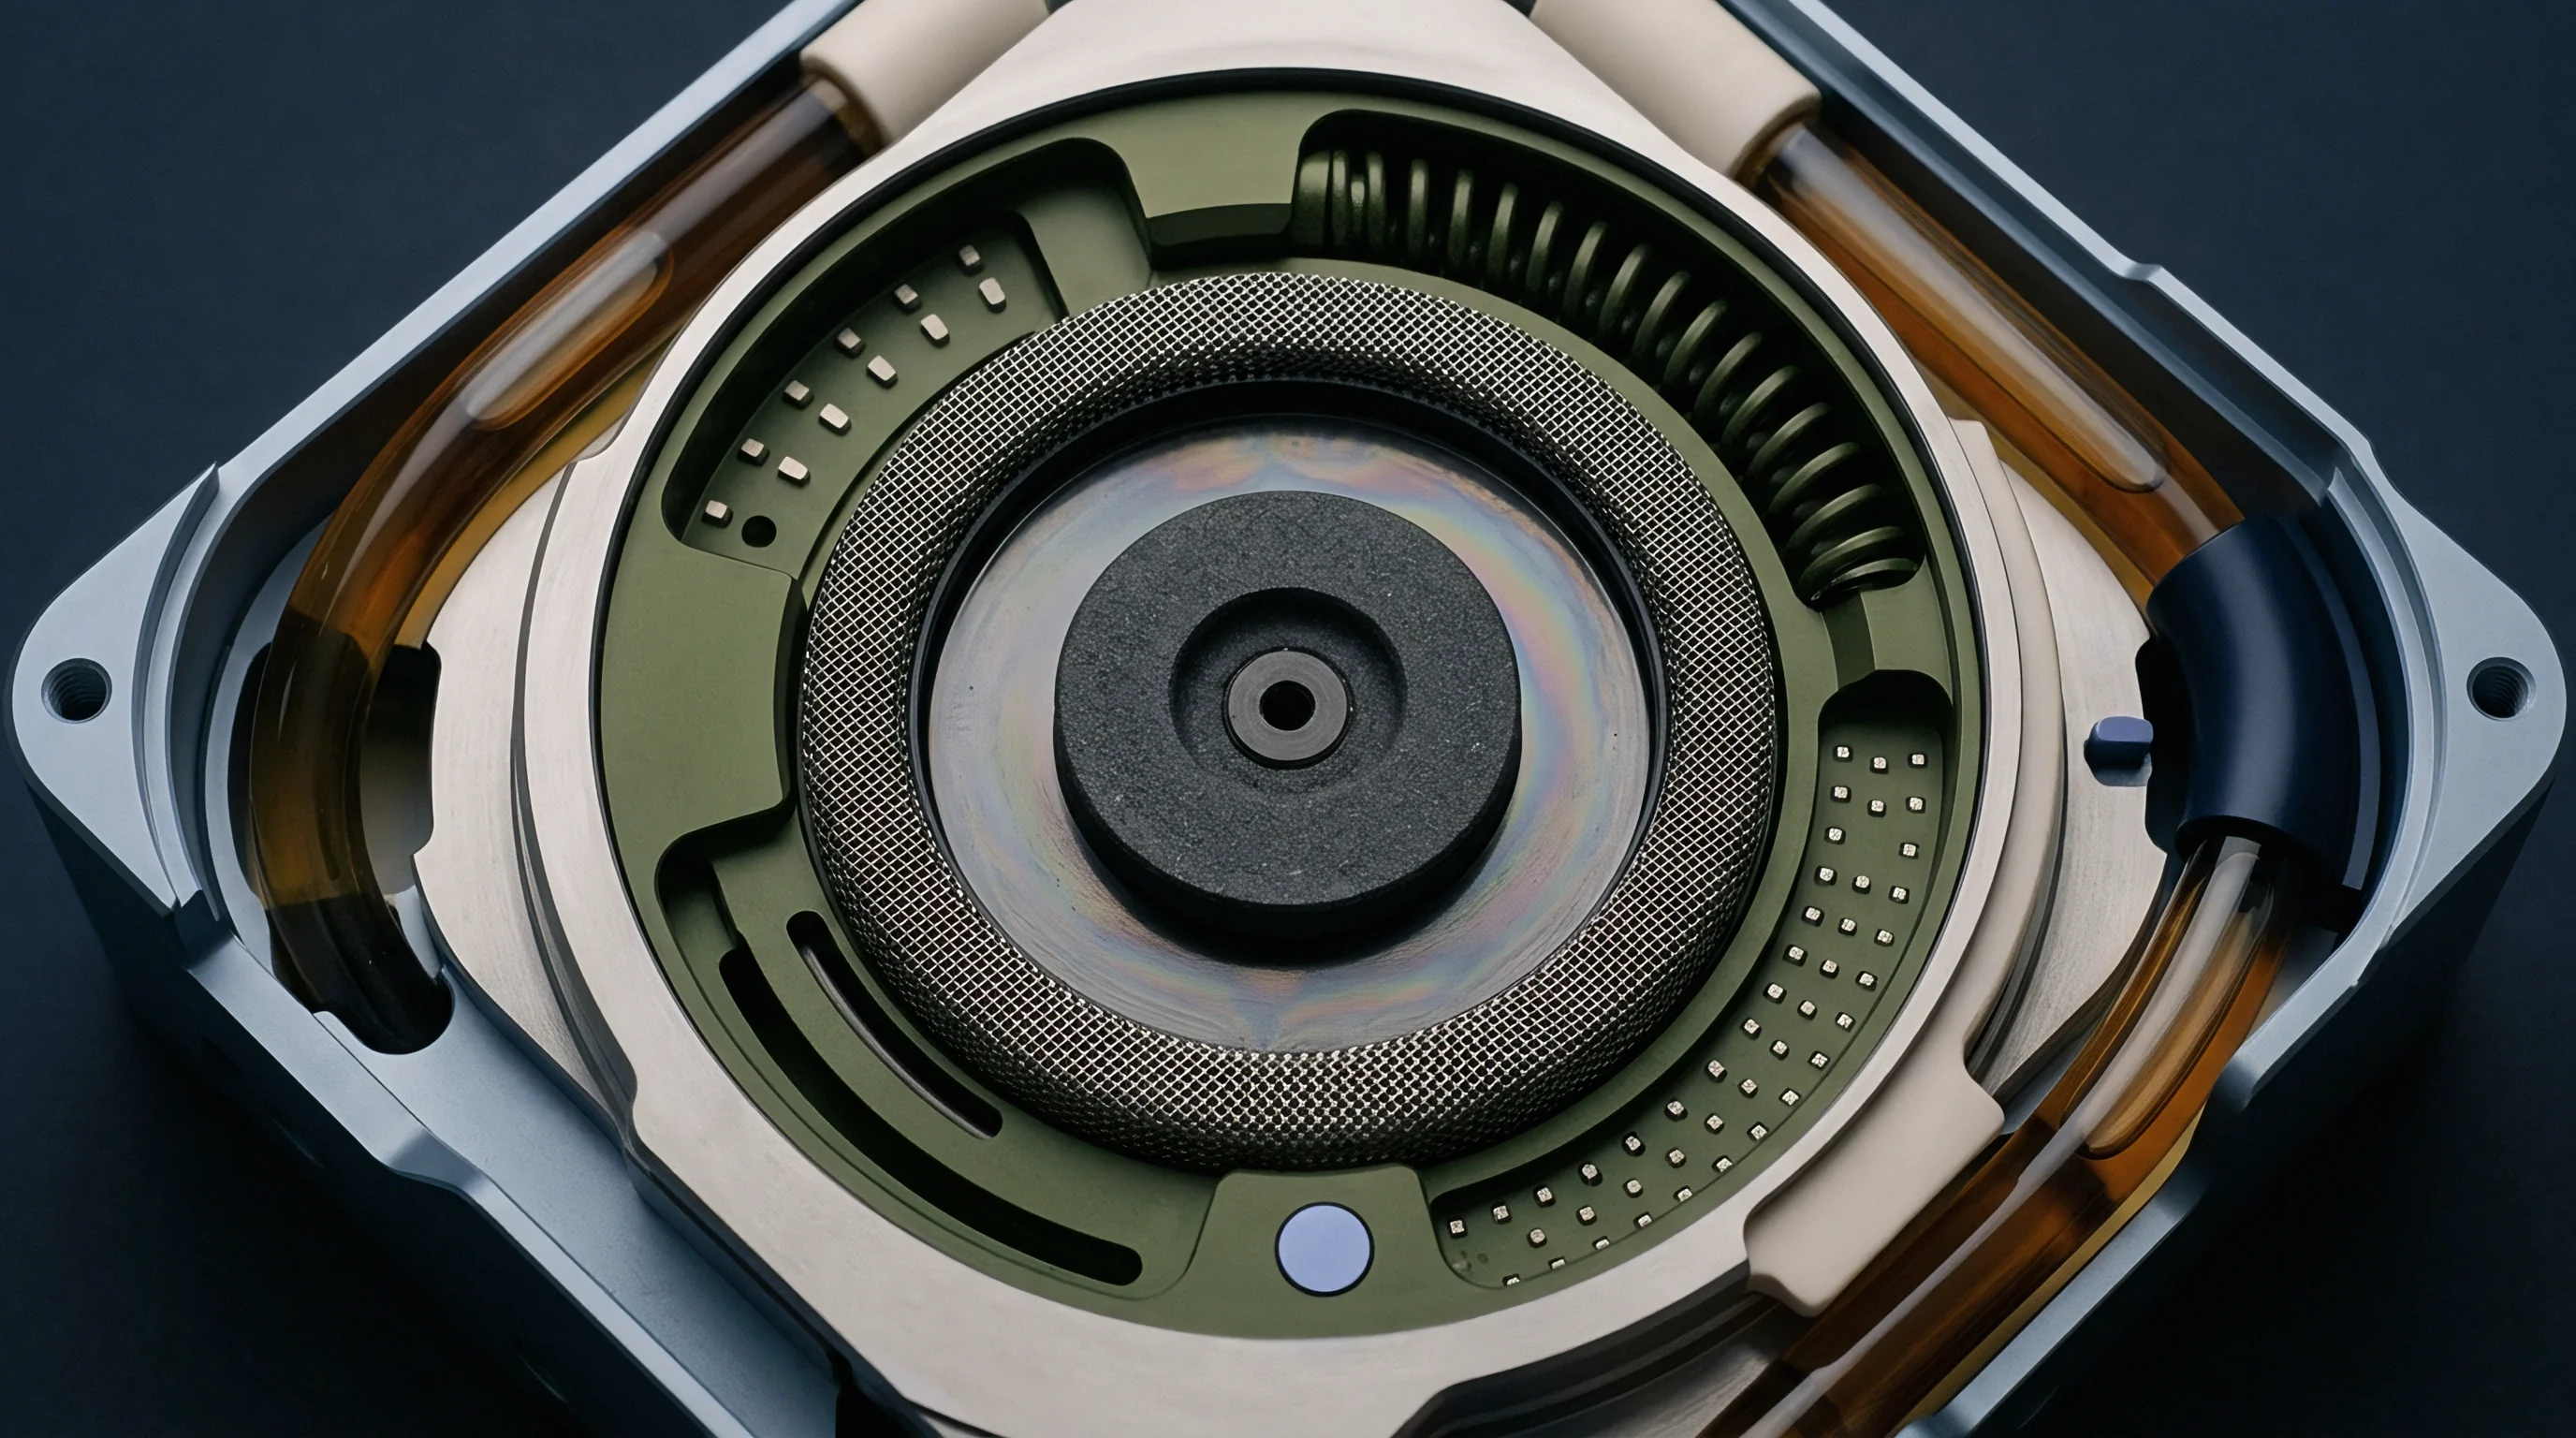
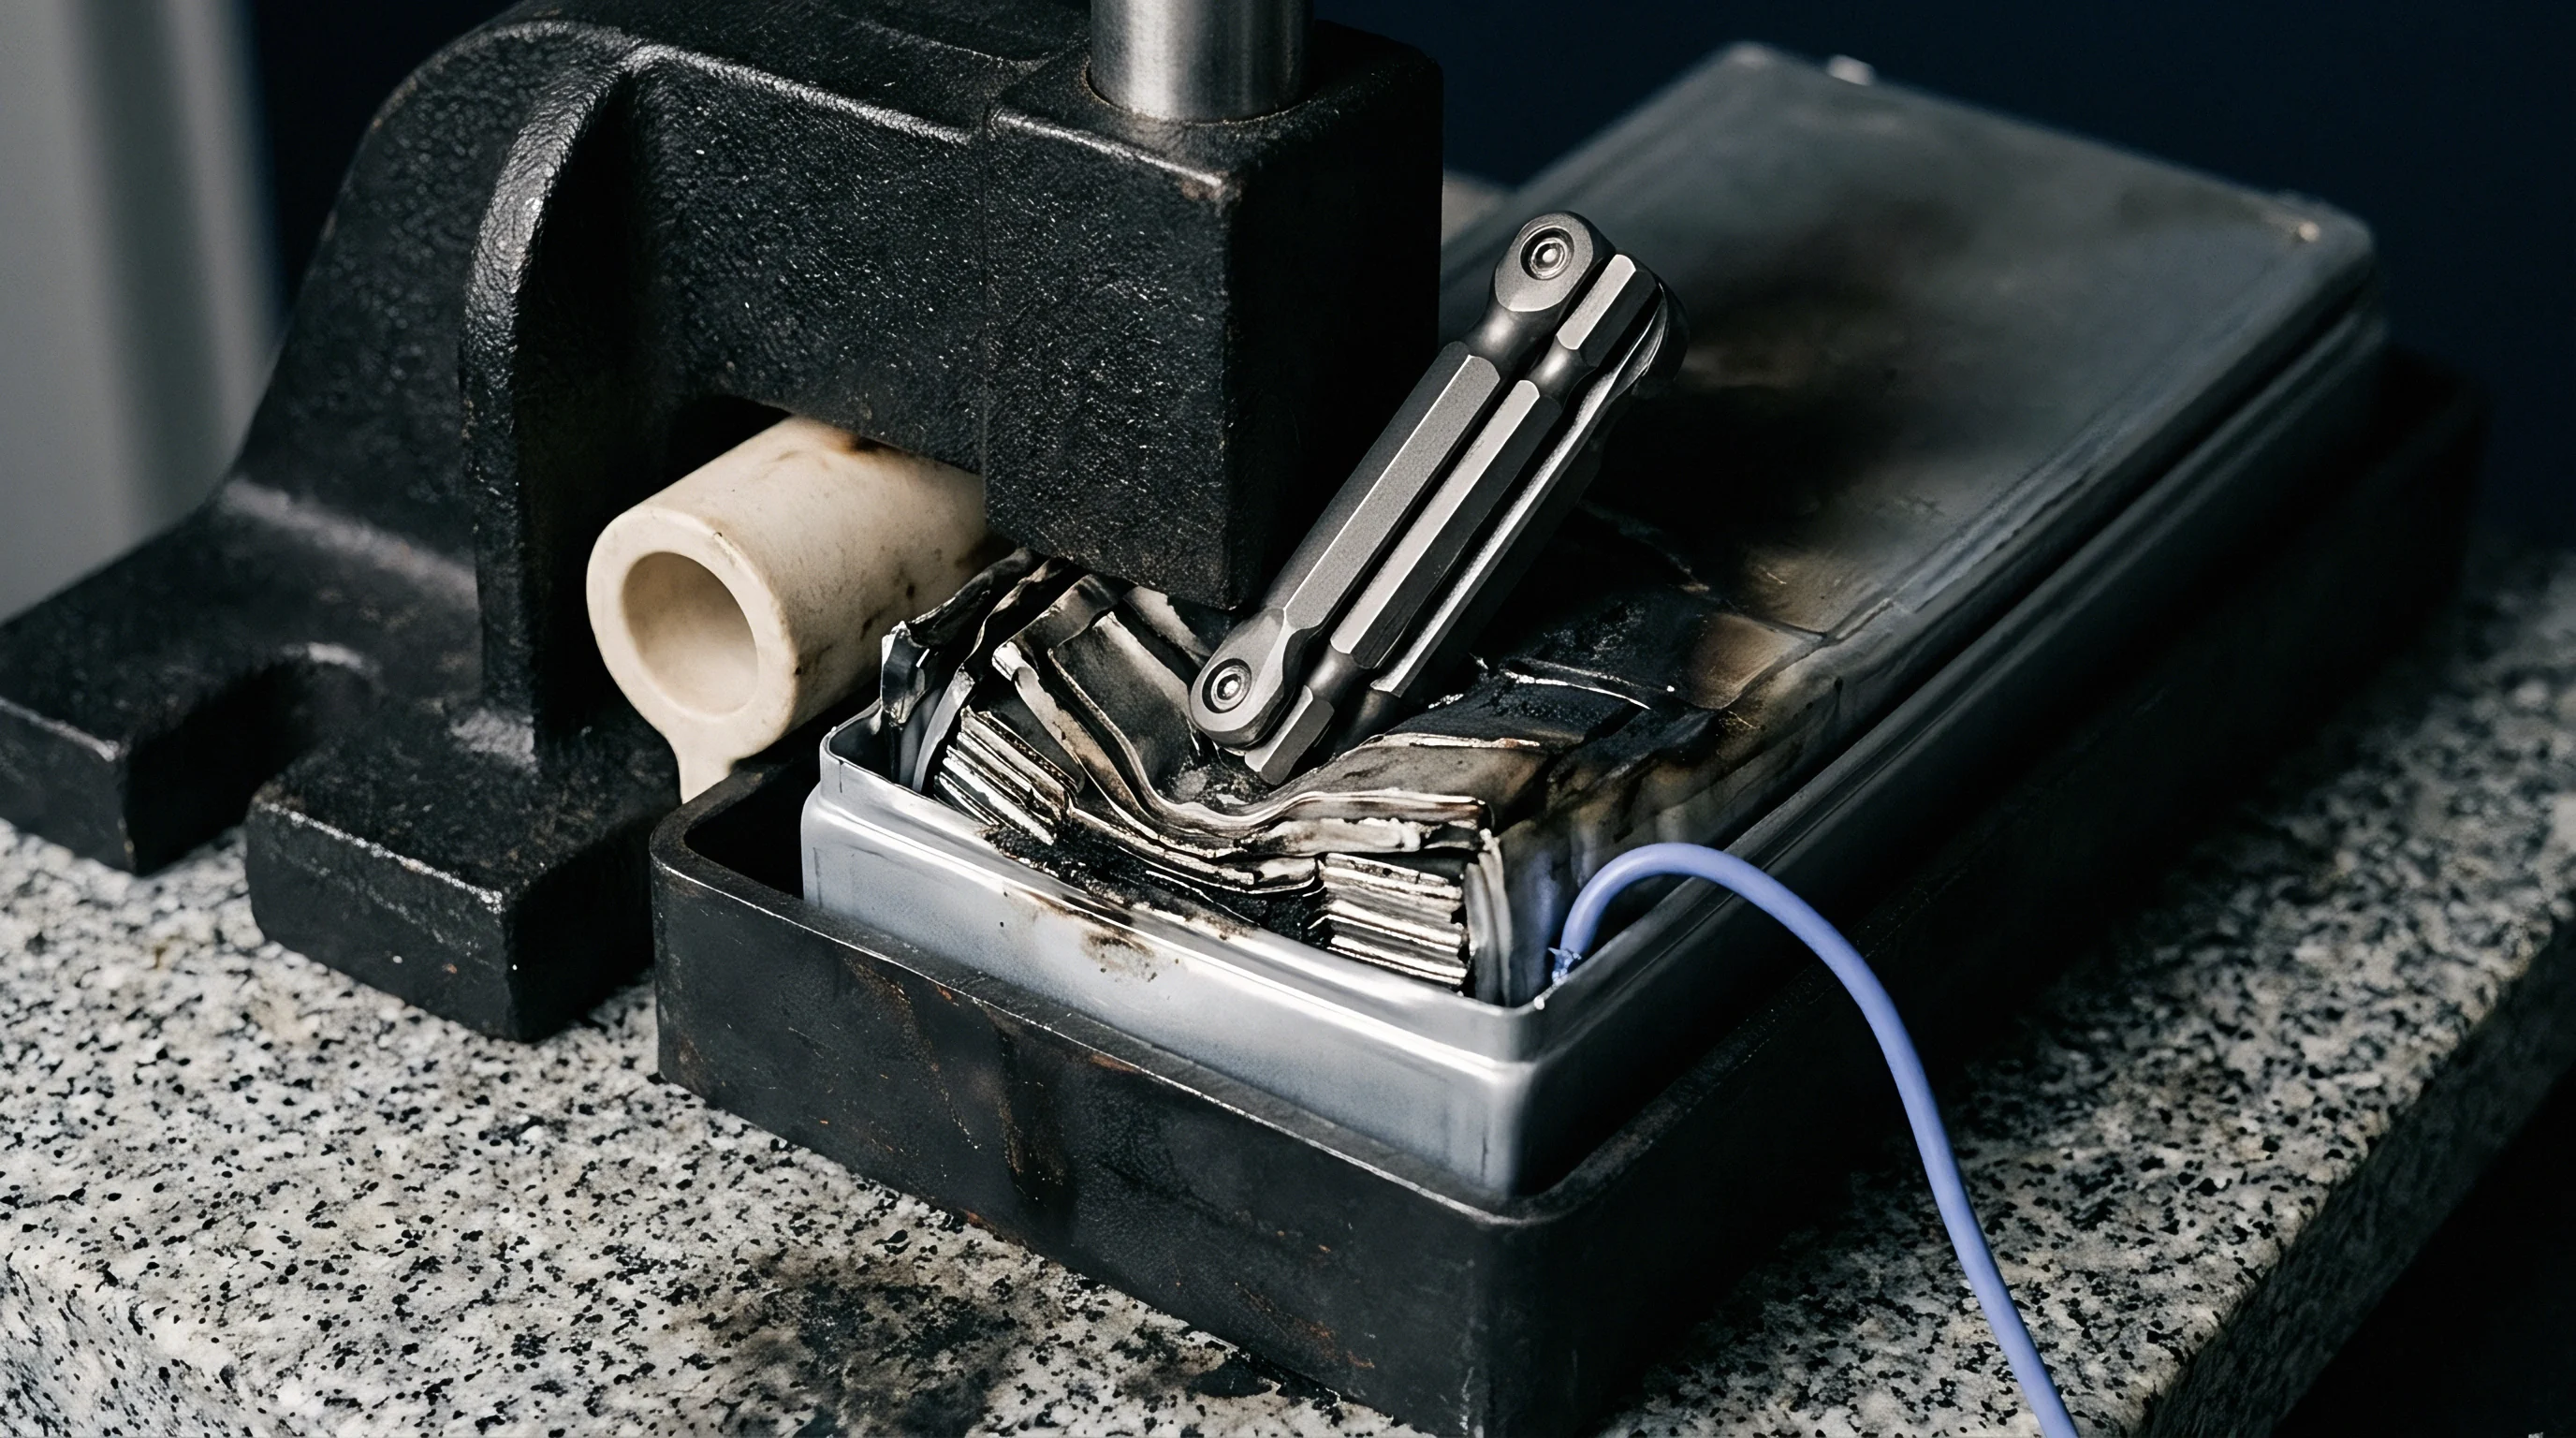
Weld
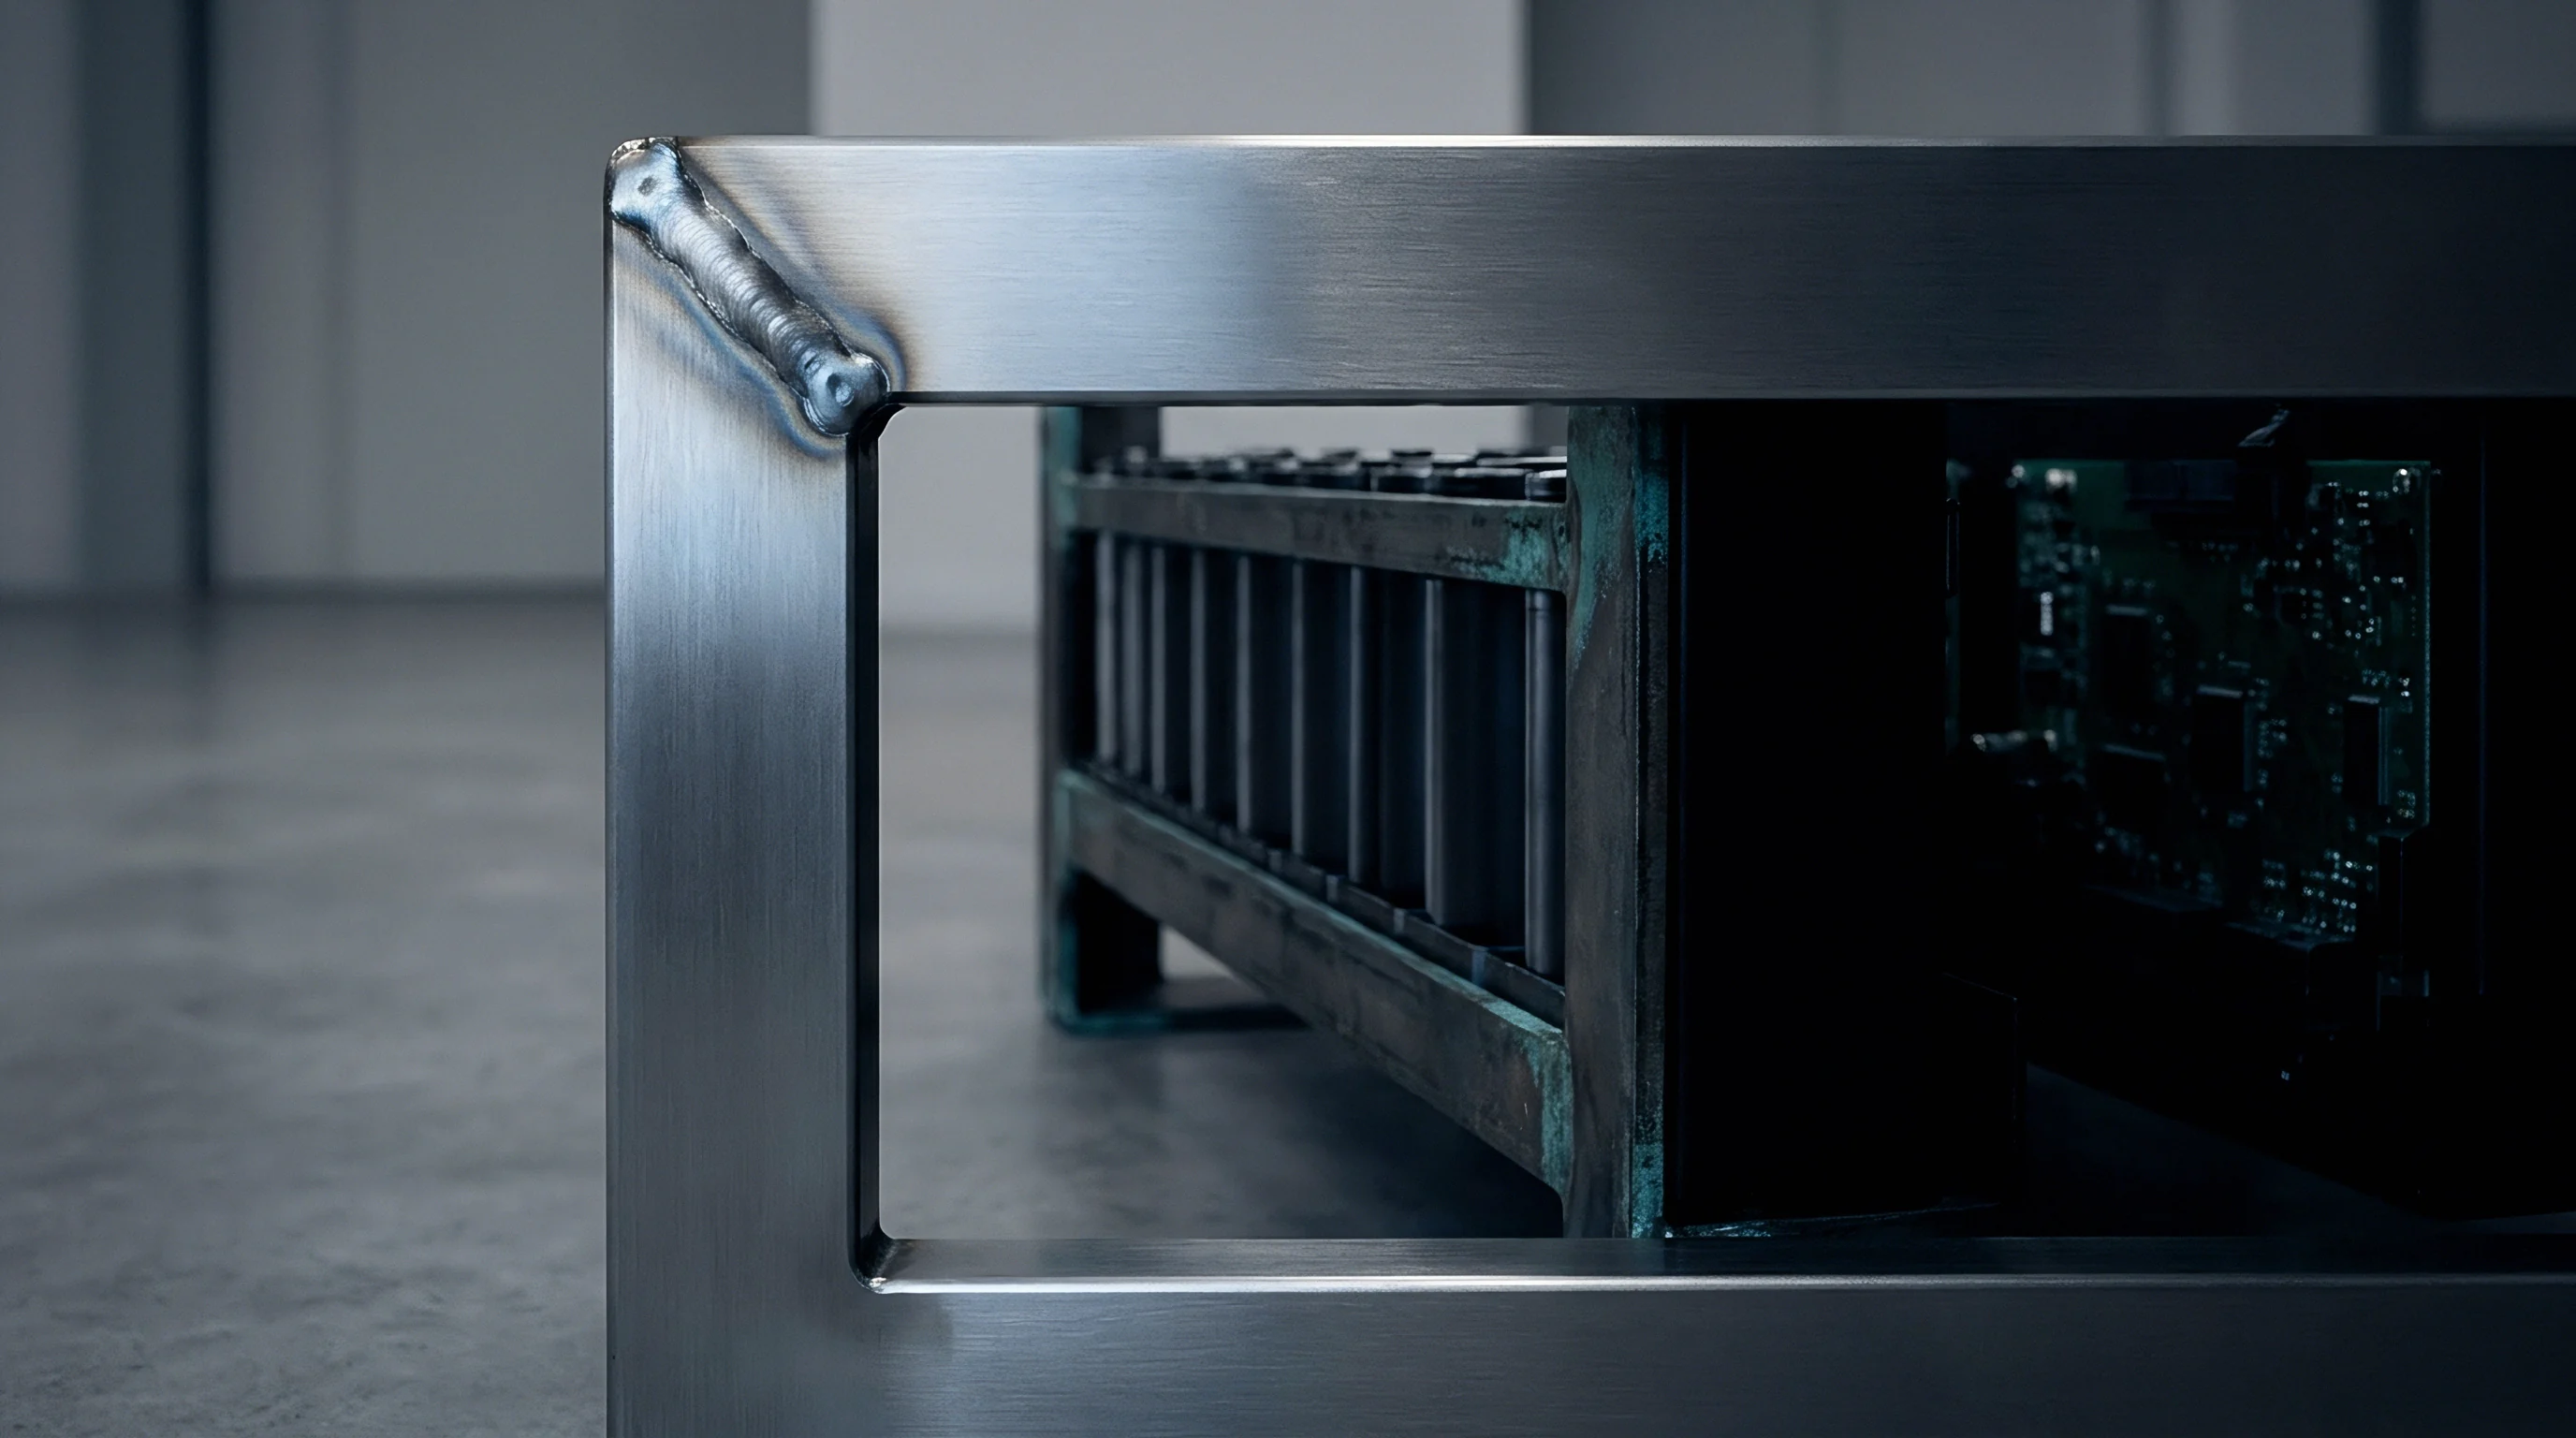
Cell interconnect joints double as structural load paths and primary electrical conductors. Dynamic vehicle motion puts continuous stress on internal cell tabs, forcing busbars and cell terminals into relative motion that generates cyclic shear and bending moments across laser-welded and ultrasonic bonds. Micro-fatigue along these joint margins increases electrical resistance, driving up localized temperatures under discharge loads.
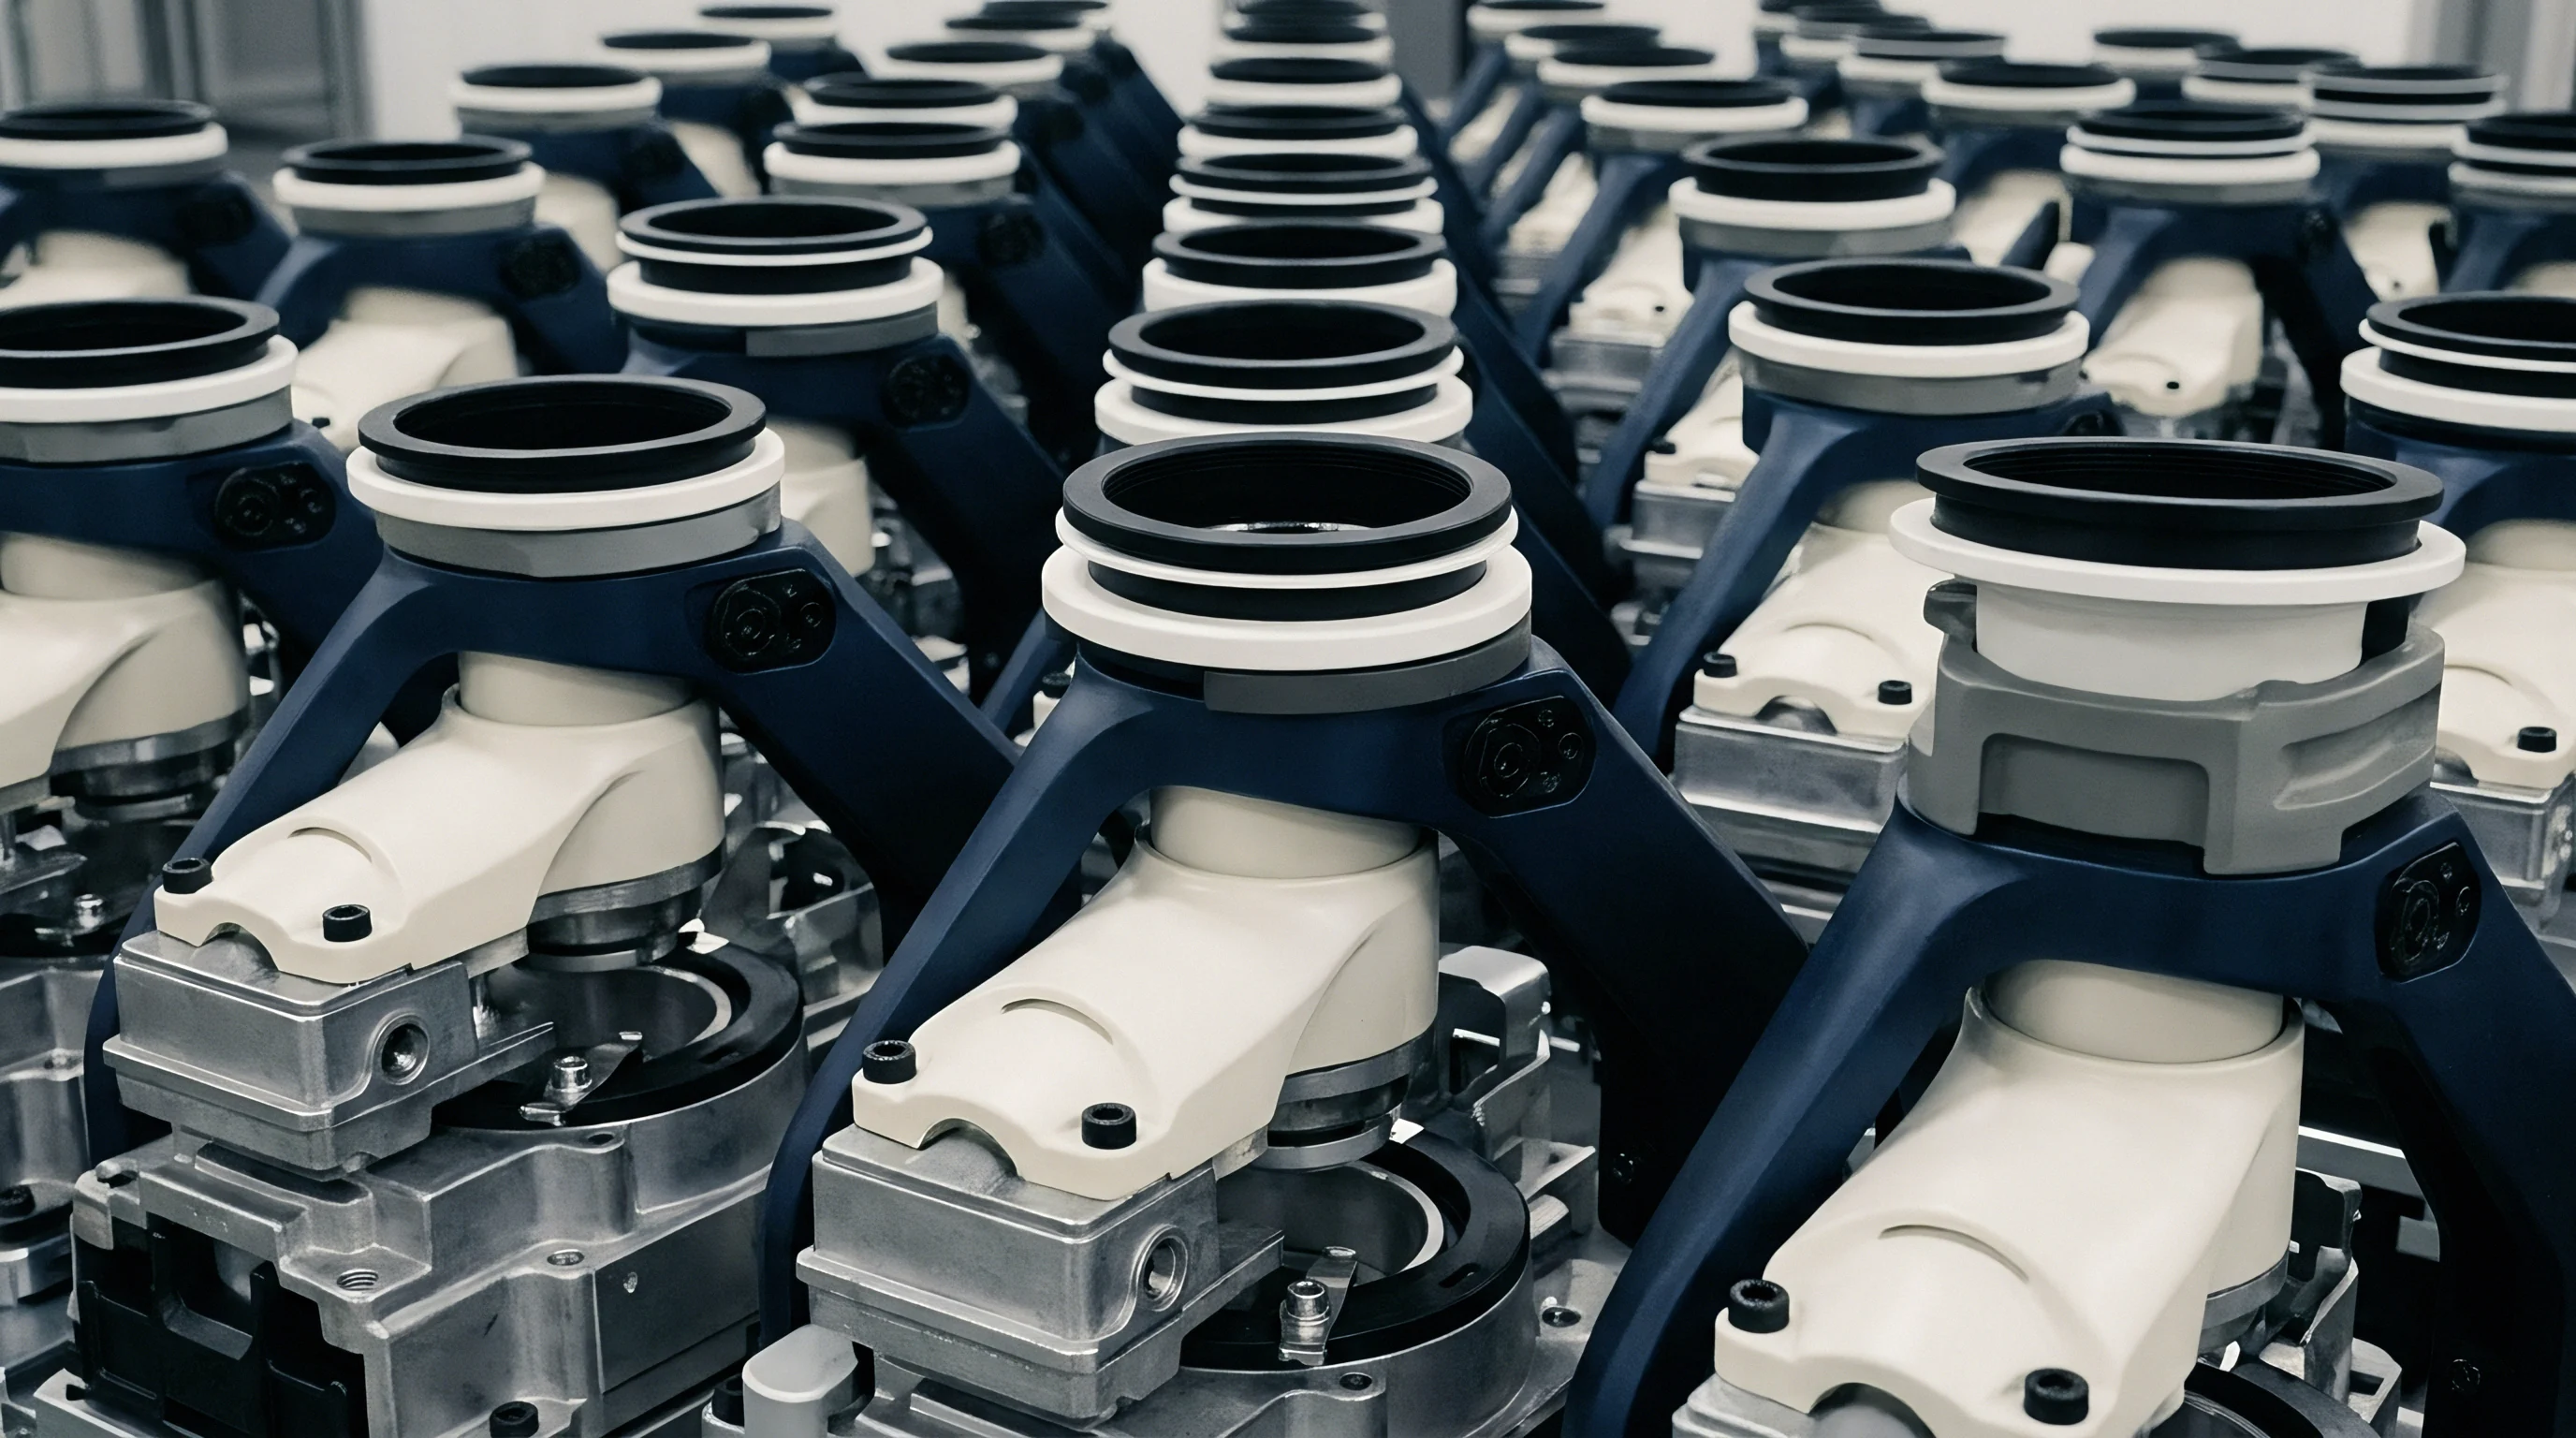
Busbar Mechanical Strain and Micro-Fretting Mechanics
Laser-welded aluminum and copper interconnects face continuous dynamic shear during multi-axis excitation, where dynamic loads easily exceed static pack weight. Shear stresses concentrate around terminal posts. As module frames flex under vertical acceleration, busbars spanning rigid cell clusters absorb localized strain, initiating sub-surface fatigue from micro-cracks.
Micro-fretting corrosion then occurs as contact surfaces rub at sub-micron amplitudes, stripping oxide layers and raising electrical impedance.
- Intermetallic interface fatigue leads to progressive micro-fretting along laser-weld root lines under vertical harmonic vibration.
- Wire-bond heel cracking develops at the foot transition of aluminum ribbon bonds subjected to lateral cross-axis resonance.
- Cell terminal seal shear deforms internal crimps when unconstrained busbars exert overhung bending moments.
- Collector tab buckling occurs inside pouch envelopes when external vibration forces relative motion between internal jelly-rolls and external tabs.
Flexible busbar expansions absorb relative cell displacement before structural intermetallic interfaces experience fatigue cracking.
Interconnect fatigue follows a non-linear stress-life relationship: slight increases in local strain accelerate crack growth exponentially. Finite element models need to evaluate local strain concentration factors right at weld toes instead of relying on nominal cross-sectional stress. Adding expansion loops to solid copper busbars reduces local strain below the fatigue threshold, improving durability during multi-axis vibration tests.
Unchecked harmonic shear across terminal joints increases local resistance, creating hot spots that can trigger thermal runaway during high-current discharge.

Spectrum
Certification standards set input energy profiles across active frequency bands to simulate transport conditions. UN 38.3.3 T.3 requires a logarithmic sinusoidal sweep from 7 Hz to 200 Hz and back to 7 Hz over 15 minutes, repeated 12 times along each of three mutually perpendicular axes. For modules under 12 kg, peak acceleration holds at 1 g from 7 Hz to 18 Hz ~ maintaining a fixed 0.8 mm displacement amplitude ~ before stepping up to 8 g from 18 Hz to 200 Hz.

Where Does Random Vibration Differ from Sine Sweep Testing?
Logarithmic sine sweeps evaluate discrete structural amplifications across specific bandwidths, but real-world road transport subjects modules to simultaneous multi-frequency inputs. Broad-band random vibration profiles capture this environment far better. Standards like SAE J2380 and ISO 12405-3 specify random profiles in acceleration spectral density (g-squared per hertz) from 5 Hz to 500 Hz, exposing fasteners to continuous displacement while driving cumulative structural damage across all internal natural frequencies at once.
- Mount the module rigidly to the vibration slip table using production-intent brackets torqued to specification.
- Install calibrated triaxial accelerometers at module corners, the center of the top cover, and cell busbar midpoint anchors.
- Perform an initial low-amplitude sine search from 5 Hz to 200 Hz at 0.1 g to map baseline natural frequencies.
- Apply the targeted acceleration spectrum along the primary vertical axis for the duration required by the standard.
- Execute transverse and longitudinal axis vibration runs while continuously monitoring terminal voltage and insulation resistance.
- Run a post-test sine sweep to check for natural frequency shifts against structural acceptance limits.
Comparing acceleration profiles highlights clear differences in how regulatory standards evaluate hardware. UN 38.3 T.3 focuses strictly on transport safety clearance, whereas SAE J2380 simulates 100,000 miles of vehicle service life. Shifting axis orientations also changes where fatigue stresses concentrate within the assembly.
| Standard Designation | Profile Waveform | Frequency Bandwidth (Hz) | Peak or G-RMS Acceleration | Axis Duration |
|---|---|---|---|---|
| UN 38.3.3 T.3 | Logarithmic Swept Sine | 7 to 200 | 1 g to 8 g Peak | 3 Hours per Axis |
| SAE J2380 | Broad-band Random PSD | 5 to 500 | 1.9 g RMS | 22 Hours per Axis |
| ISO 12405-3 | Broad-band Random PSD | 10 to 2000 | 2.71 g RMS | 12 Hours per Axis |
| IEC 62619 | Logarithmic Swept Sine | 7 to 200 | 5 g Peak | 3 Hours per Axis |
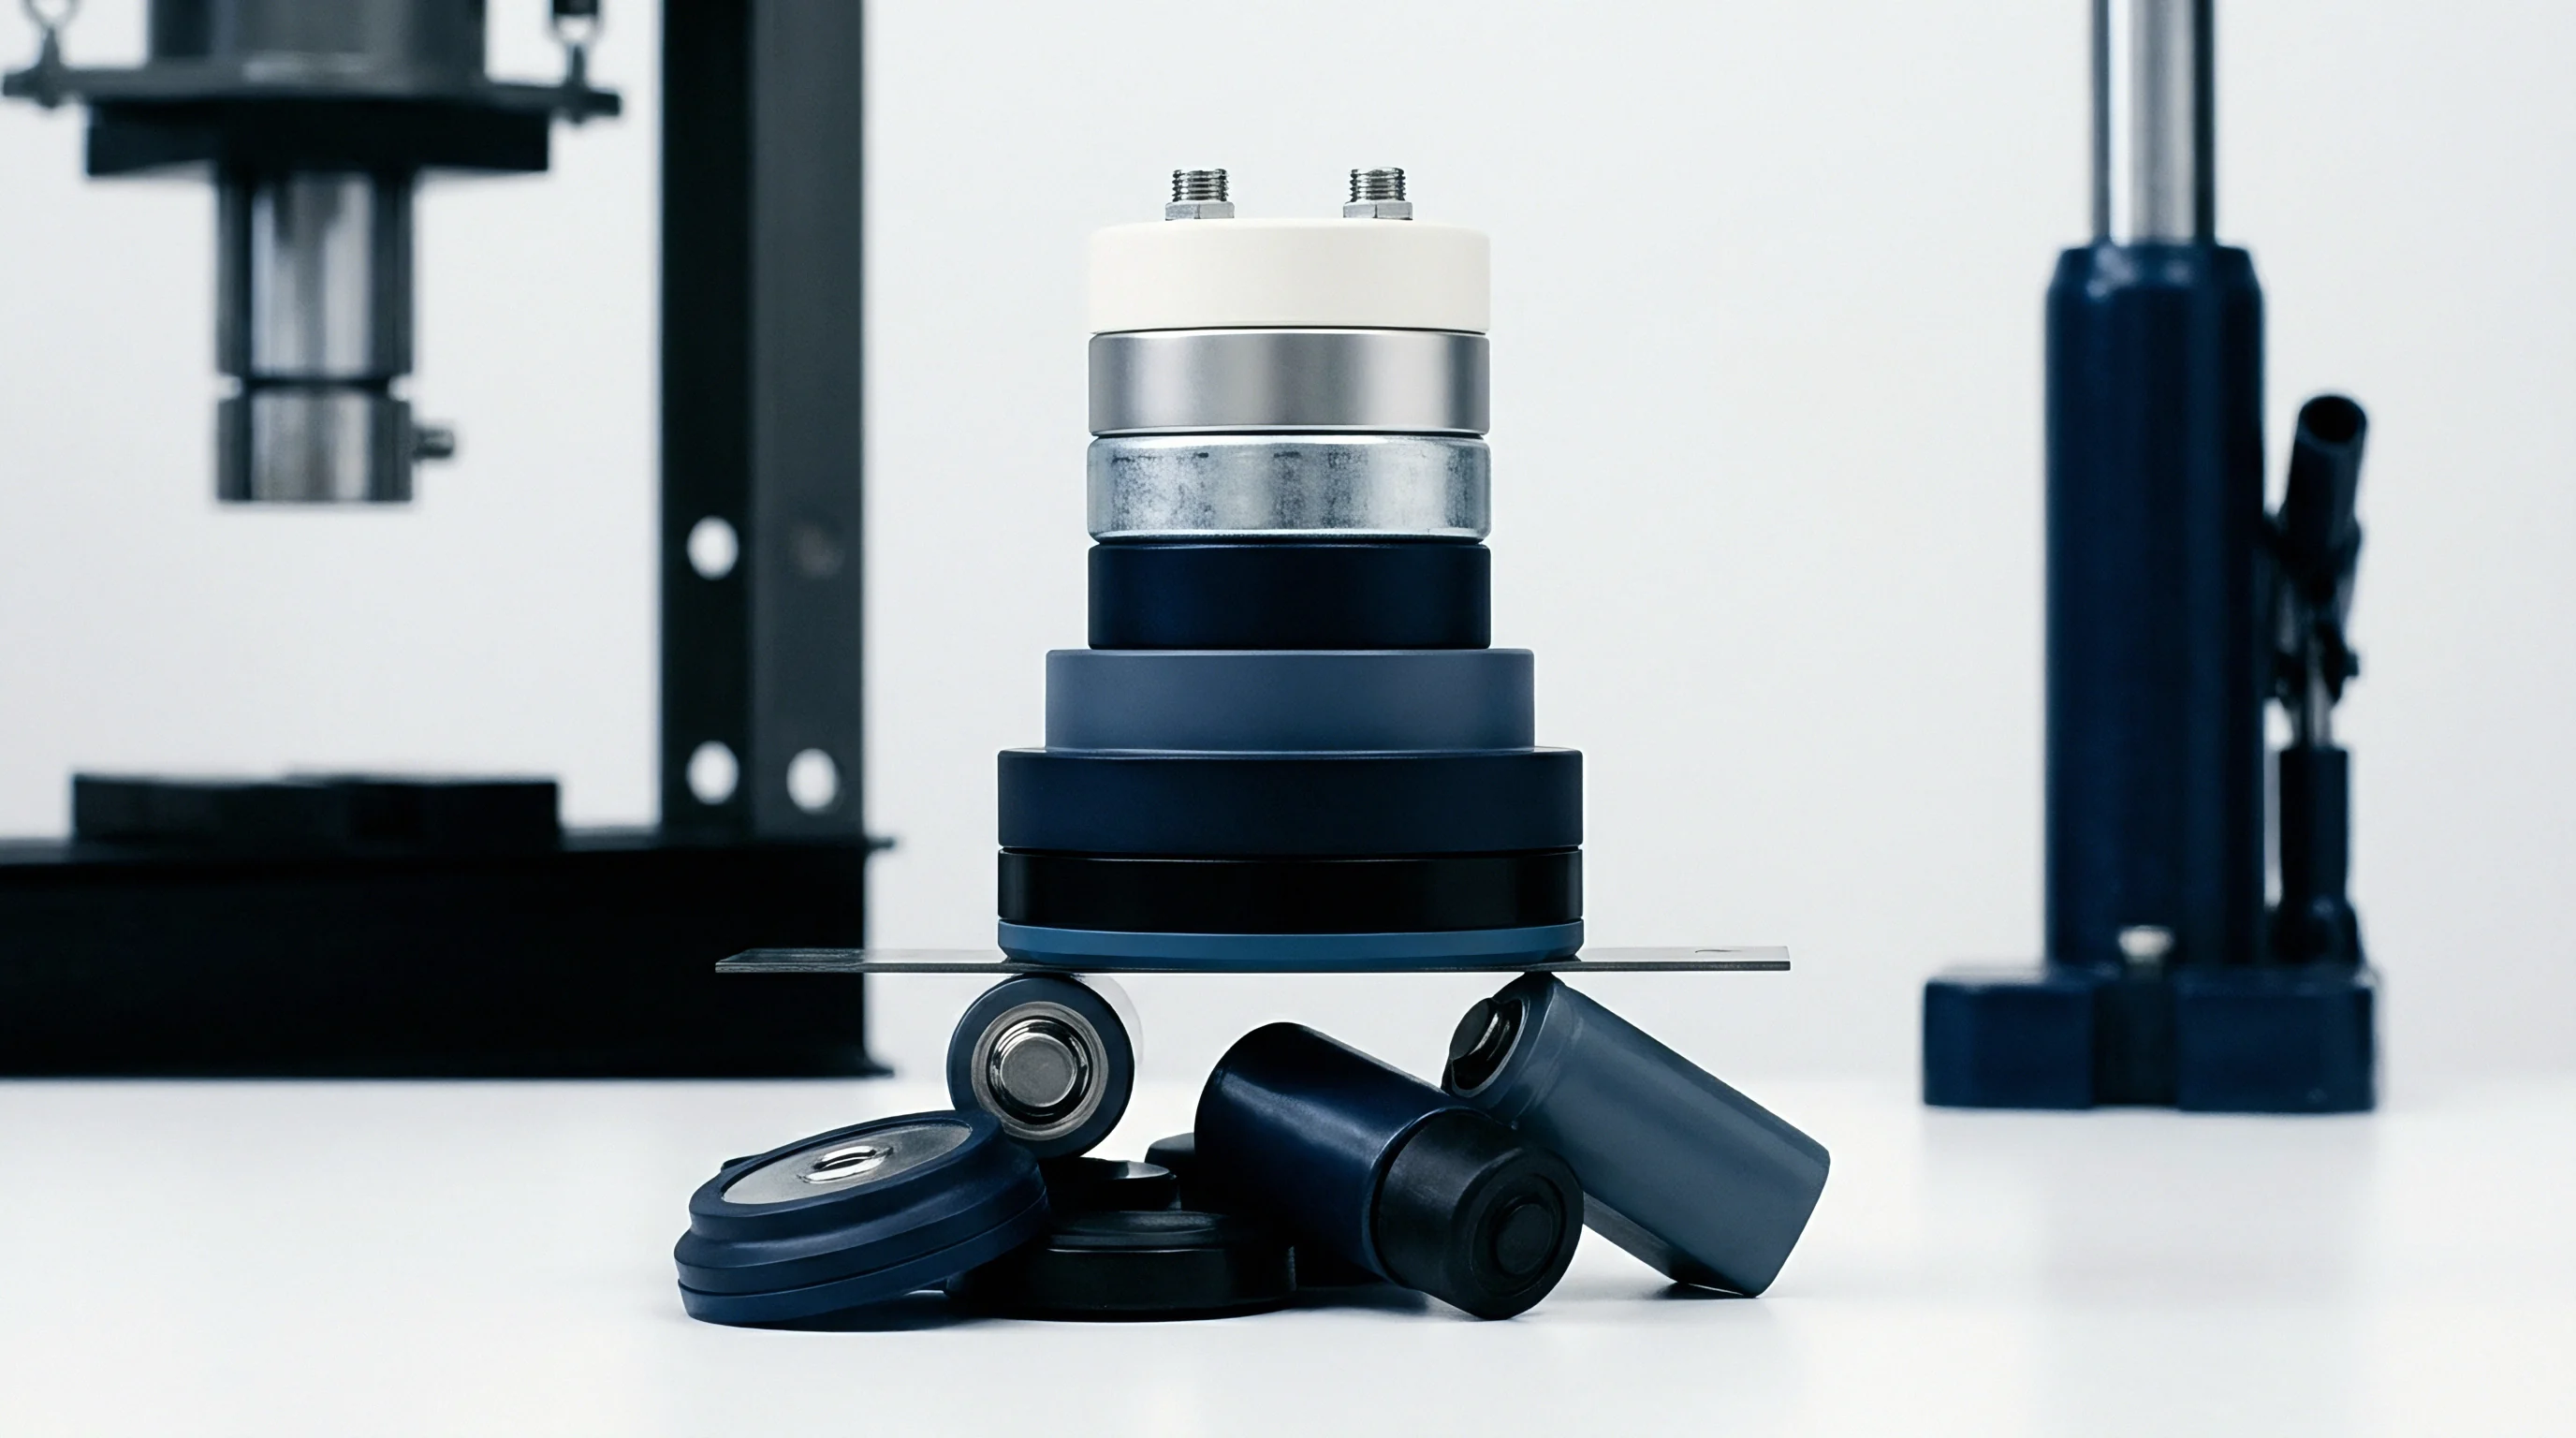
G-RMS Calculations and Damage Acceleration Factors
Integrating input acceleration profiles gives the total energy delivered to the structure for fatigue estimation. Root-mean-square acceleration (G-RMS) equals the square root of the area under the power spectral density curve across the test spectrum. The relationship is expressed directly as:
G-RMS = sqrt( integral( PSD(f) df ) )
Evaluating an ISO 12405-3 random spectrum from 10 Hz to 500 Hz at a constant PSD of 0.02 g-squared per hertz yields a G-RMS value of 3.13 g-RMS, calculated from the square root of 0.02 times 490. Expanding bandwidth or raising profile peaks delivers more energy to internal components, accelerating wear according to Miner’s linear damage rule.
Compliance with UN 38.3 Section 38.3.4.3 dictates zero mass loss, zero leakage, zero rupture, and zero fire following three-axis excitation.
Adding ISO 12405-3 profile requirements into module procurement specs places the validation burden on suppliers before pack-level integration begins.
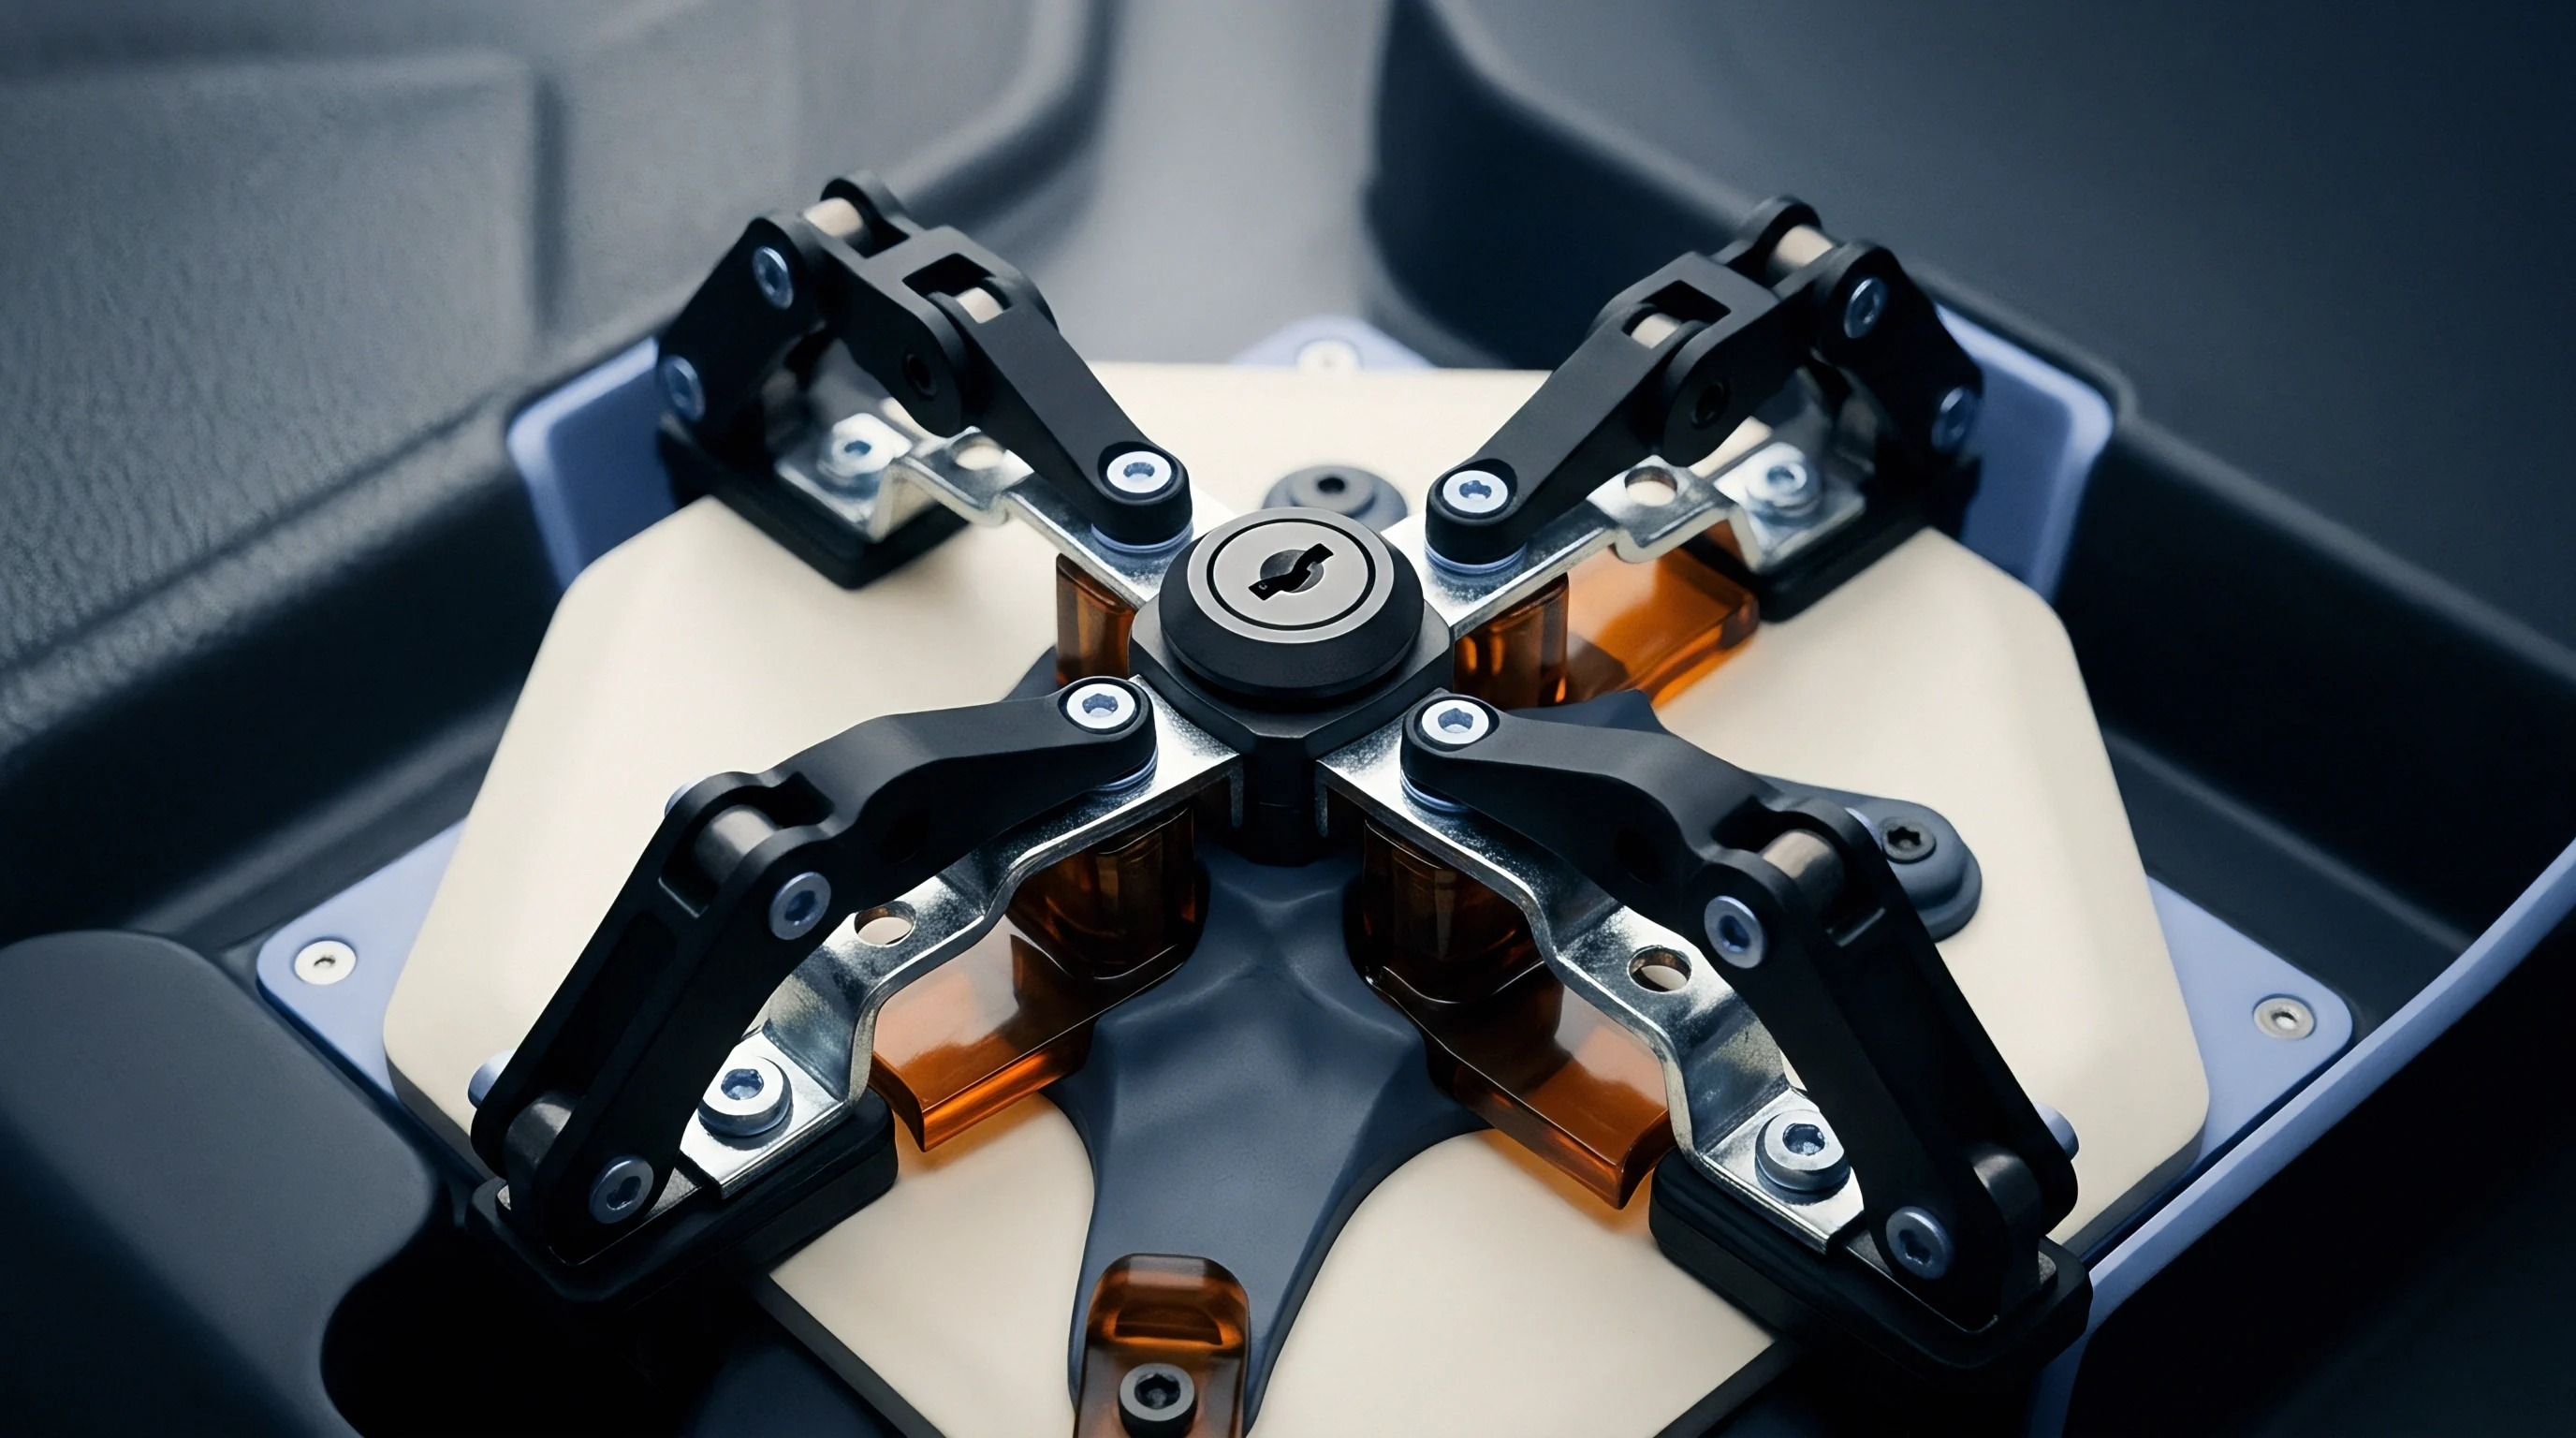
Fixture
Test bench boundary conditions must reflect actual chassis mounting stiffness to provide realistic dynamic inputs. Bolting modules to overly rigid steel plates shifts natural frequencies, hiding resonances that occur in vehicle installations. Conversely, overly flexible fixtures introduce parasitic resonances that over-test module structures and produce false failures during certification sweeps.
Mounting Rig Stiffness and Transmissibility Calibration
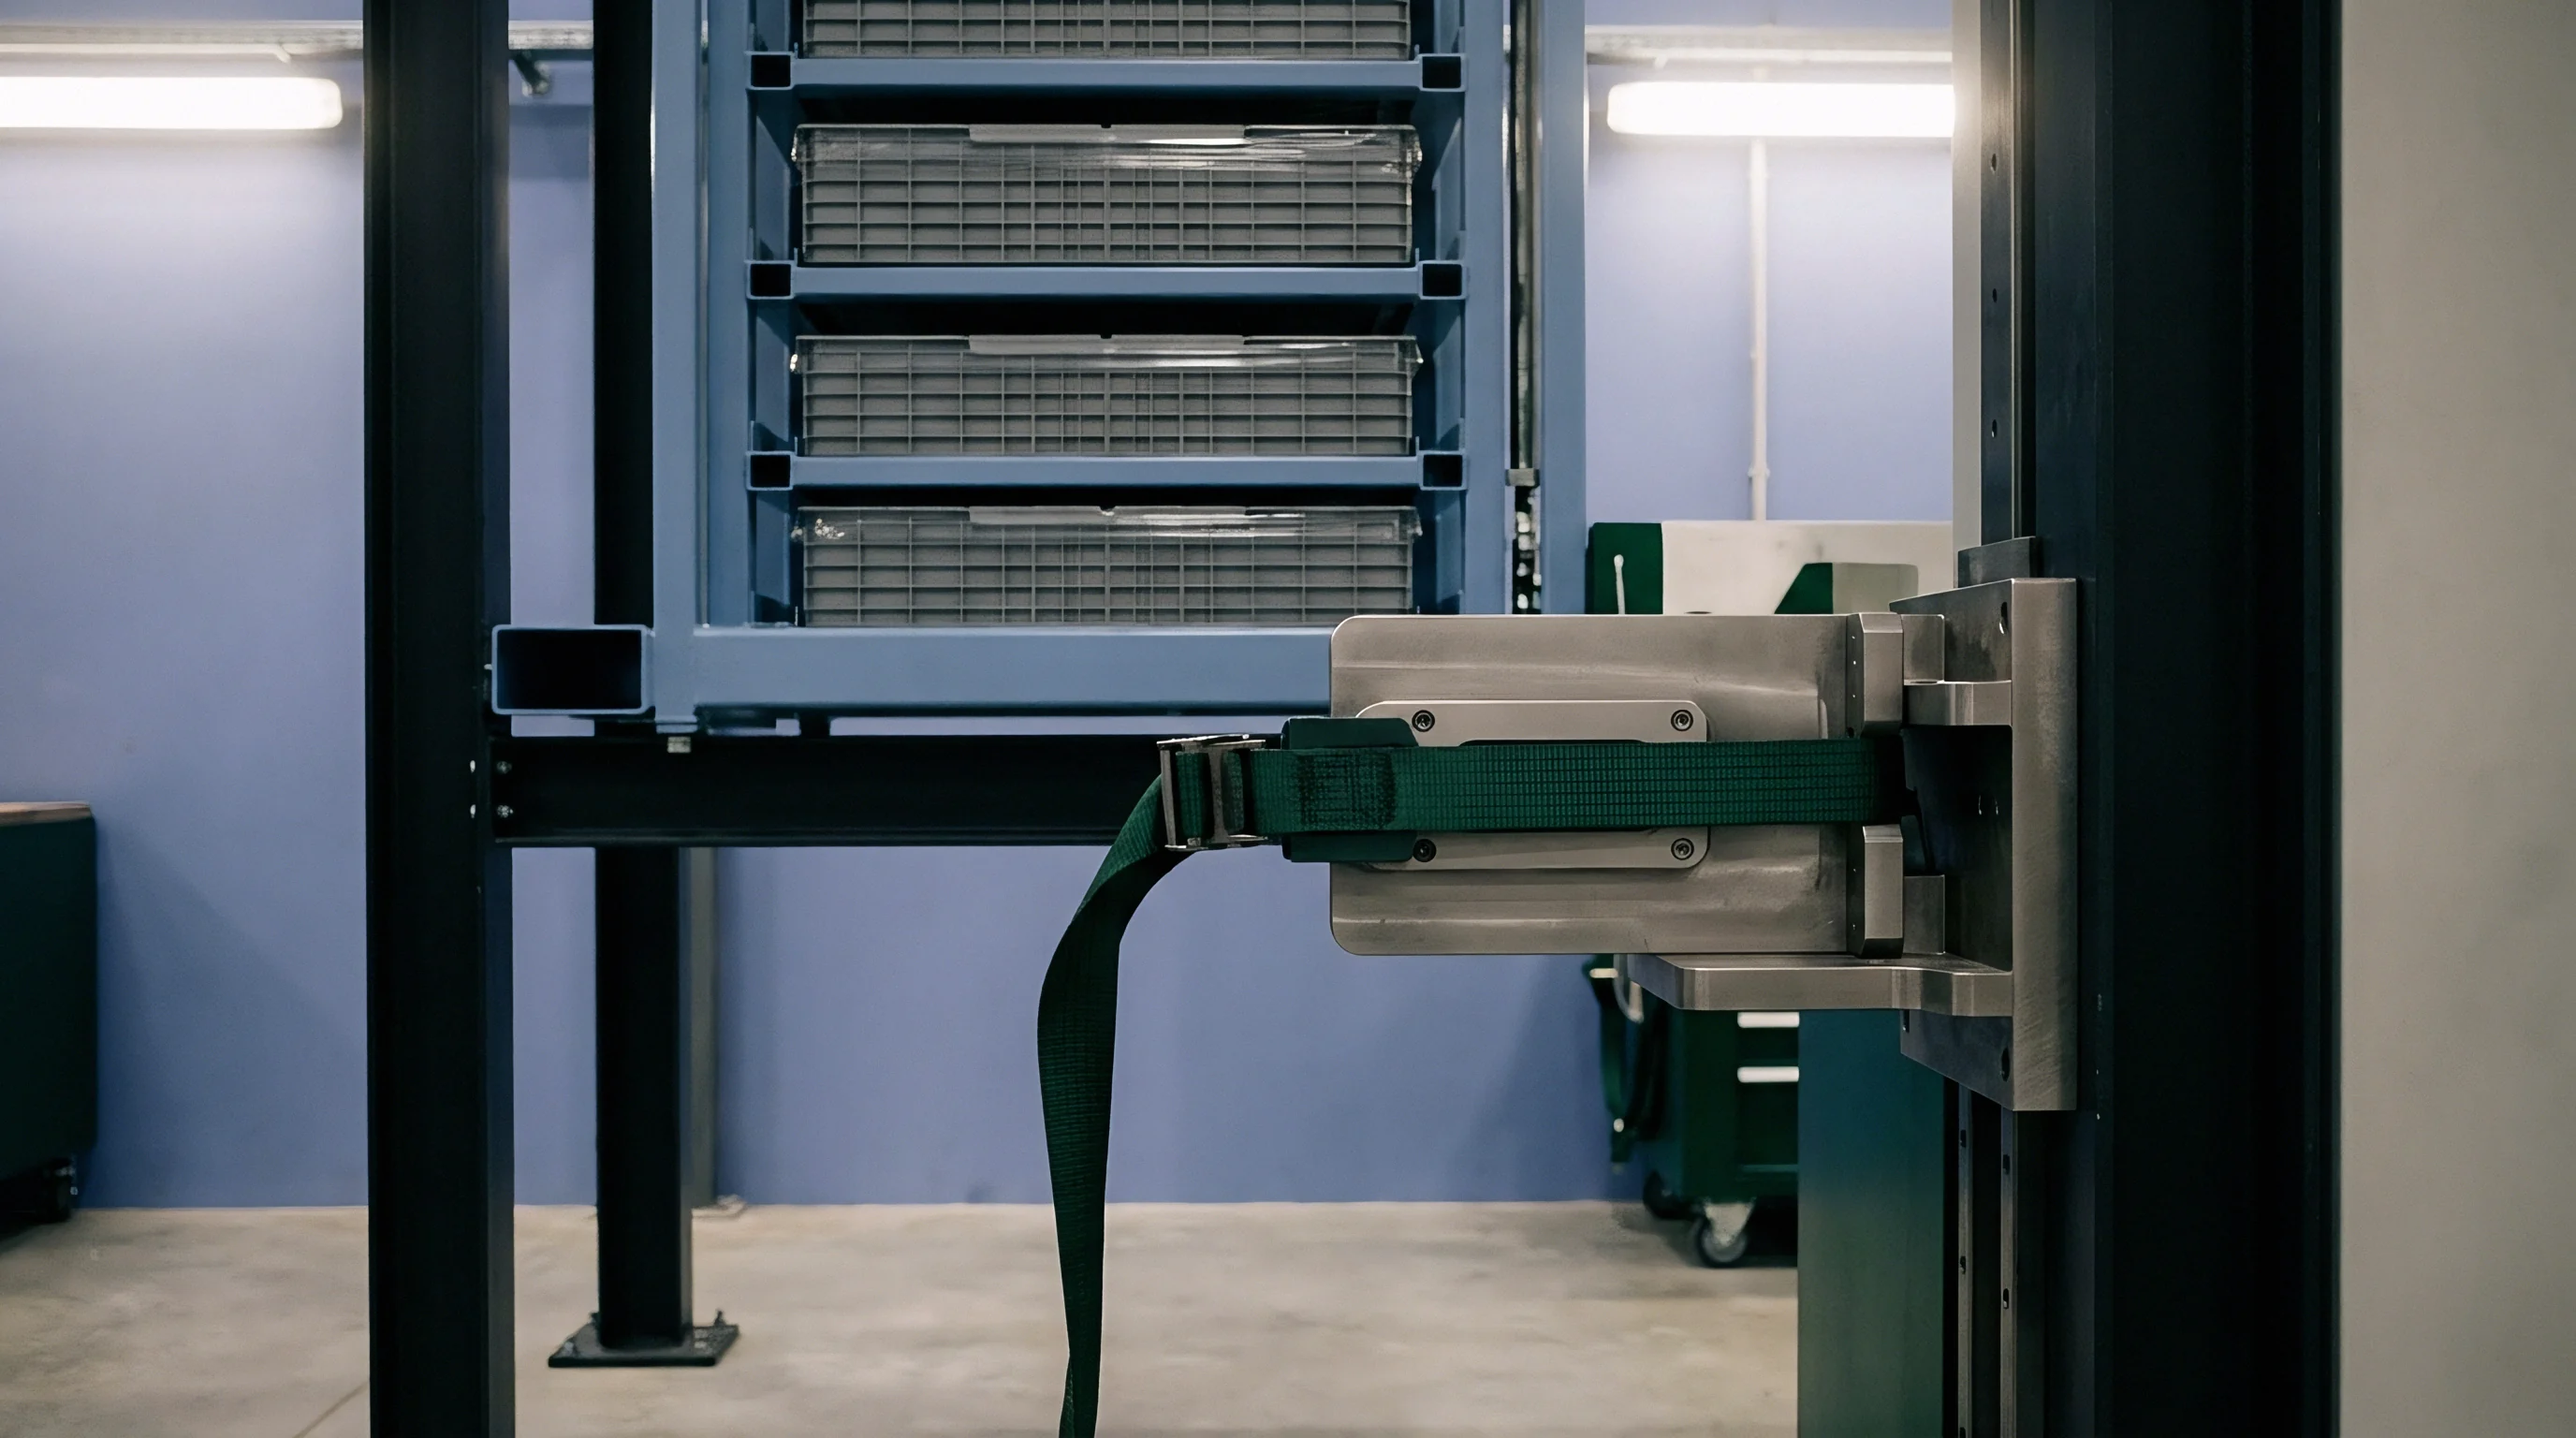
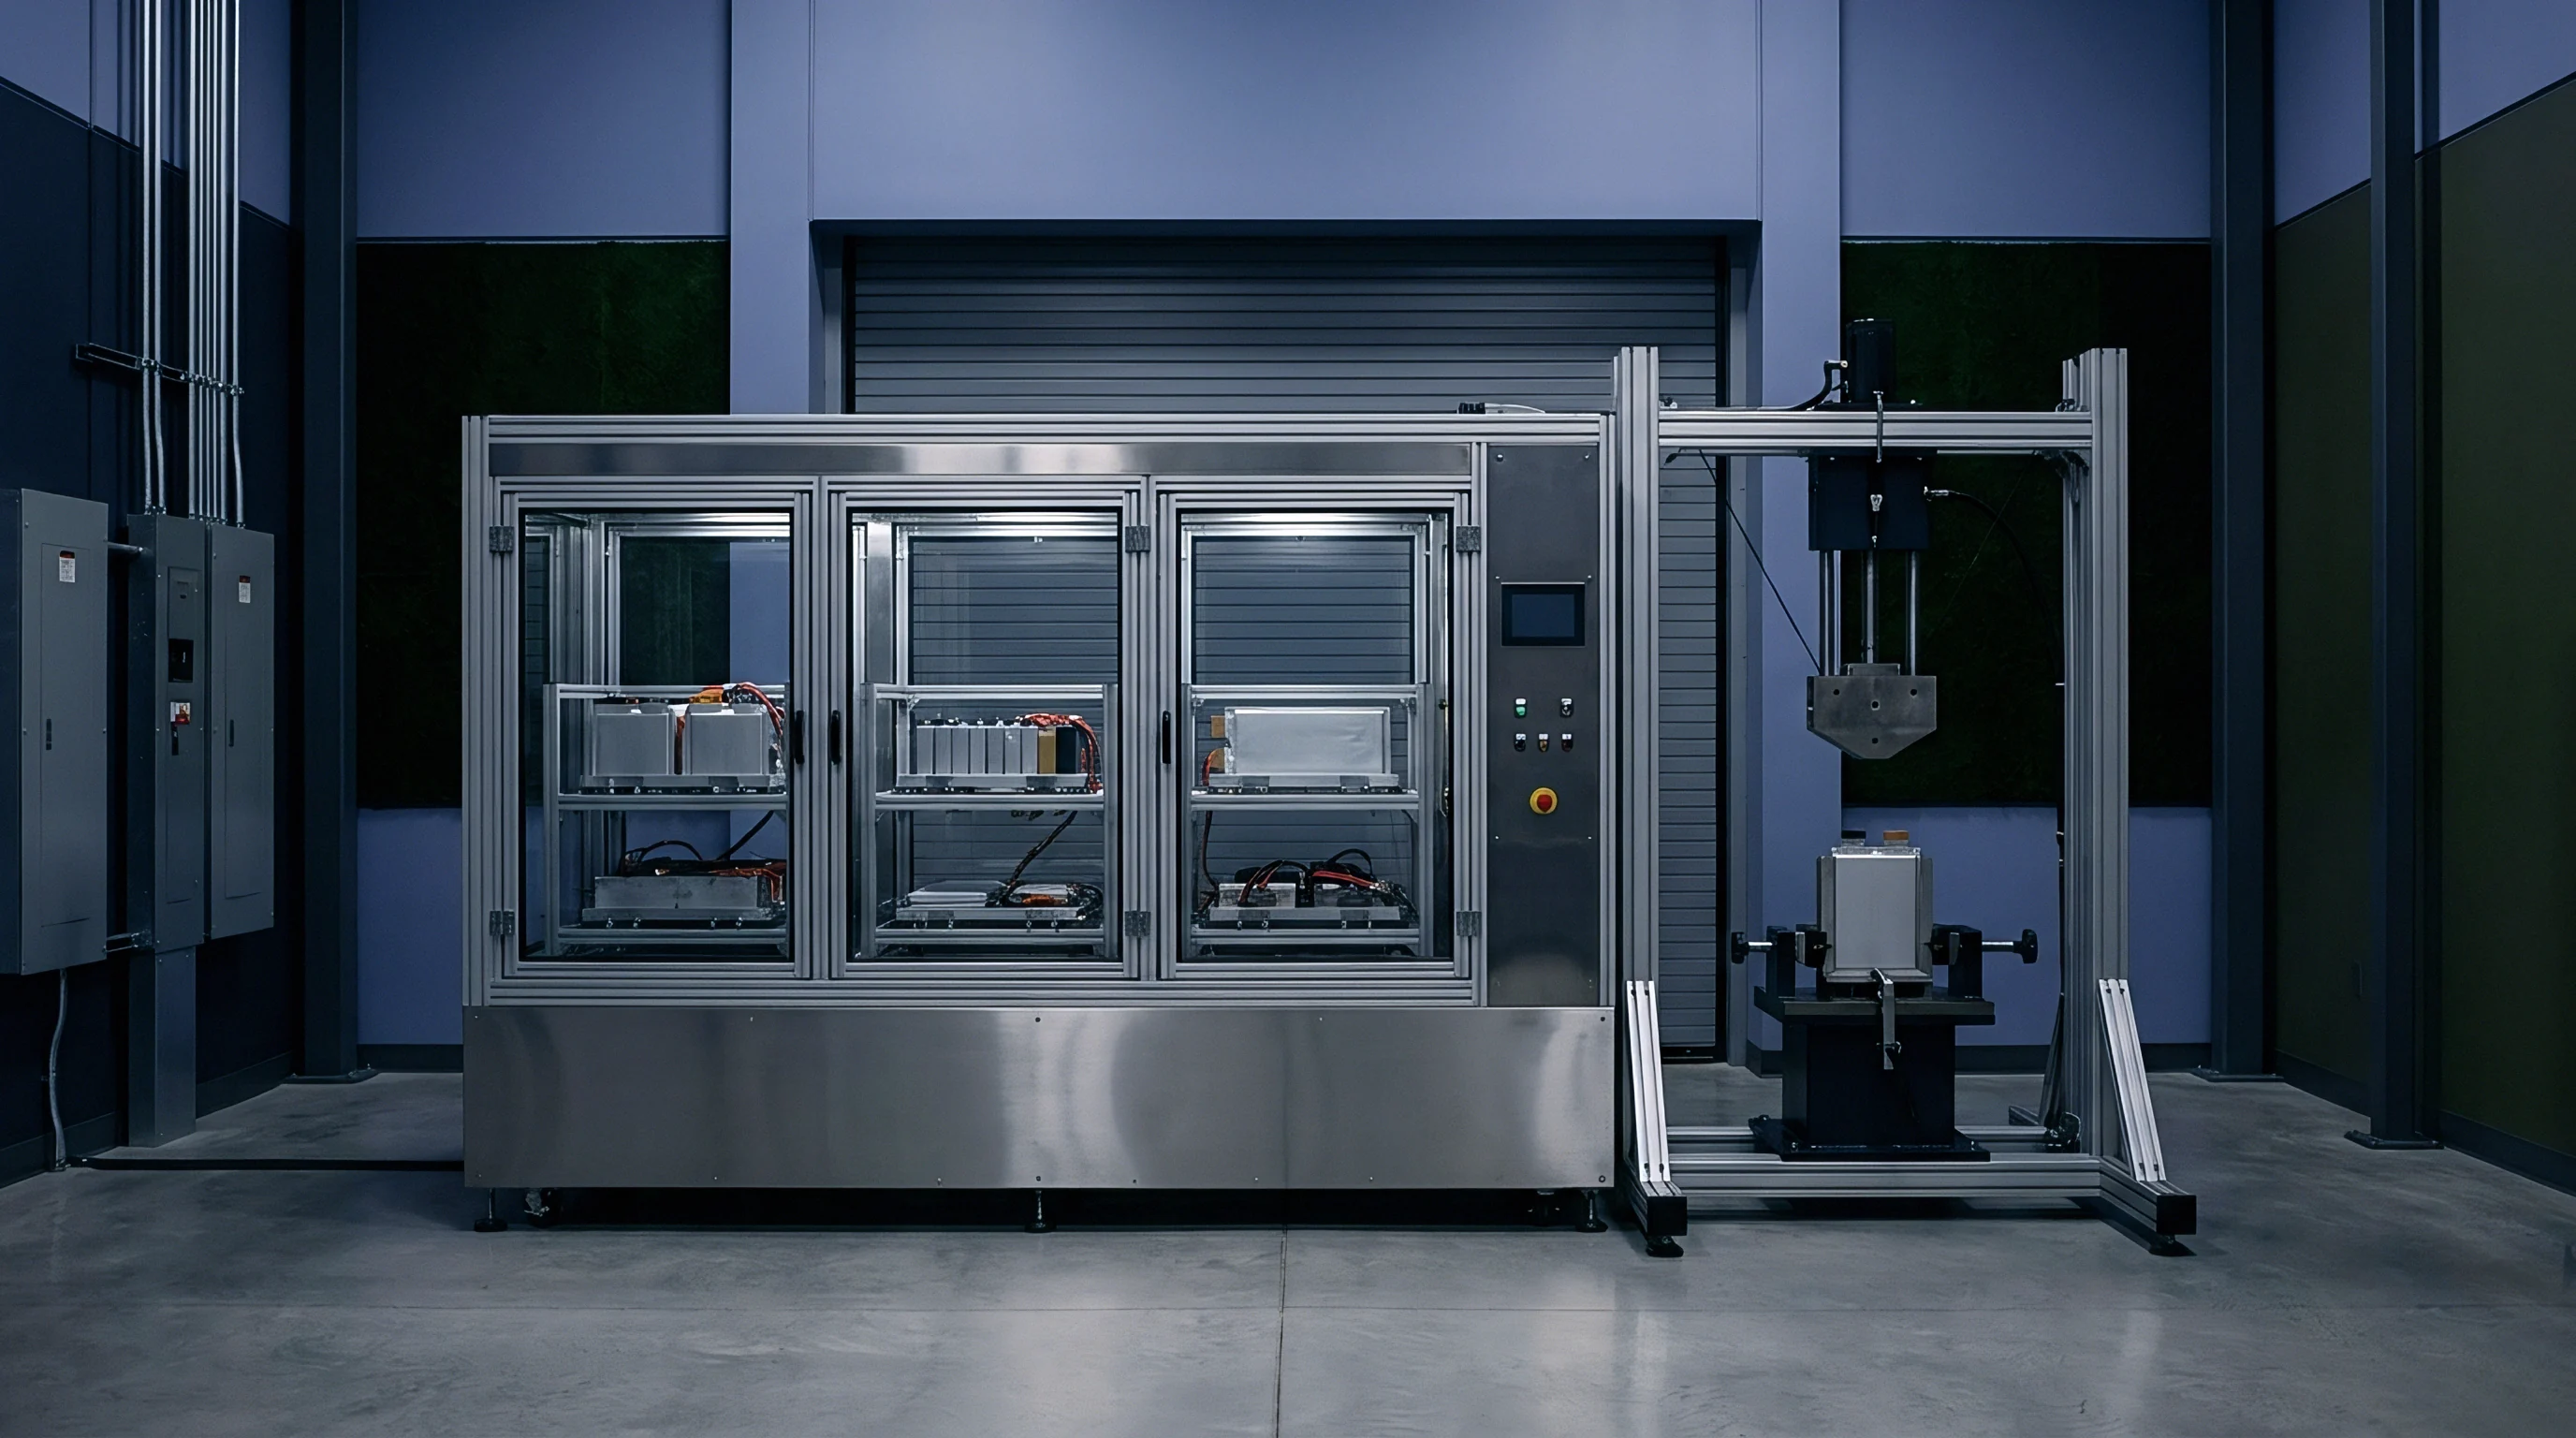
Test platforms require verified dynamic rigidity to prevent phase distortion during high-frequency sweeps. Test fixtures should have fundamental resonant frequencies at least 50 percent above the maximum test frequency. Slip tables on electrodynamic shakers also need precise centering to avoid rocking modes that add unmeasured lateral forces to vertical test routines.
- Structural rigidity verification ensures the fixture stays dynamically flat up to 500 Hz without localized plate flexing.
- Multi-axis orientation indexing allows quick reorientation between vertical, transverse, and longitudinal axes without disturbing clamping preloads.
- Thermal interface pad compression control preserves exact stack height tolerances during environmental vibration runs.
- Control accelerometer placement directly at structural mounting points keeps drive feedback loops from responding to fixture artifacts.
Calibration procedures must map transmissibility across the bare fixture before mounting test units. If fixture transmissibility strays by more than plus or minus 10 percent across the target bandwidth, the test setup must be modified.
Test bench failures stem from artificial fixture resonances or structural module design defects.
Audit
Post-test disassembly and electrical checks confirm structural survivability after mechanical stress testing. Certification requires zero drop in open-circuit voltage, no increase in internal resistance, and no structural housing deformation. Physical teardowns focus on internal damage like wire insulation wear, tab necking, coolant channel cracks, and loosened fasteners.

Electrical and Structural Post-Test Inspection Metrics
Checking terminal continuity and enclosure integrity determines compliance after vibration exposure. Micro-ohm meters measure AC and DC internal resistance before and after testing. Resistance increases over 5 percent point to internal weld cracks or tab fretting, while open-circuit voltage must stay within 0.05 percent of baseline to verify that no internal shorts or isolations occurred.
| Evaluation Metric | Measurement Method | Pass/Fail Acceptance Threshold | Structural Failure Indication |
|---|---|---|---|
| Open Circuit Voltage Delta | Precision DMM (6.5 digit) | Shift under 0.05% baseline | Internal tab short or cell disconnect |
| AC Internal Resistance | 1 kHz Milliohm Meter | Increase under 5.0% baseline | Laser weld fracture or micro-fretting |
| Insulation Resistance | 500 V DC Megohmmeter | Greater than 100 Ohms per Volt | Abraded wire harness or coolant leak |
| Fastener Retention Torque | Calibrated Torque Wrench | Loss under 15% initial spec | Thread stripping or joint creep |
| Coolant Loop Integrity | Pressure Decay (200 kPa) | Zero pressure drop over 10 min | Chiller plate solder seam crack |
Microscopic displacement of cell internal winding rolls inside pouch or cylindrical casings remains undetected by simple exterior visual inspections.
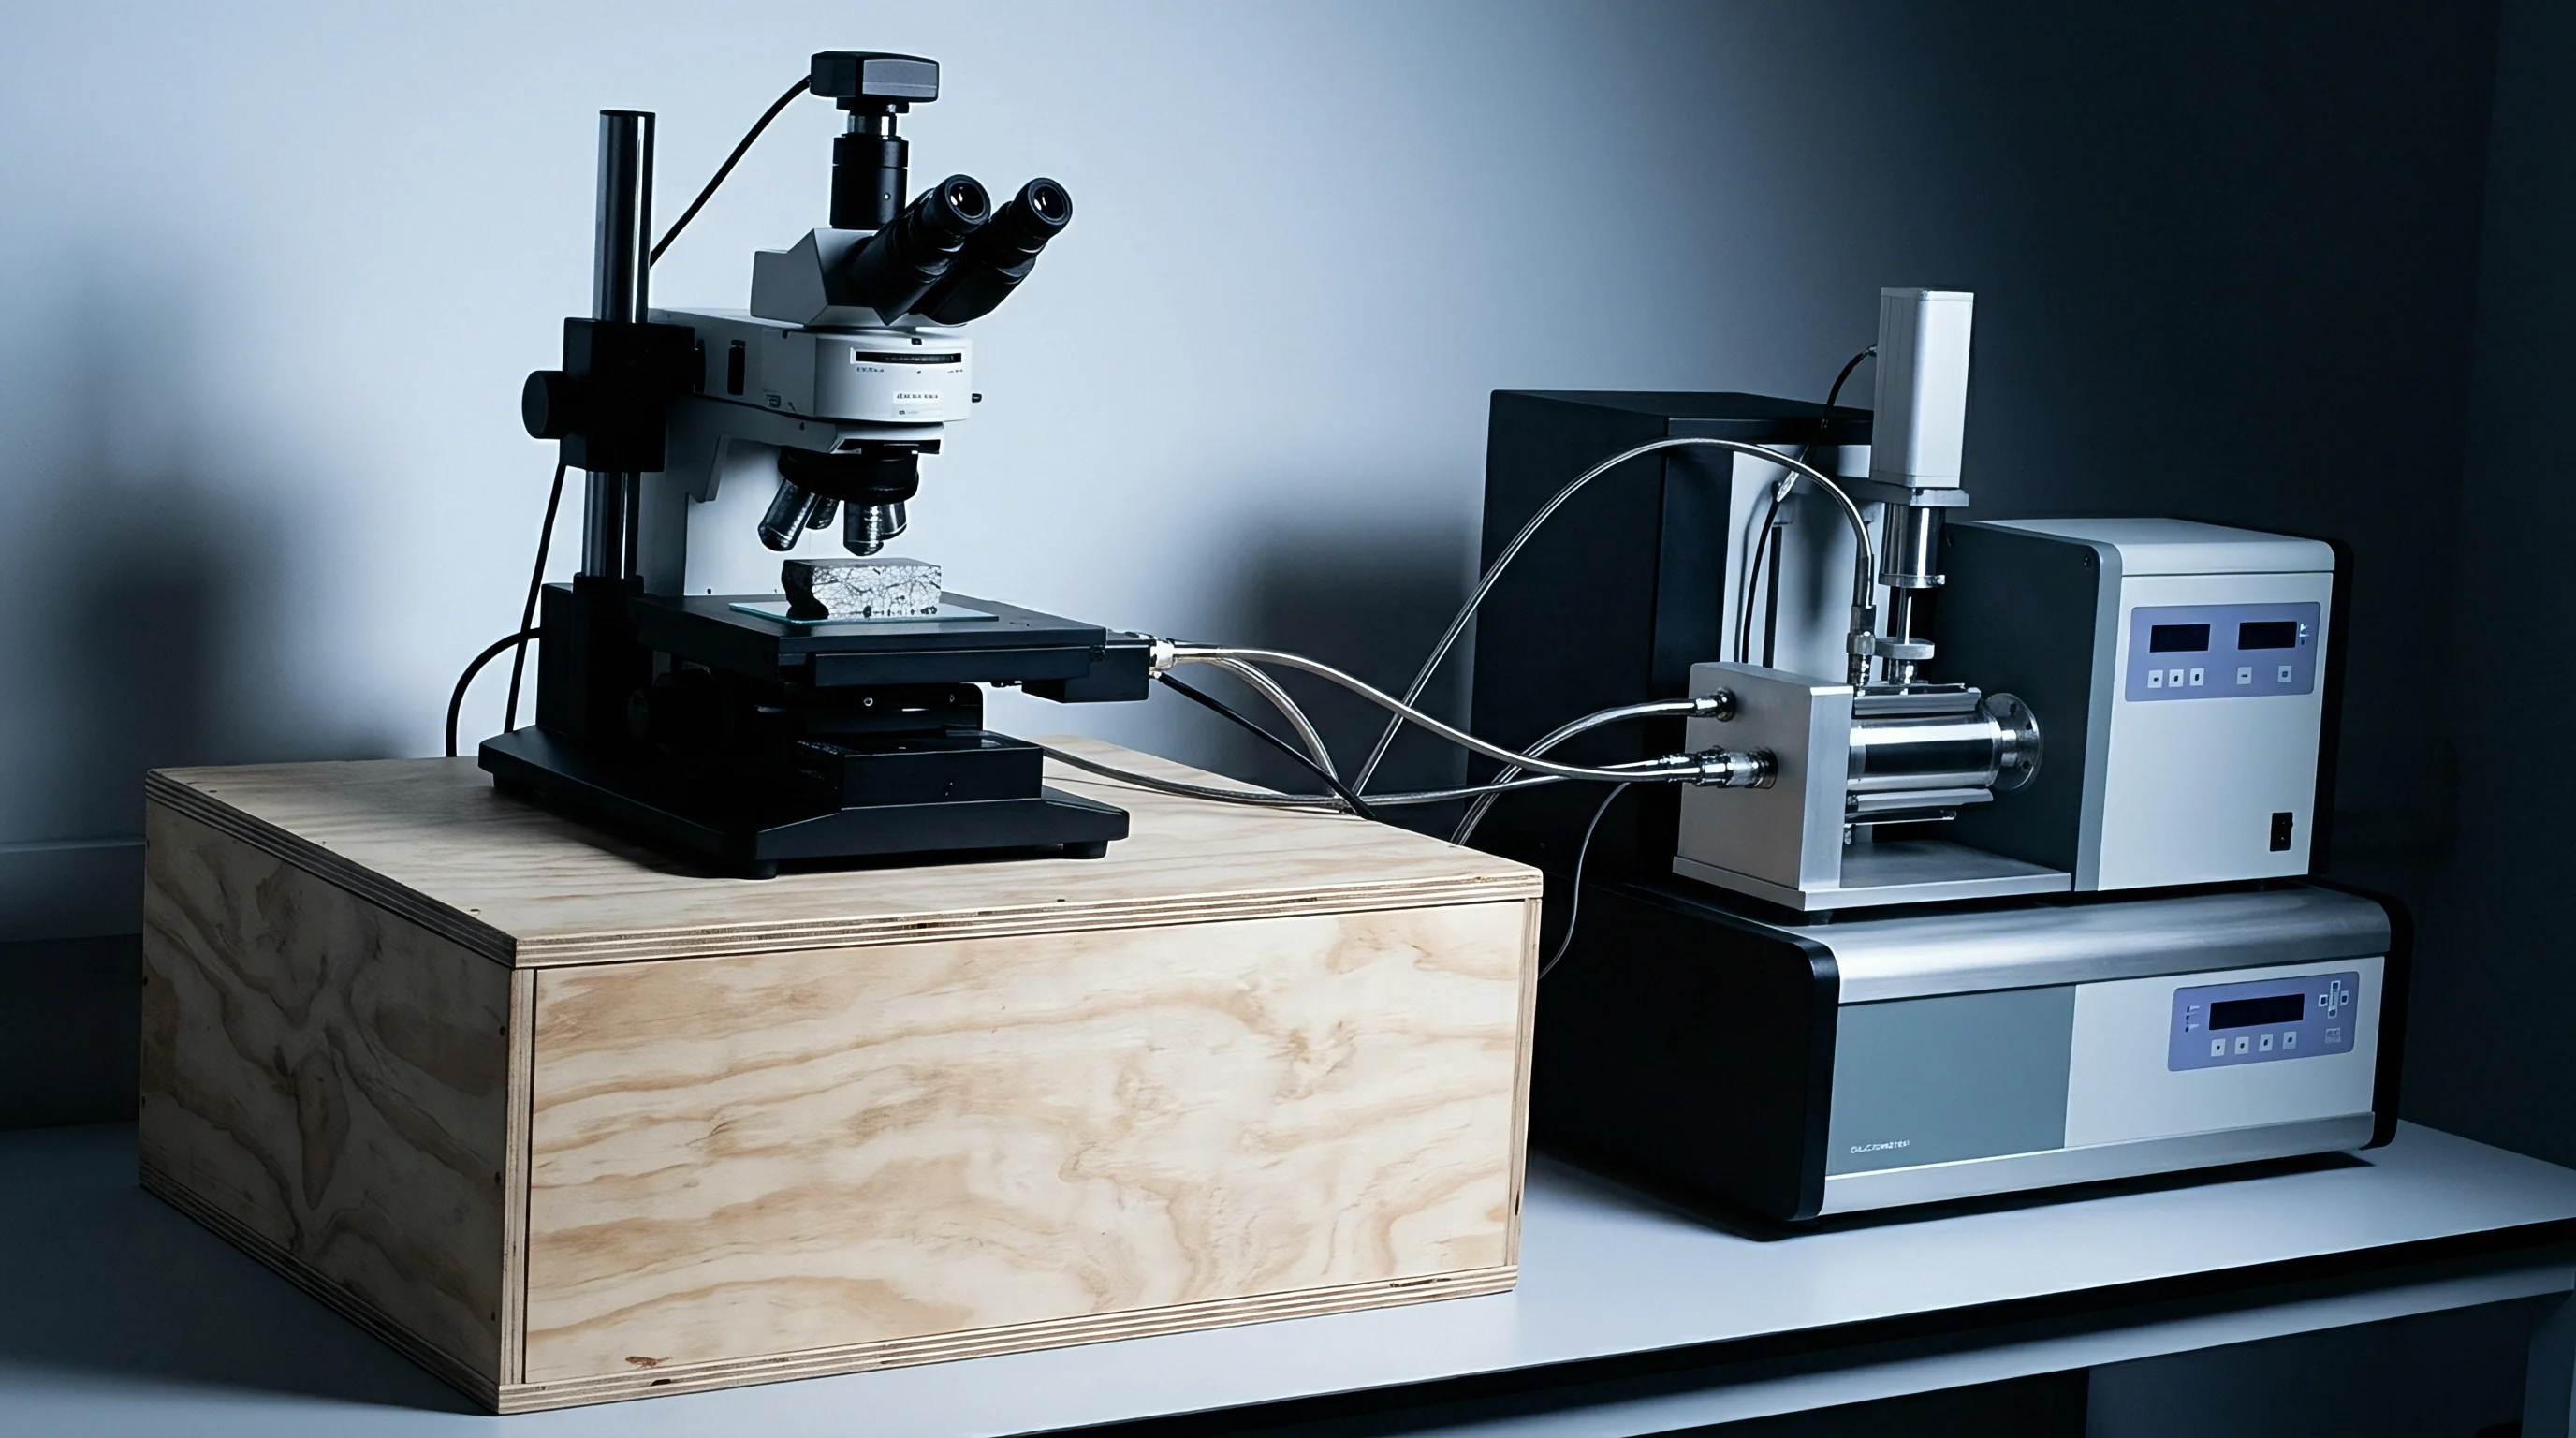
Destructive teardowns on post-test units highlight internal stress concentration areas. Computed tomography (CT) scans allow engineers to inspect jelly-roll alignment, pouch tab clearances, and potting integrity without disturbing physical evidence. Tracking minor shifts in contact impedance also offers an early indicator of joint degradation long before complete mechanical separation occurs.