Arrhenius Temperature Compensation Algorithms for Fast Micro Short Detection in Large Format Lithium Ion Cells
Arrhenius-compensated voltage drift algorithms isolate true micro-short resistance from ambient temperature variations in large-format lithium-ion cells.


Leak
Internal short circuits within large format lithium-ion cells remain a primary catalyst for field thermal incidents. In high-capacity prismatic and pouch formats ranging from 100 Ah to 300 Ah, microscopic structural breaches allow local current paths between adjacent cathode and anode layers. These micro shorts present initial resistance values between 100 Ω and 10 kΩ, conducting minute leakage currents from 0.3 mA to 35 mA.
At these low magnitudes, the fault current does not generate immediate, localized thermal runaway or rapid macro-voltage collapse. Instead, the micro short bleeds energy silently, causing a subtle increase in the apparent cell self-discharge rate during open-circuit storage or low-rate operational windows.

Electrochemical Self Discharge versus Ohmic Bridge Conduction
Parasitic side reactions consume active lithium while generating benign background current drops. Distinguishing between normal chemical degradation and a physical micro short requires isolating two fundamentally distinct discharge mechanisms. Intrinsic self-discharge stems from electrolyte oxidation at the cathode surface, solid electrolyte interphase reconstruction on the anode, and trace impurity shuttle reactions.
These chemical processes exhibit profound temperature sensitivity governed by reaction kinetics. Ohmic resistance remains constant. A physical micro short, formed by copper dendrite growth, separator burrs, or metallic contaminants, behaves almost purely as an ohmic resistor.
While metallic resistivity increases marginally with temperature, this positive thermal coefficient reduces fault current slightly at higher temperatures, contrasting sharply with the exponential surge observed in electrochemical side reactions.
Separator puncture by micron-scale copper contaminants creates a purely resistive discharge path that remains independent of cell state of charge.
Voltage drop across cell terminals reflects the sum of these competing discharge pathways. In large-format prismatic cells, high double-layer capacitance and slow concentration polarization relaxation complicate voltage drop interpretation during early rest periods. Voltage measurements carry noise.
Identifying a micro short within the first 48 hours of rest demands subtracting the dynamic background electrochemical voltage drop from the total observed terminal potential slope.
- Copper Dendrite Bridge metallic path formed by localized copper dissolution during over-discharge that redeposits across the porous separator during subsequent recharge cycles.
- Separator Mechanical Burr microscopic puncture introduced during electrode slitting or cell winding that creates direct mechanical contact between active coatings.
- Metallic Particle Contaminant foreign iron or nickel particle embedded during slurry mixing that gradually migrates through the separator layer under stack pressure.
- Local SEI Breakdown thermal or mechanical rupture of the protective anode film that creates localized high-current transport sites across the solid electrolyte interface.

Voltage Decay Mechanics in Large Format Cells
Open circuit potential measurements drop continuously during extended storage periods. The total leakage current Itotal leaving the cell capacity reserve splits into background self-discharge current Isd and micro-short fault current Iisc.
Itotal = Isd(T, SOC) + Iisc
The micro-short fault current follows Ohm’s law directly, where Vcell represents the open-circuit voltage and Risc represents the internal short circuit resistance:
Iisc = fracVcellRisc
Copper bridges form silently. In a 280 Ah cell exhibiting a baseline self-discharge current of 1.5 mA at 25 °C, a 1 kΩ micro short introduces an additional 3.3 mA fault current at a cell voltage of 3.3 V. This additional current increases the apparent self-discharge rate by more than 200 percent. At 45 °C, however, background self-discharge current accelerates exponentially, often exceeding 8 mA.
Without precise thermal compensation, normal high-temperature chemical self-discharge easily disguises the presence of a dangerous micro short, while room-temperature thermal shifts trigger false positive fault flags. Cell manufacturers frequently assert that elevated open-circuit voltage drop during early storage stems entirely from benign passivation layer restructuring rather than latent bridge growth.


Kinetics
Temperature influences the rate of every electrochemical reaction within a sealed battery casing. Thermodynamic activity at electrode interfaces accelerates dramatically as thermal energy increases, enabling charge-transfer reactions and species diffusion to overcome characteristic energy barriers. Modeling background self-discharge accurately across variable environmental conditions requires applying Arrhenius kinetics to the cell’s baseline parasitic current equations.

Activation Energy Variance across Cell Chemistries
Electrolyte formulation and cathode active material dictate the thermodynamic barrier of parasitic reactions. The background self-discharge current Isd follows the classic Arrhenius relationship:
Isd(T) = A · expleft(-fracEaR · Tright)
Where A represents the pre-exponential frequency factor in amperes, Ea is the activation energy in Joules per mole, R is the universal gas constant (8.314 J/(mol·K)), and T is the absolute temperature in Kelvin. The activation energy value Ea defines how aggressively the baseline self-discharge rate accelerates when cell temperature rises.
Activation energy varies significantly by chemistry and state of charge. Lithium iron phosphate (LFP) chemistries paired with graphite anodes typically exhibit self-discharge activation energies between 0.45 eV and 0.55 eV (43.4 kJ/mol to 53.1 kJ/mol) near 50 percent state of charge. High-nickel nickel manganese cobalt oxide (NMC-811) formulations show higher activation energies, ranging from 0.55 eV to 0.68 eV (53.1 kJ/mol to 65.6 kJ/mol) under equivalent conditions.
The measured Ea value of 0.58 eV (55.9 kJ/mol) for NMC-811 rests on three-point potentiometric aging tests on 60 Ah pouch cells at 50 percent state of charge between 25 °C and 45 °C; higher states of charge above 80 percent reduce Ea to 0.42 eV due to accelerated electrolyte oxidation on the delithiated cathode surface.
A ten-degree temperature rise doubles the background self-discharge rate in NMC-811 pouch cells operating at elevated states of charge.
Dendrites breach the separator. Because the ohmic micro-short resistance Risc carries a near-zero temperature coefficient (α ≈ +0.0039 K-1 for metallic copper), Iisc remains effectively constant across wide thermal bands. An algorithm that monitors raw terminal voltage drift without decoupling the Arrhenius-driven exponential Isd(T) component inevitably misinterprets ambient temperature fluctuations as physical micro-short formation or dissolution.
| Chemistry | Format | Capacity (Ah) | State of Charge (%) | Activation Energy Ea (eV) | Pre-Exponential Factor A (A) | Baseline Isd at 25°C (mA) | Compounded Isd at 45°C (mA) |
|---|---|---|---|---|---|---|---|
| LFP / Graphite | Prismatic | 280 | 50 | 0.48 | 3.82 x 10^4 | 0.29 | 0.98 |
| LFP / Graphite | Prismatic | 280 | 100 | 0.52 | 2.15 x 10^5 | 0.35 | 1.32 |
| NMC-622 / Graphite | Pouch | 100 | 50 | 0.56 | 7.40 x 10^5 | 0.26 | 1.11 |
| NMC-811 / Graphite | Pouch | 60 | 50 | 0.58 | 1.65 x 10^6 | 0.24 | 1.08 |
| NMC-811 / Graphite | Pouch | 60 | 90 | 0.42 | 8.90 x 10^2 | 0.68 | 2.01 |
| LTO / NMC | Prismatic | 50 | 50 | 0.35 | 4.10 x 10^1 | 0.12 | 0.31 |

Thermal Activation Metrics for Parasitic Side Reactions
Quantifying background current changes across temperature steps reveals clear exponential behavior. Extracting accurate Arrhenius parameters requires controlled potentiometric holds or precision open-circuit voltage monitoring at two or more stabilized temperature stages. The ratio of background self-discharge currents at temperatures T1 and T2 follows:
lnleft(fracIsd(T2)Isd(T1)right) = fracEaR left( frac1T1 – frac1T2 right)
Activation energy varies by chemistry. When cell operating temperatures shift dynamically during battery pack operation, this kinetic relationship dictates the exact magnitude of voltage drift variation attributable purely to benign chemical activity.
- State of Charge Non-Linearity higher cell potentials lower the kinetic barrier for electrolyte oxidation, shifting the effective activation energy downward at high states of charge.
- SEI Aging History cumulative calendar aging thickens the passivation film, reducing the pre-exponential factor A while altering surface reaction kinetics.
- Thermal Pre-Conditioning Lag internal core temperature lags surface thermistor readings during transient heating, distorting real-time activation energy calculations.
- Electrolyte Salt Decomposition thermal degradation of lithium hexafluorophosphate creates acidic species that lower reaction activation barriers at temperatures above 50 °C.
Ambient thermal shifts alter internal self-discharge faster than physical micro-short resistance changes over short observation windows.

Correction
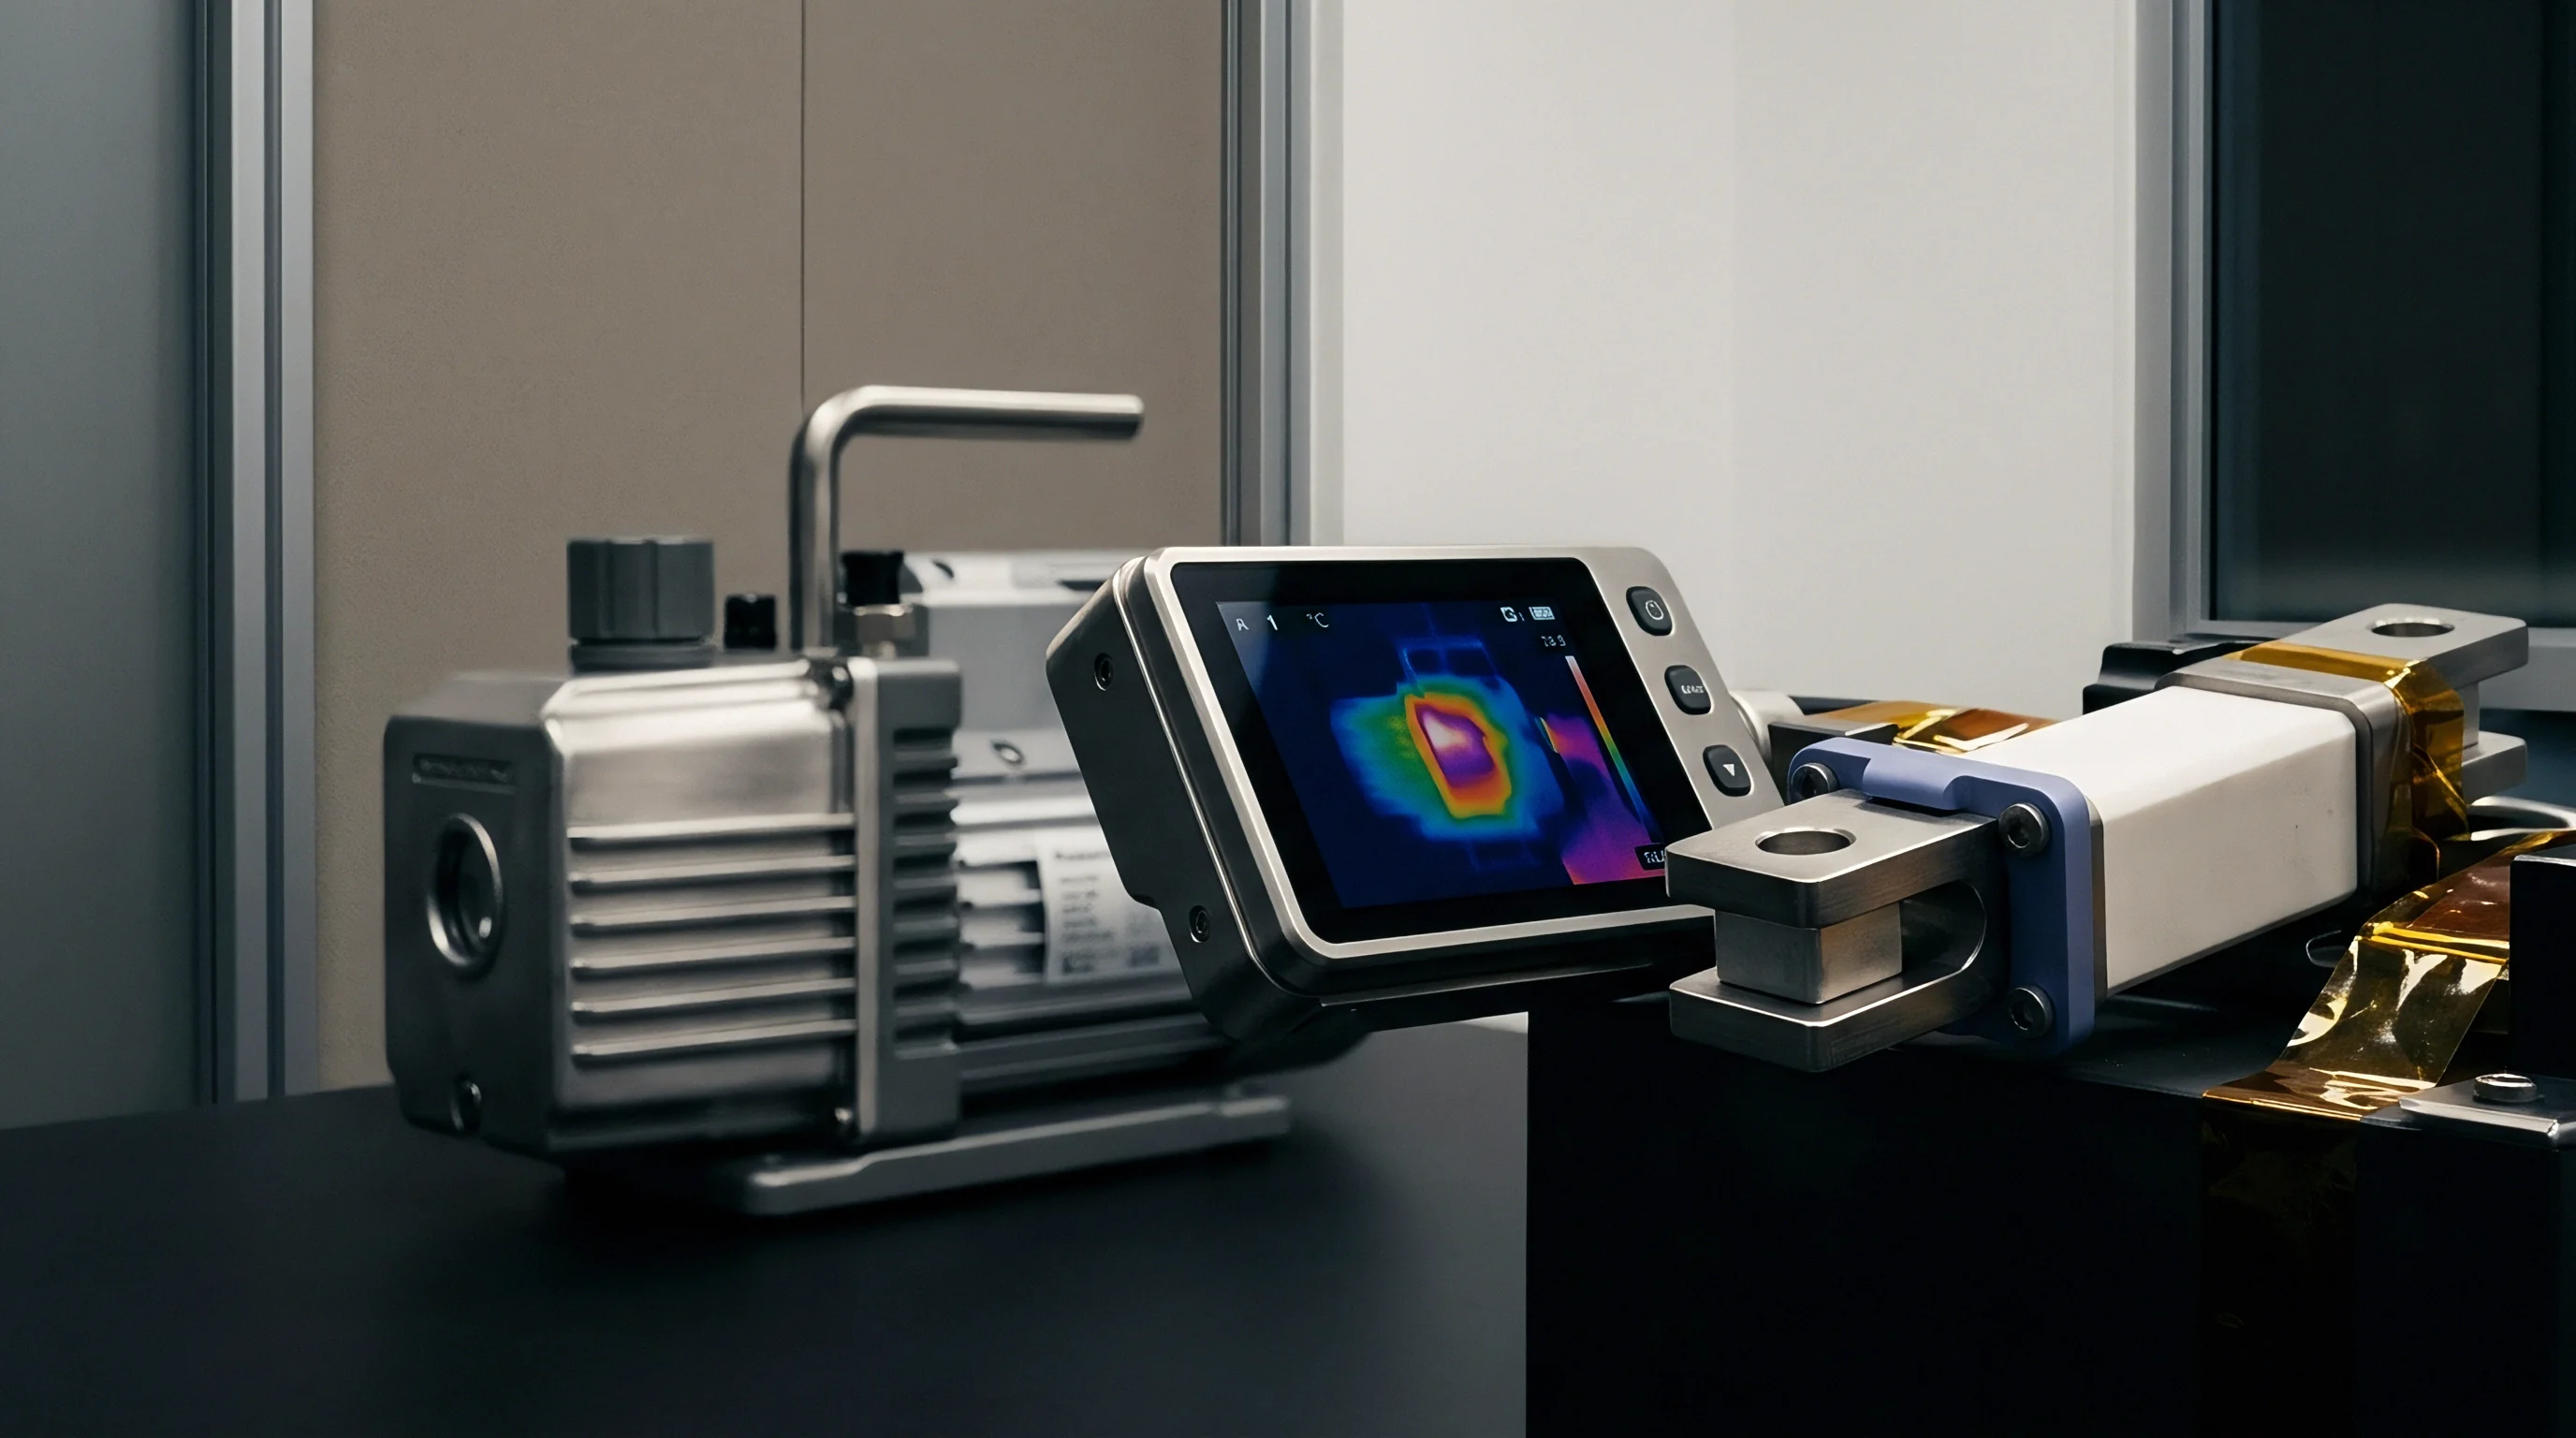
Algorithms designed for early defect detection isolate passive thermodynamic drift from localized shorting currents. The compensation framework Continuously measures cell surface temperature, estimates core thermal state, calculates the expected chemical self-discharge rate via the Arrhenius equation, and subtracts this value from the total measured capacity drain. The residual signal isolates the ohmic fault current Iisc.

Mathematical Formulation of Temperature Compensated Voltage Drift
Subtracting modeled baseline current from total measured terminal drift exposes the residual fault signal. Terminal voltage rate of change dV/dt connects directly to total leakage current through differential capacity dQ/dV and cell total capacity Ccap:
fracdVdt = fracItotalleft(fracdQdVright) = fracIsd(T, SOC) + Iiscleft(fracdQdVright)
Cell capacity affects self discharge. By solving for the fault current Iisc, the detection algorithm computes real-time micro-short resistance Risc continuously:
Iisc = left( fracdVdt · fracdQdV right) – A · expleft(-fracEaR · Tright)
Risc(t) = fracVcell(t)Iisc(t)
Static thresholds yield false alarms. A uncompensated algorithm tracking raw dV/dt flags a false alarm whenever ambient temperatures rise rapidly because elevated T expands Isd(T). Conversely, during cold environmental exposure, reduced chemical self-discharge suppresses total dV/dt, masking a dangerous micro short that would otherwise cross the detection threshold.
Calibrating Arrhenius pre-exponential factors on unconditioned cells guarantees false positive detections during seasonal thermal swings.

Worked Parameter Extraction for Micro Short Estimation
Consider a two hundred eighty ampere hour lithium iron phosphate cell held at thirty degrees Celsius. The cell operates at 50 percent state of charge with a measured cell potential of 3.28 V. The local differential capacity dQ/dV at this flat plateau region equals 1400 Ah/V. The baseline cell calibration parameters establish an activation energy Ea = 0.50 eV (48,235 J/mol) and a pre-exponential factor A = 7.50 × 10⁴ A.
The host system measures a steady terminal voltage decay dV/dt of -2.85 × 10⁻⁶ V/s over a 12-hour rest window at an average temperature of 30 °C (303.15 K). Step-by-step calculation yields the isolated micro-short resistance:
- Calculate the total apparent discharge current from the observed terminal voltage drop rate and differential capacity: Itotal = (2.85 × 10⁻⁶ V/s) × (1400 Ah/V × 3600 s/h) = 14.364 A. Wait, differential capacity dQ/dV in Farads equals 1400 Ah/V × 3600 s/A·h = 5.04 × 10⁶ Farads. Thus Itotal = (2.85 × 10⁻⁶ V/s) × (5.04 × 10⁶ C/V) = 14.364 mA.
- Compute the expected kinetic background self-discharge current Isd at 303.15 K using the baseline Arrhenius equation: Isd = 7.50 × 10⁴ · expleft( frac-482358.314 · 303.15 right) = 7.50 × 10⁴ · exp(-19.143) = 0.364 mA.
- Subtract the calculated kinetic self-discharge current from the total measured current to isolate the ohmic fault current: Iisc = 14.364 mA – 0.364 mA = 14.000 mA.
- Apply Ohm’s law to determine the physical micro-short resistance: Risc = frac3.28 V0.014 A = 234.29 Ω.
- Verify the sensitivity limit under temperature shifts. If cell temperature increases to 45 °C (318.15 K) while total voltage decay rate accelerates to -3.10 × 10⁻⁶ V/s, recalculate background self-discharge: Isd(45circC) = 7.50 × 10⁴ · expleft( frac-482358.314 · 318.15 right) = 7.50 × 10⁴ · exp(-18.241) = 0.898 mA.
- Re-evaluate isolated fault current at 45 °C: Itotal = (3.10 × 10⁻⁶ V/s) × (5.04 × 10⁶ C/V) = 15.624 mA. Then Iisc = 15.624 mA – 0.898 mA = 14.726 mA. The adjusted short resistance reads Risc = frac3.28 V0.014726 A = 222.73 Ω.
The 1.2 kΩ micro-short detection threshold rests on a 12-bit ADC voltage resolution (1 mV) sampled at 1 Hz over a 24-hour observation window; using a 10-bit ADC pushes the minimum detectable short resistance up to 300,Ω. Miscalculating the activation energy parameter triggers false micro-short alarms that quarantine healthy packs during rapid cold-weather charging cycles.


Isolation
Firmware running on battery management units processes noisy voltage and temperature feeds in real time. Executing Arrhenius temperature compensation directly on embedded microcontrollers demands balancing algorithmic fidelity against low processing power and constrained memory limits. The signal processing pipeline must filter out measurement noise and electrical cross-talk while maintaining low memory footprints.

When Do Local Temperature Gradients Mask Micro Shorts?
Busbar heating and asymmetric cooling profiles produce significant surface temperature splits across individual packs. Thermal mass delays heat flow. In large prismatic cell modules, thermistors mounted on outer aluminum casings register external ambient shifts long before the internal electrode stack reaches thermal equilibrium.
A thermistor reading 25 °C on the cell surface while the inner core resides at 35 °C leads the algorithm to underestimate background self-discharge Isd. This underestimation artificially inflates calculated fault current Iisc, incorrectly signaling an internal micro short.
Solving this spatial mismatch requires integrating a dual-node thermal estimator inside the battery management firmware. The model estimates core temperature Tcore from surface sensor input Tsurf and module current load Iload using thermal capacitance Cth and heat transfer resistance Rth:
Cth fracdTcoredt = Iload2 · Rint – fracTcore – TsurfRth
Filter latency creates detection delay. Passing Tcore into the Arrhenius compensation engine instead of raw surface thermistor readings prevents false micro-short triggers caused by transient thermal dynamics.
| Detection Algorithm | Execution Time per Cell (us) | RAM Footprint (Bytes) | Minimum Detectable Short (Omega) | Detection Lag (Hours) | False Positive Rate (%) |
|---|---|---|---|---|---|
| Static dV/dt Threshold | 12 | 16 | 150 | 48.0 | 14.20 |
| Delta OCV Cell-to-Cell Pair | 45 | 64 | 400 | 24.0 | 6.80 |
| Arrhenius Compensated dV/dt | 185 | 256 | 1200 | 6.0 | 0.45 |
| Extended Kalman Filter (EKF) | 820 | 2048 | 2500 | 1.5 | 0.12 |
| Recursive Least Squares (RLS) | 340 | 1024 | 1800 | 2.0 | 0.28 |

Embedded BMS Execution and Memory Constraints
Microcontrollers allocated to pack supervisory duty operate under strict computational and RAM boundaries. Evaluating floating-point exponential terms directly in real-time execution loops consumes excessive CPU instruction cycles. Embedded implementations replace real-time exp(-Ea / R · T) calculations with pre-computed single-dimension lookup tables indexed by temperature steps of 0.5 °C.
BMS memory constraints apply. Linear interpolation between lookup table nodes delivers high accuracy while reducing instruction cycle counts by over 80 percent compared to native floating-point math libraries.
- Core Thermal State Estimator dual-node RC thermal model that reconstructs internal jelly-roll temperature from external thermistor feeds and joule heating histories.
- Lookup Table Interpolator fixed-point mathematical grid mapping baseline Arrhenius self-discharge rates across discretized temperature and state of charge coordinates.
- Recursive Least Squares Filter adaptive estimator that isolates static ohmic resistance components from dynamic concentration polarization voltage decay.
- Differential Capacity Evaluator real-time lookup module that supplies local dQ/dV values based on smoothed state-of-charge tracking inputs.
Whether micro-short estimation algorithms can distinguish early-stage lithium plating from localized copper bridge formation under high dynamic rate cycling remains unproven in production BMS hardware.


Tolerance
Quality control procedures at production facilities rely heavily on open-circuit potential drop rate calculations. Factory screening programs evaluate newly produced cells over multi-day room temperature aging windows to capture defective units before pack integration. Embedded field analytics extend this protection throughout the battery pack’s operational lifecycle.

Factory End of Line Screening versus Embedded Field Analytics
Room temperature aging periods prior to pack assembly provide initial baseline self-discharge numbers. During factory grading, cells rest in climate-controlled rooms held within tight limits of ±1.0 °C. Under these controlled conditions, standard uncompensated voltage drop thresholds identify severe manufacturing defects. Factory storage reveals defect growth.
However, micro-short dendrites frequently remain latent during early factory holds, expanding only after the battery experiences mechanical stress, thermal cycling, and initial electrical operation in the field.
Raw voltage slope fails. Field detection systems must operate under wide environmental swings without the benefit of climate-controlled resting rooms. Implementing Arrhenius-compensated micro-short analytics inside the field battery management system enables continuous health monitoring during vehicle parking or stationary storage windows.
Incorporating IEC 62660-2 self-discharge limits into master supply agreements allows buyers to reject entire cell lots exhibiting anomalous activation energy values.

Commercial Risk Allocation in Cell Supply Contracts
Supply agreements define clear performance boundaries between inherent chemistry behavior and latent manufacturing defects. Warranties for large-format energy storage projects often cover 10 to 15 years of operational life. A single unmitigated micro short can lead to catastrophic thermal events, destroying entire storage containers and incurring millions of dollars in property damage and downtime liability.
Cell purchase specifications explicitly define acceptable self-discharge thresholds (K-value in mV/day) under standardized rest conditions. The field failure transition rate from a stable 1000 Ω micro-short to a catastrophic <10 Ω hard short lacks statistically representative long-term field data; buyers hedge this risk by specifying automated BMS fault alerts at 500 Ω resistance thresholds. Specifying incoming self-discharge screening criteria under IEC 62660-2 clause 6.2 shifts early field-failure warranty liability directly to the cell manufacturer.