Quantifying Lithium Inventory Losses during Extended Calendar Aging Protocols
Extended calendar aging consumes cyclable lithium through solid electrolyte growth, requiring differential capacity verification before warranty assignment.


Anode
Interphase growth at the negative electrode is the primary driver of capacity loss during unpowered storage in commercial lithium-ion cells. Cyclable lithium ions continuously passivate exposed graphite surfaces, permanently consuming inventory that would otherwise move during cycling. This process locks active lithium into immobile compounds such as lithium carbonate, lithium alkyl carbonates, and lithium fluoride.
Because graphite operates outside the electrochemical stability window of typical carbonate-based organic electrolytes, passivating film growth continues even with zero external current flowing.
Quantifying this inventory loss requires separating actual loss of cyclable lithium from structural damage to the host matrices. Active material loss at the negative electrode reduces total intercalation capacity, while active lithium loss leaves structural vacancies unfilled. During long calendar holds, active material loss stays minimal unless storage temperatures rise high enough to break down binders or dissolve the copper current collector.
Secondary reactions, like transition metal dissolution at the cathode and subsequent migration across the separator, speed up film growth. Dissolved manganese or nickel ions settle on graphite surfaces, breaking down the protective layer and exposing fresh carbon to chemical attack.
| Cell Chemistry | Dominant Aging Kinetic | Primary Failure Indicator | Typical LLI Rate at 25°C / 100% SoC | UN 38.3 Re-Test Trigger Condition |
|---|---|---|---|---|
| LFP / Graphite | Parabolic SEI Growth | Voltage Plateau Compression | 1.2% to 1.8% per year | Capacity drop exceeding 20% from design type |
| NMC-811 / Graphite | Linear / Transition Metal Dissolution | Gas Generation & Impedance Rise | 2.5% to 4.1% per year | Gas swelling exceeding 10% volume increase |
| NMC-622 / Silicon-Graphite | Non-Linear Particle Cracking | DVA Peak Shift & DCR Elevation | 4.5% to 7.0% per year | Impedance growth doubling nominal DC resistance |
| LTO / NMC | Interphase Film Dissolution | Self-Discharge Current Elevation | 0.3% to 0.6% per year | Open circuit voltage decay exceeding safety threshold |
Electrolyte formulation directly alters passivation rates. Additives like vinylene carbonate and fluoroethylene carbonate form sacrificial interlayers that slow down solvent decomposition, though they break down during prolonged storage. High temperatures exhaust these protective additives prematurely.
Manufacturers often run calendar aging tests at elevated temperatures to compress timelines from years to weeks, but simple thermal acceleration distorts the underlying chemistry by triggering high-activation-energy parasitic reactions that do not occur at room temperature.
The dissolution of transition metals accelerates passivating layer growth on graphite anodes, consuming active inventory without structural electrode damage.
Isolating these loss mechanisms requires targeted low-rate electrochemical diagnostics before and after calendar holds. Static open-circuit voltage measurements show self-discharge rates, but cannot distinguish reversible charge leakage from permanent chemical depletion. Unpackaged cells in extended aging protocols can develop internal strain, causing localized contact loss that looks like inventory depletion on automated test channels.
Failing to separate true lithium loss from temporary voltage relaxation risks premature pack rejection or invalid warranty disputes with suppliers.

Decay
Low-rate galvanostatic cycling isolates thermodynamic loss from transport-related voltage drops. Sweeping a cell at rates between C/50 and C/100 minimizes ohmic overpotential, producing voltage curves that reflect equilibrium phase transitions. Differentiating these low-rate curves yields differential capacity spectra where specific peaks correspond to phase change boundaries in both electrodes.
As cyclable lithium depletes, these peak positions shift relative to the total state of charge, revealing inventory loss without damaging the cell.
Differential voltage analysis offers a complementary view by plotting dV/dQ against total discharge capacity. The distance between characteristic valleys on the differential voltage curve maps directly to the lithium inventory in specific crystallographic phases. Tracked across aging intervals, valley contraction measures inventory depletion, while declining peak height signals host material degradation.
Running these tests in temperature-controlled chambers set to 25°C prevents thermal drift from skewing peak locations.
- Signal Noise Artifacts ~ High-frequency electrical noise from current shunts distorts numerical derivatives, creating false peaks that hide actual thermodynamic phase transitions.
- Temperature Fluctuation Drift ~ Thermal shifts during long C/100 discharge cycles alter equilibrium potentials, making peak alignment unreliable across test points.
- Reference Electrode Potential Drift ~ Three-electrode setups using metallic lithium reference probes suffer continuous surface corrosion, introducing baseline voltage errors over multi-month runs.
- Self-Discharge Conflation ~ Reversible self-discharge masks permanent inventory loss unless cells undergo full reconditioning cycles before capacity extraction.
High-precision coulometry offers a faster quantitative route by measuring the difference between charge and discharge capacity during single slow cycles. Modern test systems measure coulometric efficiency to four decimal places, isolating parasitic side-reaction currents down to microamperes. An efficiency below unity confirms active inventory consumption through side reactions.
Combining coulometric data with parasitic current fitting allows engineers to model ten-year calendar loss profiles from a sixty-day test.
IEC 62133 certification demands capacity retention validation following storage, invalidating safety documentation if unpowered decay breaches threshold limits.
Fitting calendar aging data to empirical kinetic models often reveals non-parabolic behavior. Early storage typically follows time-square-root kinetics governed by diffusion-limited passivation growth. Extended holds tend to transition toward linear kinetics as passive layers become porous or dissolve into the electrolyte.
Initial rapid capacity loss often reflects normal SEI stabilization rather than an inherent cell defect, with clean high-rate cycle records confirming underlying electrode health.


Storage
State of charge during static storage sets the thermodynamic driving force for parasitic side reactions. Holding cells at 100% state of charge maximizes anode potential relative to metallic lithium, driving up solvent reduction at the negative interphase. High cathode potential simultaneously promotes oxygen evolution, transition metal dissolution, and binder breakdown.
Lowering storage state of charge to 30% reduces calendar degradation rates by up to two-thirds, making reduced charge levels essential for long-term storage and transport.

How Does Storage Temperature Distort Extrapolated Aging Rates?
Thermal acceleration uses the Arrhenius relationship to extrapolate short-term hot-storage data back to ambient conditions. The activation energy for passivation growth typically ranges between 0.4 eV and 0.6 eV across standard carbonate electrolytes. Relying on a single activation energy over wide temperature spans leads to significant prediction errors.
Above 45°C, degradation shifts from diffusion-limited passivation growth to interphase dissolution and structural cathode breakdown, rendering standard Arrhenius acceleration factors invalid.
Transport safety regulations tie cell compliance directly to capacity retention and physical condition after storage. Under UN 38.3 specifications, cells stored for long periods before international transport must maintain structural integrity without internal shorting. Section 38.3.4 requires that cells subjected to thermal testing and vibration show no mass loss, venting, or voltage drops below defined thresholds.
When extended calendar aging severely depletes lithium inventory, localized plating can occur during the first recharge attempt, forming micro-dendrites that risk puncturing the separator under transport vibration.
Storage at low charge states reduces chemical oxidation rates at electrode surfaces, extending shelf life without altering underlying crystal structure.
Documenting storage conditions requires continuous monitoring of environmental chambers. Temperature spikes during testing invalidate long-term aging datasets, creating gaps in compliance documentation that stall dangerous goods approvals. Shipments lacking continuous temperature logs risk customs impoundment or carrier refusal at ports and air terminals.
Whether standard non-destructive diagnostic protocols can reliably catch localized lithium plating caused by post-storage charging before cells enter transport remains an open question.

Margin
Translating laboratory aging data into product warranties requires clear capacity margin calculations. Sourcing decisions must weigh raw loss percentages against measurement uncertainty, cell-to-cell variance, and expected duty cycles. A cell batch showing 2% inventory loss per year under controlled 25°C storage can jump to a 6% annual loss inside an unconditioned warehouse with daily temperature swings.
Contracts that fail to define explicit storage temperature limits leave buyers holding the financial risk of lost shelf life.
Consider a grid storage order for a 100 MWh containerized battery system designed for a ten-year operational life with a 70% minimum end-of-life capacity margin. Nominal 25°C storage at 50% state of charge incurs roughly two percent annual lithium inventory loss. If customs delays and site integration hold the units for 18 months at an unconditioned location averaging 35°C, calendar loss climbs to 5.2% over that window.
That drops initial usable capacity by 7.8 MWh before the facility ever delivers power to the grid.
- Measure baseline discharge capacity using a C/20 galvanostatic protocol at 25°C to establish initial cyclable lithium inventory.
- Log cell open-circuit voltage and internal DC resistance within 48 hours of arrival at the storage facility.
- Place sample cells in calibrated climate chambers set to the target temperature and designated state of charge.
- Pull sample batches every 30 days to perform low-rate differential capacity sweeps and high-rate resistance tests.
- Calculate net inventory loss by subtracting structural capacity degradation derived from differential voltage valley positioning.
- Update project financial models to account for reduced starting capacity and accelerated degradation timelines.
| Standard / Regulation | Applicable Clause | Mandated Verification Protocol | Commercial & Safety Consequence |
|---|---|---|---|
| UN 38.3 | Section 38.3.2.2 | Re-testing required if cell design or state changes by >0.1g or 20% capacity | Loss of transport authorization for air or sea cargo |
| IEC 62133-2 | Clause 7.3.7 | Capacity retention test after 28-day storage at 20°C | Invalidation of CB scheme safety certificate |
| EU Battery Regulation | Article 10 / Annex VII | State of Health (SoH) parameter monitoring for stationary storage | Inability to clear EU customs without digital battery passport sync |
| IATA DG Regulations | PI 965 Section IA | State of Charge capped at 30% for passenger/cargo transport | Immediate rejection at air cargo acceptance desk |
Air transport regulations impose strict operational limits on stored cells. IATA Packing Instruction 965 mandates that standalone lithium-ion cells ship at a state of charge no higher than 30% of rated capacity. While low charge states lower thermal runaway risks during flight, they increase the need to monitor self-discharge.
If a cell stored at 30% state of charge suffers excessive calendar loss, its voltage can drop below the minimum cutoff, triggering copper current collector dissolution that permanently damages the cell.
Maintaining cell storage states below thirty percent capacity preserves dangerous goods compliance for air transport while suppressing parasitic chemical decay.
A useful rule of thumb for storage facility planning: every ten-degree Celsius drop in storage temperature cuts passive lithium consumption in half, down to the freezing point of the electrolyte.
Shelf
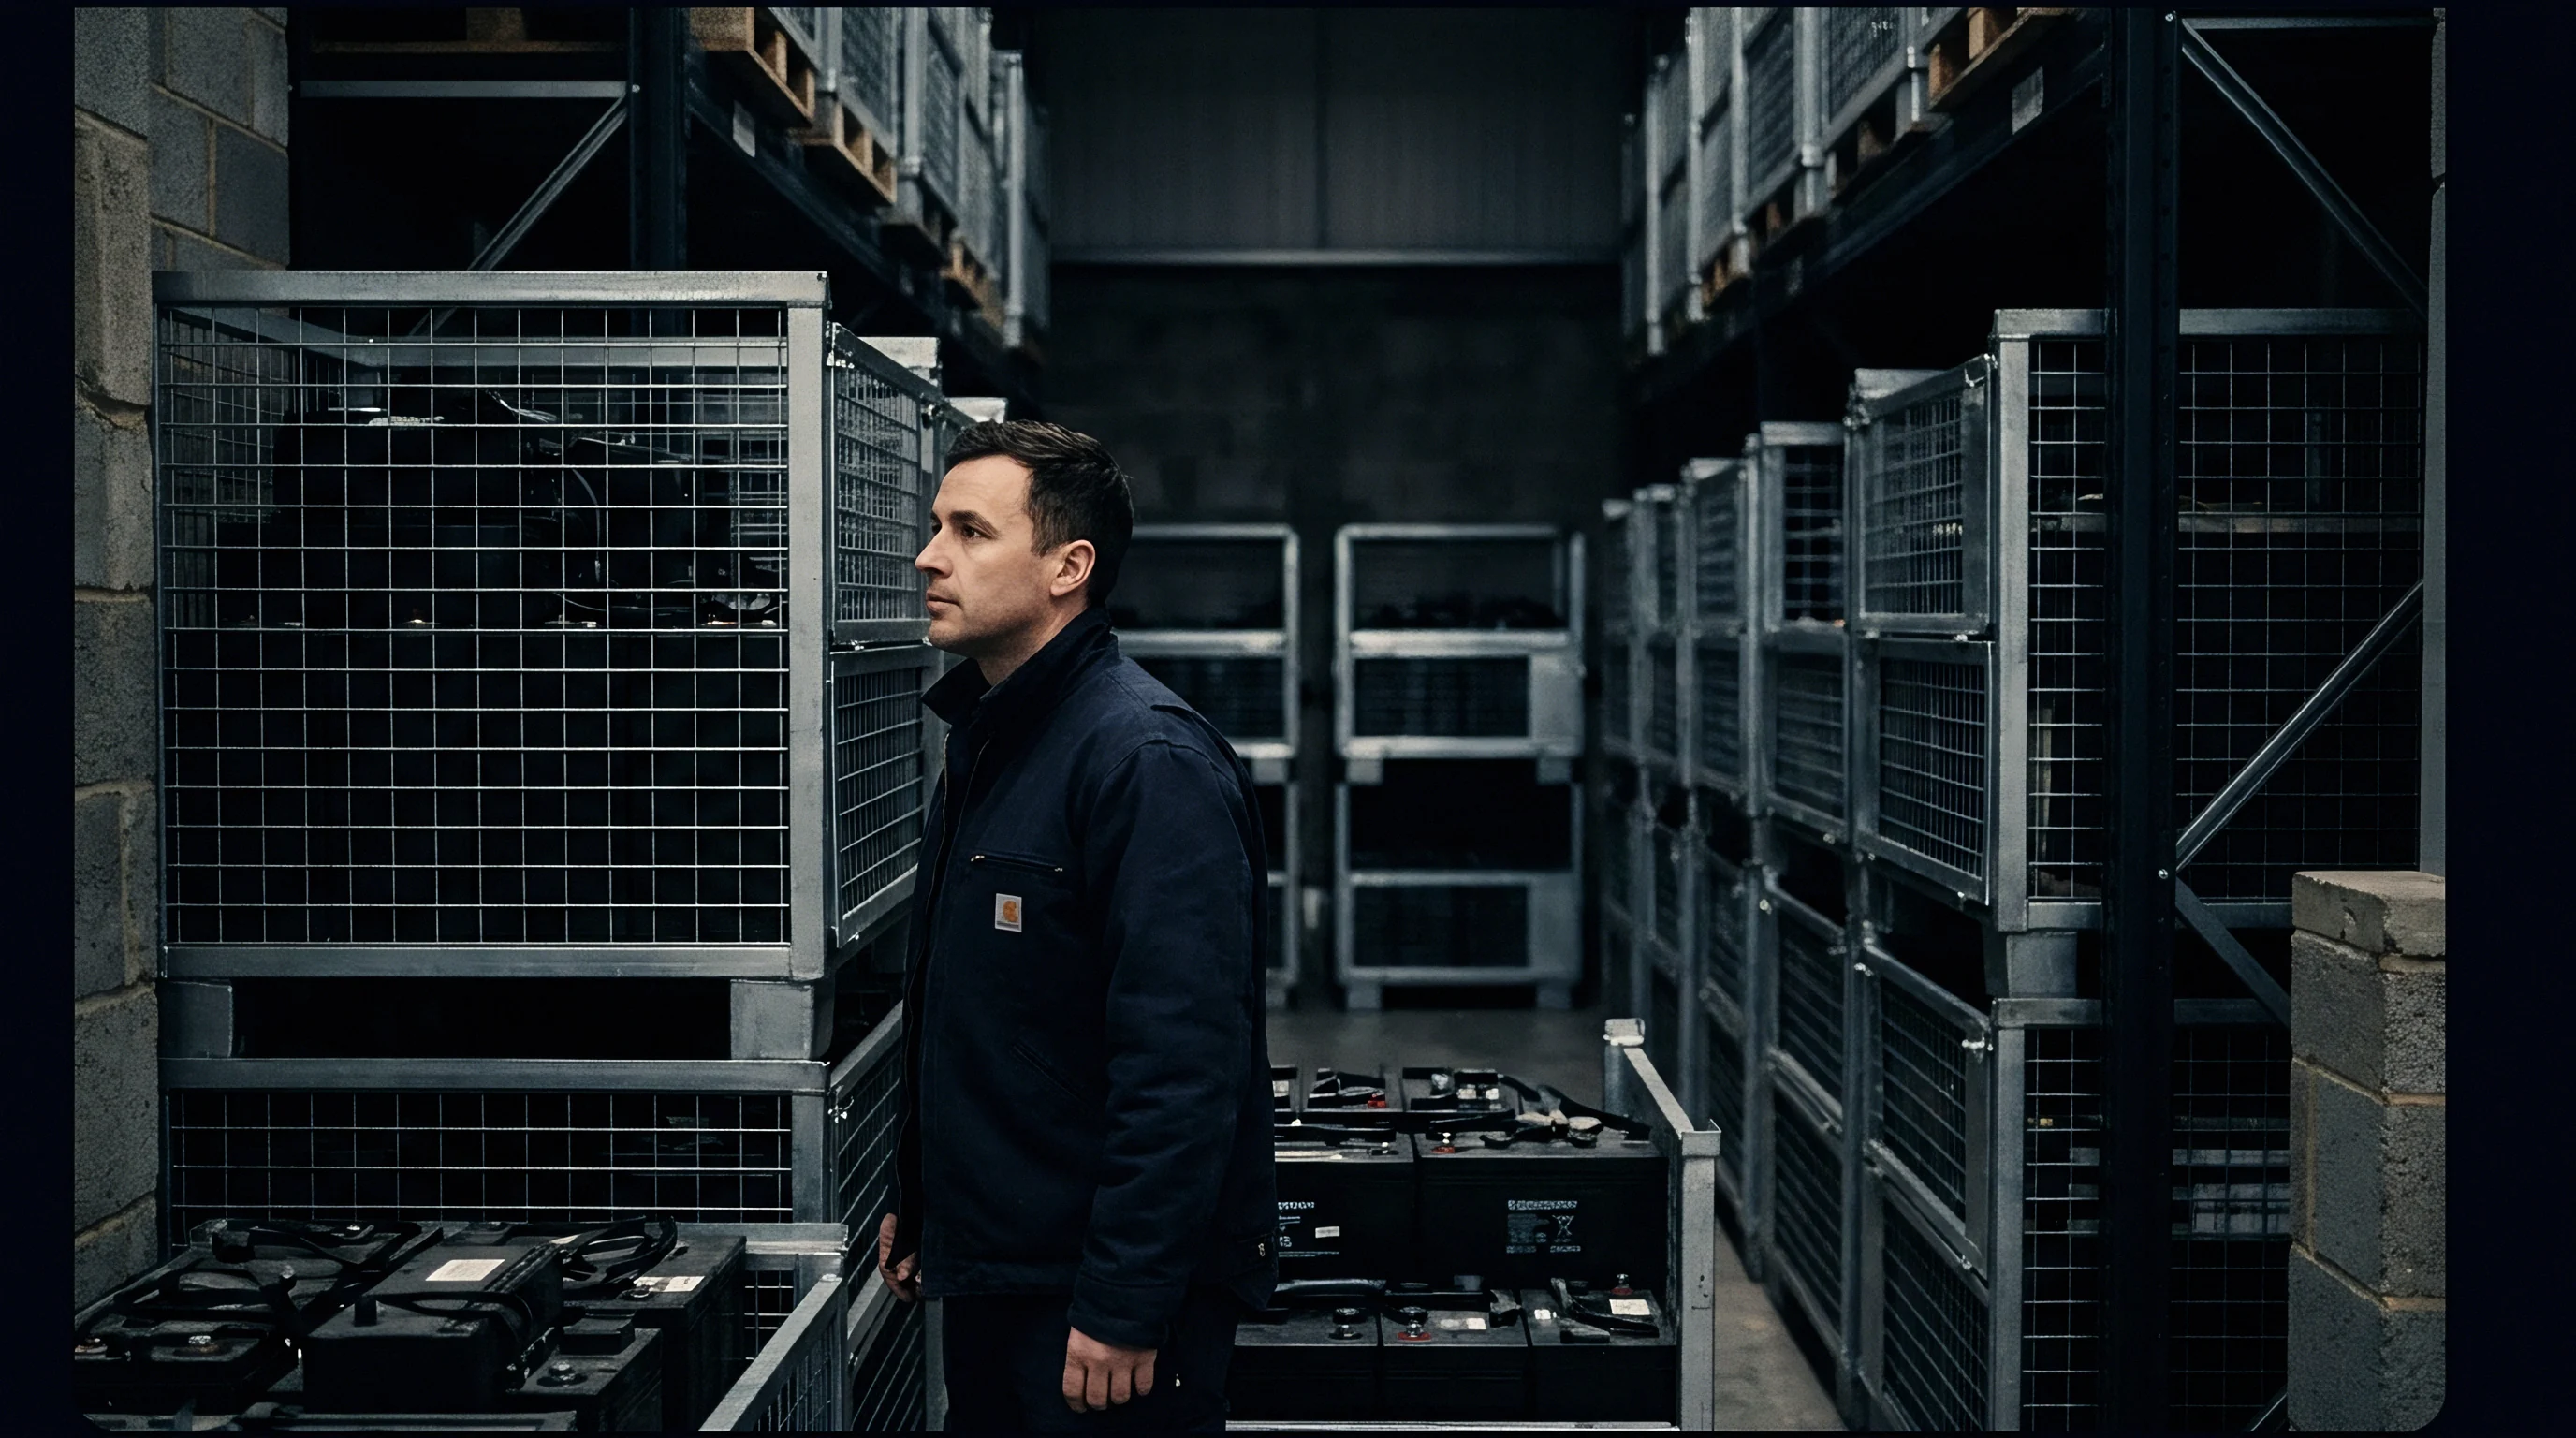
Cell supply contracts must establish clear liability boundaries for calendar degradation. Datasheets routinely guarantee 80% capacity retention after 3,000 cycles while saying little about background calendar loss during transit and warehousing. Procurement teams should include explicit calendar decay clauses in supply agreements, defining allowable capacity loss per month of pre-integration storage under specified ambient conditions.
Without these terms, buyers carry the financial risk for capacity lost between factory departure and pack assembly.
Incoming inspection serves as the primary filter against degraded cells. Receiving teams run high-throughput screening using open-circuit voltage drops and high-frequency AC impedance sweeps. Cells with abnormal K-values ~ the rate of self-discharge voltage drop over time ~ signal internal micro-shorts or heavy passive interphase growth.
Automated screening flags these units before module assembly, preventing cell-to-cell variance that can compromise an entire pack.
- Ambient Limits Clause ~ Sets temperature limits between 15°C and 25°C across all transit and warehousing stages.
- K-Value Acceptance Threshold ~ Rejects cell lots showing self-discharge rates above 0.5 mV per day over a two-week hold.
- Differential Capacity Audit Allowance ~ Allows the buyer to perform low-rate diagnostic teardowns on 0.1% of received lots to assess baseline inventory loss.
- Customs Delay Cost Sharing ~ Splits financial losses from capacity loss during regulatory holds between forwarder and importer.
- Warranty Reset Trigger ~ Resets commercial warranty start dates if pre-integration storage exceeds six months under certified conditions.
Digital battery passports under recent European regulations formalize state-of-health tracking across the supply chain. Article 10 of the EU Battery Regulation requires real-time access to key state-of-health metrics, including accumulated calendar degradation. Importers must upload certified storage logs into the passport registry before units clear customs.
Unmonitored storage without verifiable aging records can stall imports at the border.
Disputes over calendar aging usually turn on storage records. Capacity loss is often attributed to improper storage exceeding humidity or heat limits, while baseline interphase growth can also exceed expected curves even under controlled conditions. Resolving these conflicting positions requires third-party laboratory testing using low-rate capacity sweeps and differential voltage analysis before settling final payments.