Optimizing Multi Temperature Soak Profiles for Screening Internal Cell Defects
Optimizing multi-temperature soak profiles accelerates internal defect growth for precise microvolt screening while preserving cell cycle life.
Heat
Latent metallic contamination inside a lithium-ion cell alters local ionic conductances long before a hard short circuit manifests. Microscopic iron, copper, or nickel particles introduced during electrode slitting or tab welding breach separator membranes over operational cycles. Subjecting newly formed cells to elevated ambient environments accelerates the kinetic rate of electrochemical dissolution and dendrite growth.
Internal defects that take months to precipitate failure at room temperature mature within days when thermal energy lowers activation thresholds.
Defect growth accelerates under heat. Chemical reactions driving self-discharge follow Arrhenius kinetic models, where temperature increases elevate reaction velocity exponentially. The thermal coefficient for parasitic electrolyte oxidation differs significantly from that of metallic dendrite bridging.
While solid electrolyte interphase restructuring exhibits an activation energy around 0.6 to 0.8 electron-volts, copper dissolution and migration across damaged separator pores operates with activation energies between 0.35 and 0.5 electron-volts. Selecting an optimal soak temperature demands isolating target defect kinetic acceleration while suppressing overall parasitic cell aging.
A high-nickel pouch cell soaked at 45 °C for 72 hours under 100 percent state of charge exhibits a self-discharge rate 3.8 times higher than an identical cell held at 25 °C.
Nickel-manganese-cobalt formulations exhibit an elevated rate of self-discharge under thermal stress compared to lithium iron phosphate lattices. High-nickel cathodes release trace oxygen species at elevated temperatures when held at high states of charge, modifying the local chemical potential around internal shorts. Lithium iron phosphate cathodes retain high structural stability up to 60 °C, yet their extremely flat open-circuit voltage curves render voltage-decay defect detection far more complex.
Screening profiles must account for cathode-specific voltage-to-capacity slopes during thermal exposure.
| Defect Mode | Activation Energy (eV) | Acceleration Ratio (45 °C vs 25 °C) | Primary Diagnostic Signal | Thermal Upper Boundary |
|---|---|---|---|---|
| Metallic Contaminant Dissolution | 0.42 | 3.1x | Accelerated K-Value Decay | 50 °C |
| Separator Burr Soft Short | 0.38 | 2.8x | Microvolt Delta V Drop | 45 °C |
| Copper Dendrite Bridging | 0.48 | 3.5x | AC IR 1-kHz Shift | 50 °C |
| Parasitic SEI Thickening | 0.72 | 6.4x | Capacity Loss Penalty | 40 °C |
Temperature controls everything here. Setting screening temperatures above 50 °C triggers thermal degradation of the electrolyte solvent, generating gaseous side products that increase pouch thickness or distort cylindrical cell vent disks. Conversely, soaking cells below 35 °C fails to shorten factory screening duration sufficiently, tying up critical manufacturing floor space and cycling equipment capital.
Operating soak channels at 45 °C provides maximum defect acceleration while keeping thermal aging penalties within acceptable bounds.
Cell vendors frequently assert that elevated temperature aging accelerates natural capacity loss beyond commercial specification limits.

Step
Cell potential relaxation occurs at distinct rates following rapid temperature transitions. Applying a static elevated temperature throughout the burn-in period masks dynamic voltage recovery signals that identify soft short circuits. Multi-temperature profiles structure thermal exposure into sequential phases: an elevated temperature phase to stimulate physical defect growth, a cooling stabilization step to equalize thermal mass, and a controlled room-temperature measurement window.
Staging these thermal transitions isolates true self-discharge from transient electrochemical relaxation.
Voltage drops indicate internal leakage. State of charge selection dictates the electrostatic driving force across separator defects. Charging cells to 100 percent state of charge maximizes the electric field potential across internal gaps, promoting electron leakage through thin burrs or partial metallic bridges.
Lower states of charge reduce the thermodynamic force driving metal dissolution, extending the soak time needed to catch latent manufacturing defects.

Profile Staging for Dynamic Defect Exposure
Sequential thermal steps prevent thermal shock while sharpening diagnostic microvolt signals. The initial thermal phase ramps cell ambient to 45 °C within ninety minutes, maintaining that level for forty-eight hours to promote defect reaction kinetics. Lowering chamber temperatures back to 25 °C requires a controlled cooling gradient, avoiding rapid thermal contraction of cell casings that creates artificial open-circuit voltage noise.
The final twenty-four-hour room-temperature hold yields stable K-value measurements unaffected by internal thermal gradients.
What Thermal Profile Exposes Micro Shorts Safely?
A three-phase sequence combining elevated storage with stabilized measurement windows isolates internal resistance shifts without imposing excessive calendar aging. Soaking at 45 °C for 48 hours under full state of charge exposes physical separator pinholes. Stepping down to 35 °C for 12 hours stabilizes electrolyte viscosity, followed by a 25 °C measurement step for 24 hours.
This multi-step profile reduces overall testing time by 60 percent compared to standard 28-day room-temperature factory storage.
The following sequence outlines the standard factory multi-temperature screening execution:
- Charge incoming cell lots to 100 percent state of charge at 25 °C using a constant-current constant-voltage regime until current drops to 0.02C.
- Ramp soak chamber ambient temperature from 25 °C to 45 °C at a rate of 0.5 °C per minute to ensure uniform jellyroll heating.
- Maintain the 45 °C elevated soak environment for 48 consecutive hours under continuous open-circuit voltage monitoring.
- Transition chamber ambient down to 25 °C over a 4-hour linear cooling window to eliminate thermal gradient noise.
- Log cell potential across high-precision digital multimeters at hour 0, hour 12, and hour 24 of the final room-temperature hold phase.
Soak profiles consume cycle life. Balancing screening yield against virgin cell degradation requires selecting step durations that match cell thermal mass. Prismatic cells with thick aluminum casings demand longer thermal equalization periods than thin pouch formats.
Tailoring step durations to cell geometry prevents mischaracterizing slow thermal stabilization as electrical self-discharge leakage.
Thermal profiling catches active defects early when voltage decay measurements occur after cell temperatures stabilize completely across the entire casing.

Drift
Precision digital multimeters tracking cell potential resolve variations down to five microvolts to separate self-discharge anomalies from ambient measurement noise. Calculating the self-discharge coefficient, known on production floors as the K-value, requires measuring voltage drop over time, expressed as millivolts per day or microvolts per hour. Healthy lithium-ion cells demonstrate predictable, exponentially decaying K-values following formation.
Defective cells with active micro-shorts exhibit linear or expanding voltage decay rates during thermal soak steps.
Outliers face immediate lot rejection. K-value metrics calculated during elevated thermal soak steps show significantly higher variance between baseline cells and defect populations than measurements taken solely at room ambient. Soaking at 45 °C inflates baseline K-values by a factor of three, while amplifying micro-short self-discharge rates by ten or more.
This expanding signal-to-noise ratio brings defective cells outside the normal Gaussian distribution curve of the manufacturing lot.
Quantifying Microvolt Open Circuit Voltage Drops
High-resolution voltage data collection isolates chemical self-discharge from instrument drift. Measurement channels employ shielded, twisted-pair cabling connected to automated multiplexing switches housed within thermally stabilized meter enclosures. Taking initial baseline voltage readings immediately upon thermal step stabilization eliminates settling errors.
Tracking voltage decay across three discrete timestamps enables fitting a secondary polynomial equation that distinguishes harmless relaxation from continuous internal leakage currents.

Impedance Spectroscopy for Soft Short Identification
Alternating current resistance at one kilohertz shifts rapidly when conductive pathways form through separator pores. High-frequency impedance testing captures localized physical contact across electrodes prior to massive voltage drops. Combining high-resolution open-circuit voltage monitoring with post-soak AC IR measurements detects soft shorts that self-heal temporarily during thermal expansion.
Cells showing elevated 1-kHz AC IR shifts alongside abnormal K-values indicate structural separator damage.
| Parameter | Nominal Baseline (25 °C) | Screened Limit (45 °C Post-Soak) | Defect Specificity | Measurement Accuracy |
|---|---|---|---|---|
| K-Value (mV/day) | 0.15 – 0.35 | 1.20 | Micro-shorts / Impurities | ± 0.01 mV/day |
| AC IR Shift (1 kHz) | 8.0% change | Separator Compression | ± 0.05 mΩ | |
| DCIR Delta (10s pulse) | 12.0% change | Electrolyte Depletion | ± 0.10 mΩ | |
| Thickness Delta (Pouch) | 0.35 mm | Parasitic Gassing | ± 0.02 mm |
Self-discharge rates reveal soft shorts. Comparing voltage decay metrics captured at 45 °C against post-cooling 25 °C readings confirms whether self-discharge rates track thermal models. Cells exhibiting temperature-independent voltage decay carry hard conductive paths, such as direct foil burrs, that bypass normal electrochemical activation energies entirely.
Measuring self-discharge before thermal equilibration introduces false rejection errors driven by reversible open-circuit voltage recovery.
Engineers continue to debate whether ultra-low impedance shifts observed during early soak hours stem from transient solid electrolyte interphase restructuring or permanent separator damage.


Margin
Holding lithium-ion cells at elevated temperatures accelerates irreversible capacity loss alongside the desired defect activation. Parasitic reactions consume active lithium ions, thickening the solid electrolyte interphase on graphite anodes and increasing internal cell impedance. Operational quality managers establish strict degradation budgets for factory screening, capping total allowable capacity loss during burn-in steps to preserve customer cycle-life guarantees.
Thermal gradients skew voltage readings. Safety parameters governing high-temperature soak procedures align with international standards including UL 1642 and IEC 62133. These standards bound thermal exposure to prevent entering regions of chemical instability.
Soaking fully charged cells above 60 °C risks initiating exothermic breakdown of the electrolyte interface, converting a quality screening process into a severe thermal event hazard.

Capacity Trade-Offs and Parasitic SEI Growth
Quantifying screening-induced capacity loss requires evaluating lithium consumption against defect screening yield improvement. Soaking pouch cells at 45 °C for 72 hours under 100 percent state of charge consumes roughly 0.4 percent of nominal rated cell capacity. That loss equates to approximately 15 cycles of equivalent room-temperature calendar life.
The resulting yield protection eliminates field failure rates that would otherwise destroy pack-level reliability performance.

Statistical Thresholds for High Yield Lot Acceptance
Lot screening distributions plotted on Weibull scales separate normal manufacturing variance from outlier defect populations. Establishing clear statistical boundaries avoids scrapping healthy cell lots while ensuring high-risk batches are isolated. Quality engineering teams define clear physical failure modes when analyzing screening yield losses:
- Copper Dissolution Bridges micro-short pathways created when cell potential drops below critical thermodynamic stability limits during extended storage periods.
- Separator Burr Penetrations physical punctures resulting from coarse slitting edges that breach ceramic coating layers under thermal compression.
- Active Material Delamination localized loss of electrode coating adherence creating non-uniform current distribution and thermal hotspots during operation.
- Particulate Metal Contaminants loose iron or nickel shims introduced during tab welding that migrate through low-density separator regions.
Impedance shifts mark micro-short growth. Statistical process control charts establish pass-fail criteria based on lot K-value standard deviations. Setting the failure threshold at three standard deviations above the population mean catches early-stage internal defects.
Tightening screening thresholds to two standard deviations increases false rejection rates, discarding viable cells without yielding measurable improvements in long-term field pack reliability.
Compliance with UN 38.3 transport safety testing requires that post-screening cell lots retain structural integrity without exceeding allowable open-circuit voltage drop thresholds.
Standard procurement contracts stipulate that factory burn-in profiles consuming more than one percent of rated cell cycle life entitle the buyer to a landed cost credit.
Rack
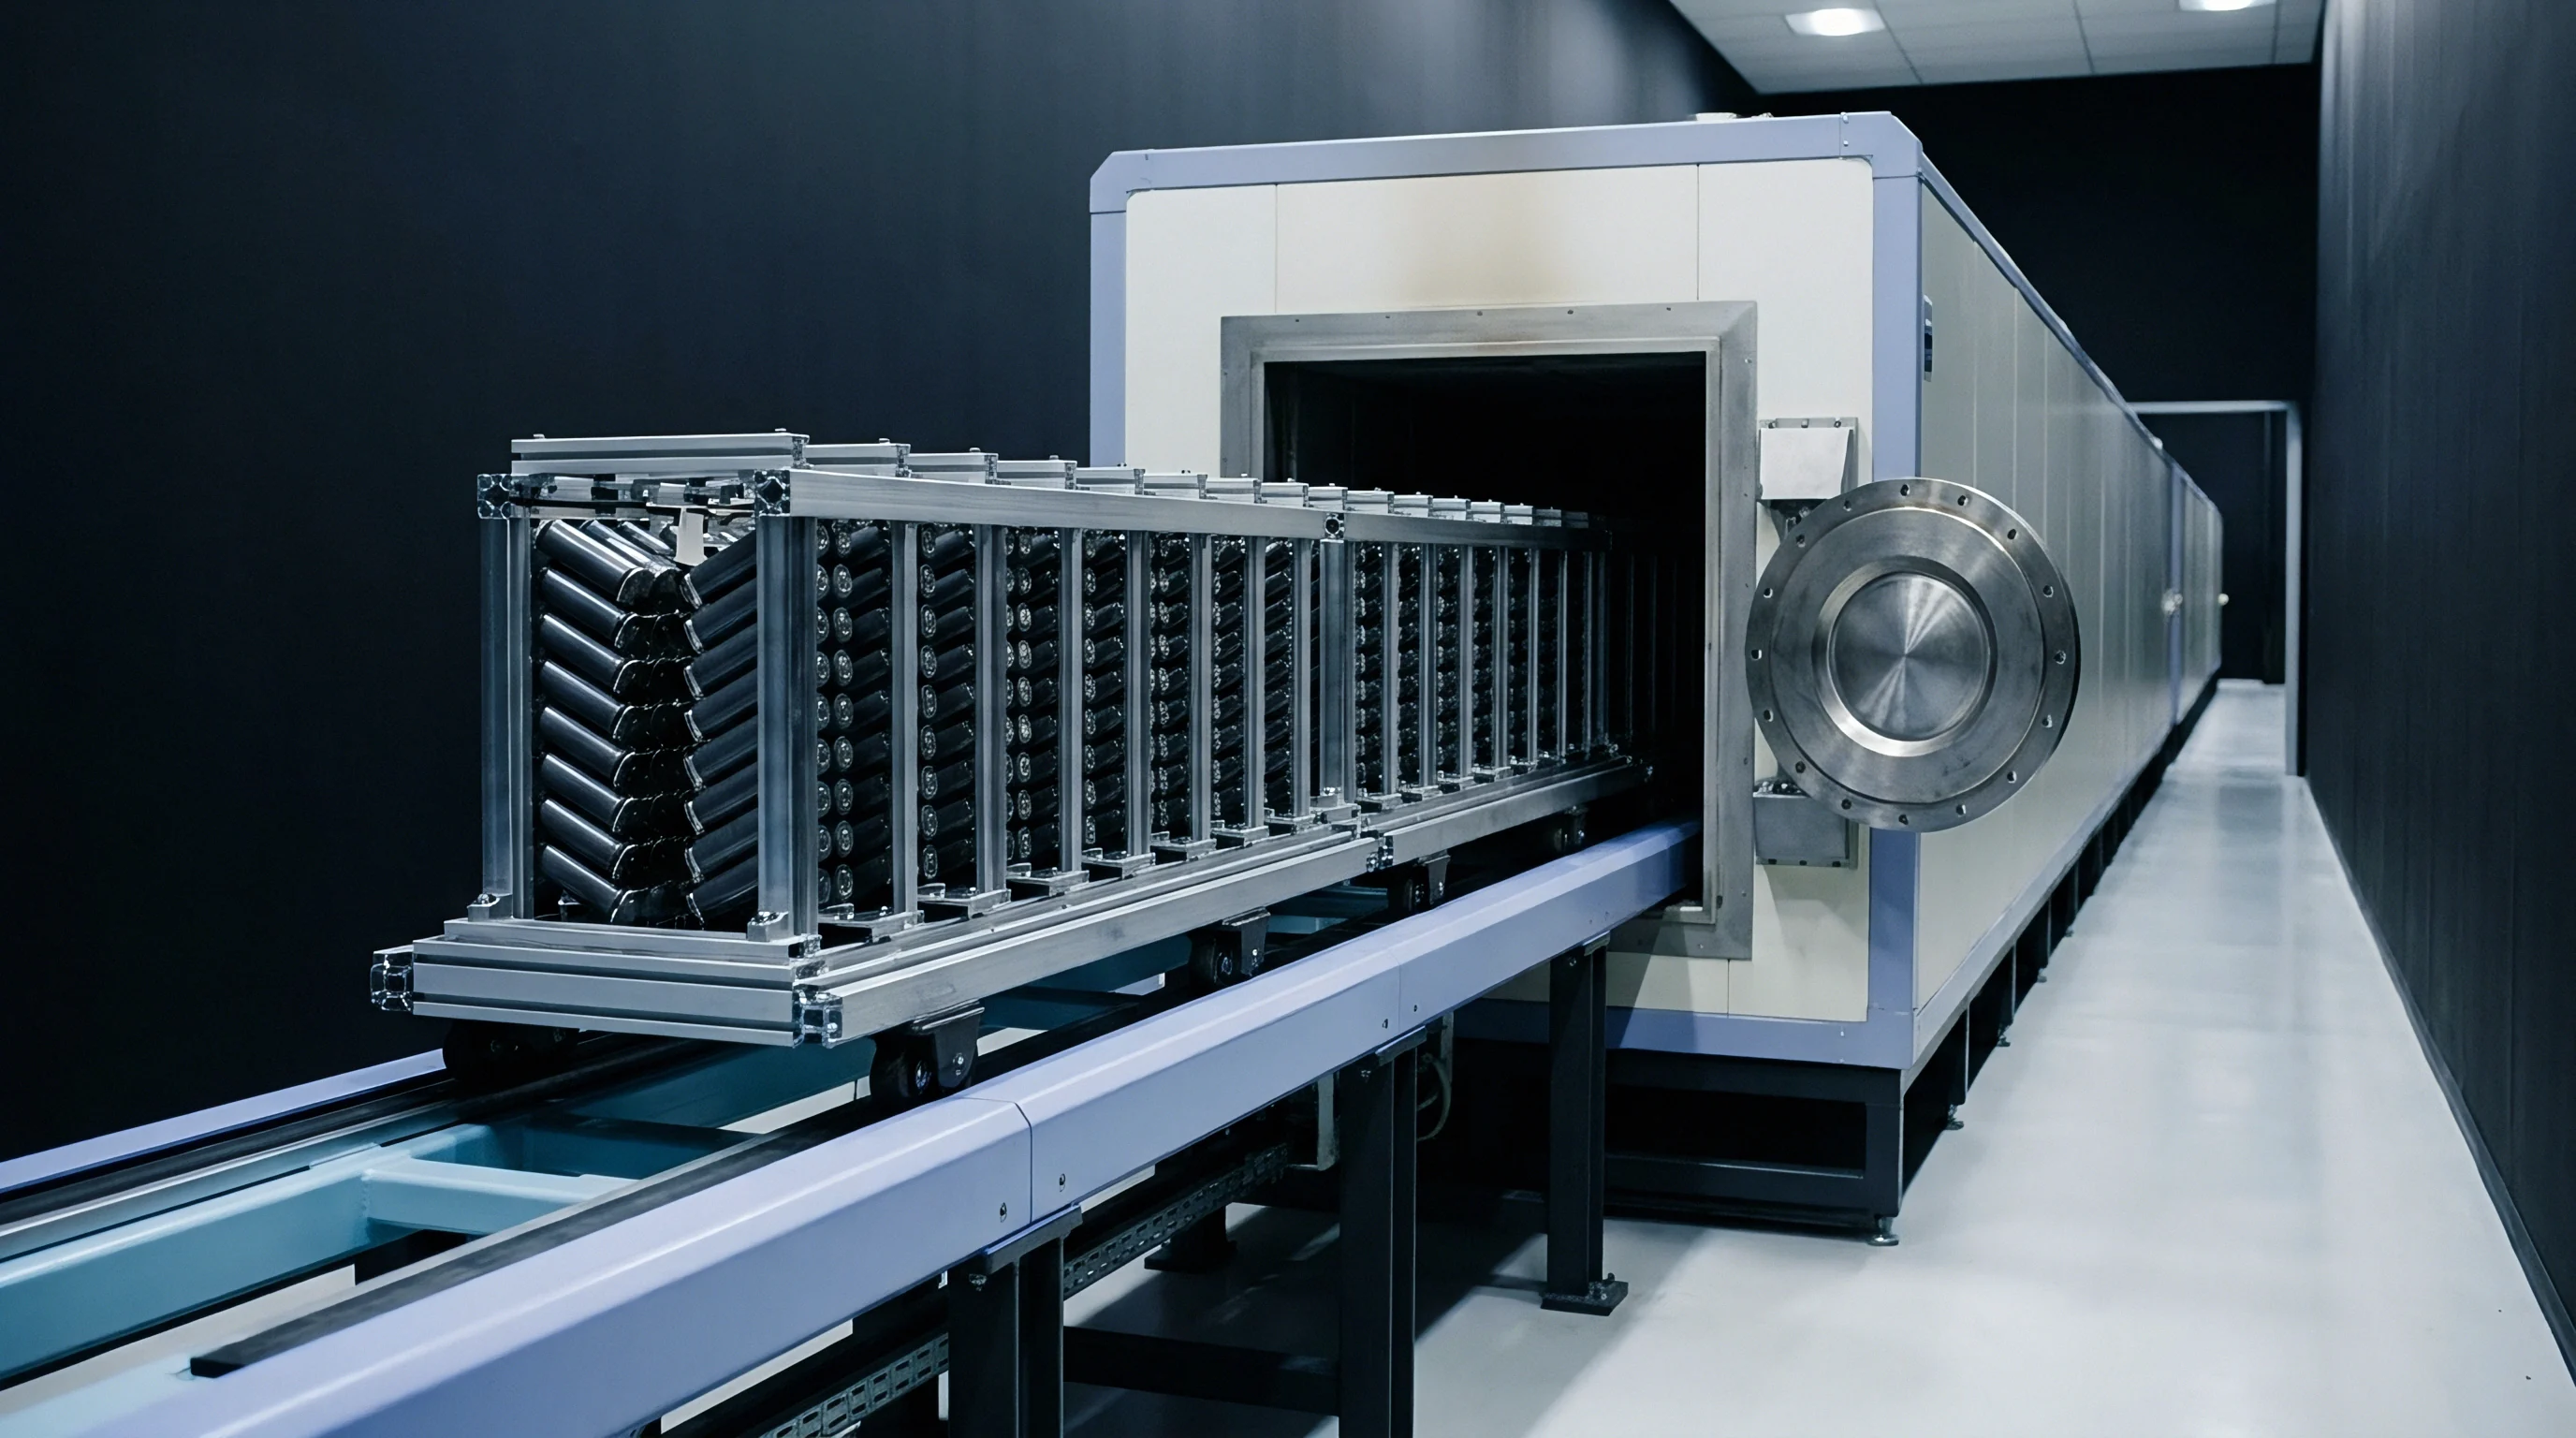
Airflow velocity across densely packed cell trays dictates temperature equity between edge positions and center modules. High-density burn-in chambers housing tens of thousands of cylindrical or prismatic cells require engineered thermal management systems. Temperature variations exceeding 1.0 °C across a single tray distort K-value calculations, causing cells in warmer central locations to exhibit higher false self-discharge rates than cooler peripheral units.
Precision probes eliminate contact error. Automated screening racks integrate multi-channel voltage sampling systems directly into cell tray carriers. Spring-loaded gold-plated Kelvin probes contact cell terminals during soak cycles, minimizing contact resistance variations that corrupt microvolt OCV measurements.
Automated data acquisition units log voltage channels continuously, flagging abnormal discharge slopes in real time.

Thermal Uniformity Control in High Density Chambers
Forced-air circulation combined with micro-zone heating elements maintains strict thermal stability inside industrial soak chambers. Ducted vertical airflow distribution prevents stratification, ensuring air velocity reaches all cell surfaces uniformly. Integrating ambient temperature sensor grids directly across cell trays provides real-time feedback to chamber zone controllers, holding spatial thermal variances within ±0.3 °C across full production loads.
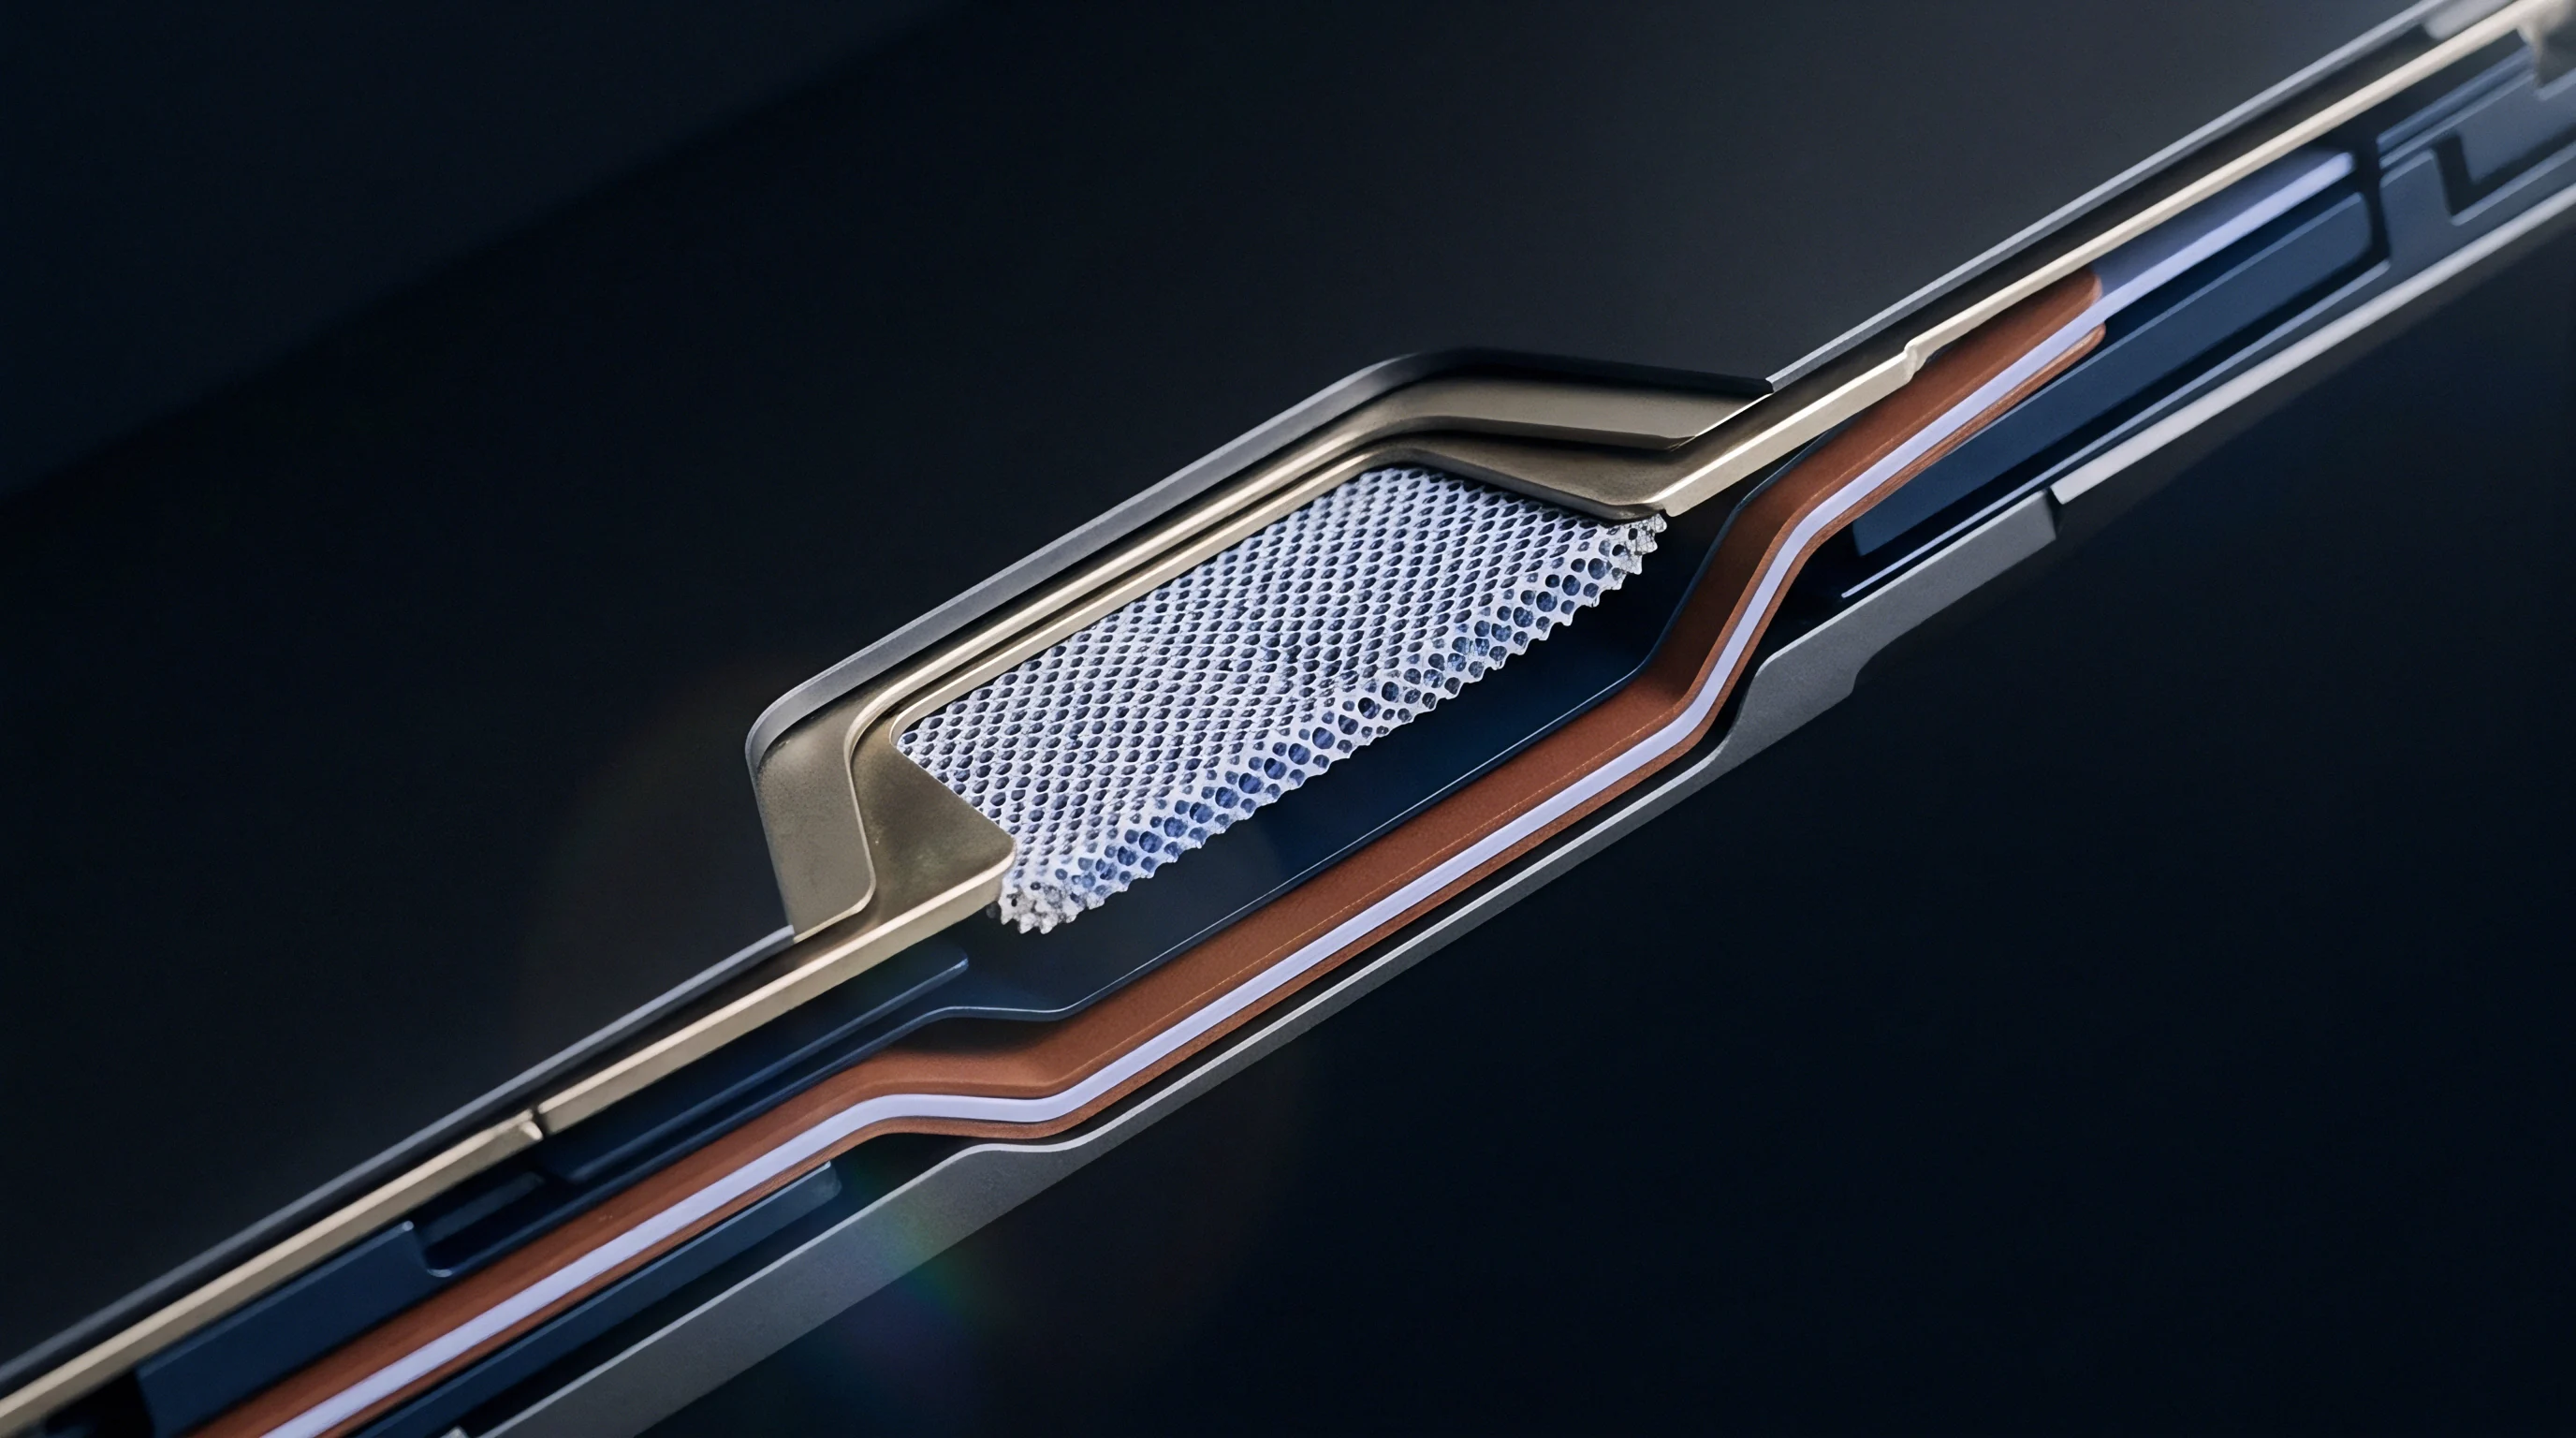
Contact Resistance Stabilization in High Throughput Testing
Spring-loaded probe pins contacting cell terminals introduce parasitic resistance variations if surfaces accumulate oxidation. Automated rack cleaning protocols and regular probe replacement cycles prevent measurement errors. Utilizing four-wire Kelvin sensing configurations isolates wiring and contact resistance from true cell potential readings, allowing diagnostic hardware to capture true microvolt OCV changes reliably.
| Chamber Parameter | Tolerance Requirement | Impact on Defect Signal | Failure Risk if Uncontrolled |
|---|---|---|---|
| Spatial Temperature Delta | ± 0.3 °C | Shifts Baseline K-Value | False Rejection of Center Cells |
| Airflow Velocity Uniformity | 1.2 – 1.5 m/s | Alters Cell Thermal Time Constant | Incomplete Thermal Equilibration |
| Probe Contact Resistance | Distorts Microvolt OCV Sampling | Masked Micro-Short Voltage Drops | |
| Voltage Channel Noise Floor | Sets K-Value Resolution Limit | Undetected Low-Grade Soft Shorts |
Hot spots trigger cell ejection. Automated safety systems monitor individual cell tray temperatures continuously during thermal soak operations. Infrared thermography arrays mounted inside high-throughput chambers detect localized thermal anomalies indicating rapid micro-short breakdown.
Automated pneumatic pushers eject rogue cells into water-quench isolation bins before thermal runaway events spread across adjacent trays.
The following criteria govern automated inline lot qualification inside high-throughput burn-in systems:
- K-Value Distribution Cutoff establishes three standard deviations from the population mean as the scrap limit for incoming cell batches.
- Voltage Recovery Slope verifies that cell potential stabilizes within twenty-four hours after returning to ambient temperature conditions.
- Impedance Delta Limit restricts acceptable 1-kHz AC IR increase post-soak to less than five percent of initial factory intake values.
- Visual Swell Criteria flags pouch cells exhibiting thickness increases greater than zero point two millimeters following thermal exposure.
Non-uniform chamber airflow creates artificial self-discharge spreads that mask genuine metallic micro-shorts in central tray locations.
Failing to control temperature gradients across soak trays leads directly to mass field recalls caused by undetected micro-shorts shipped inside pass-graded lots.

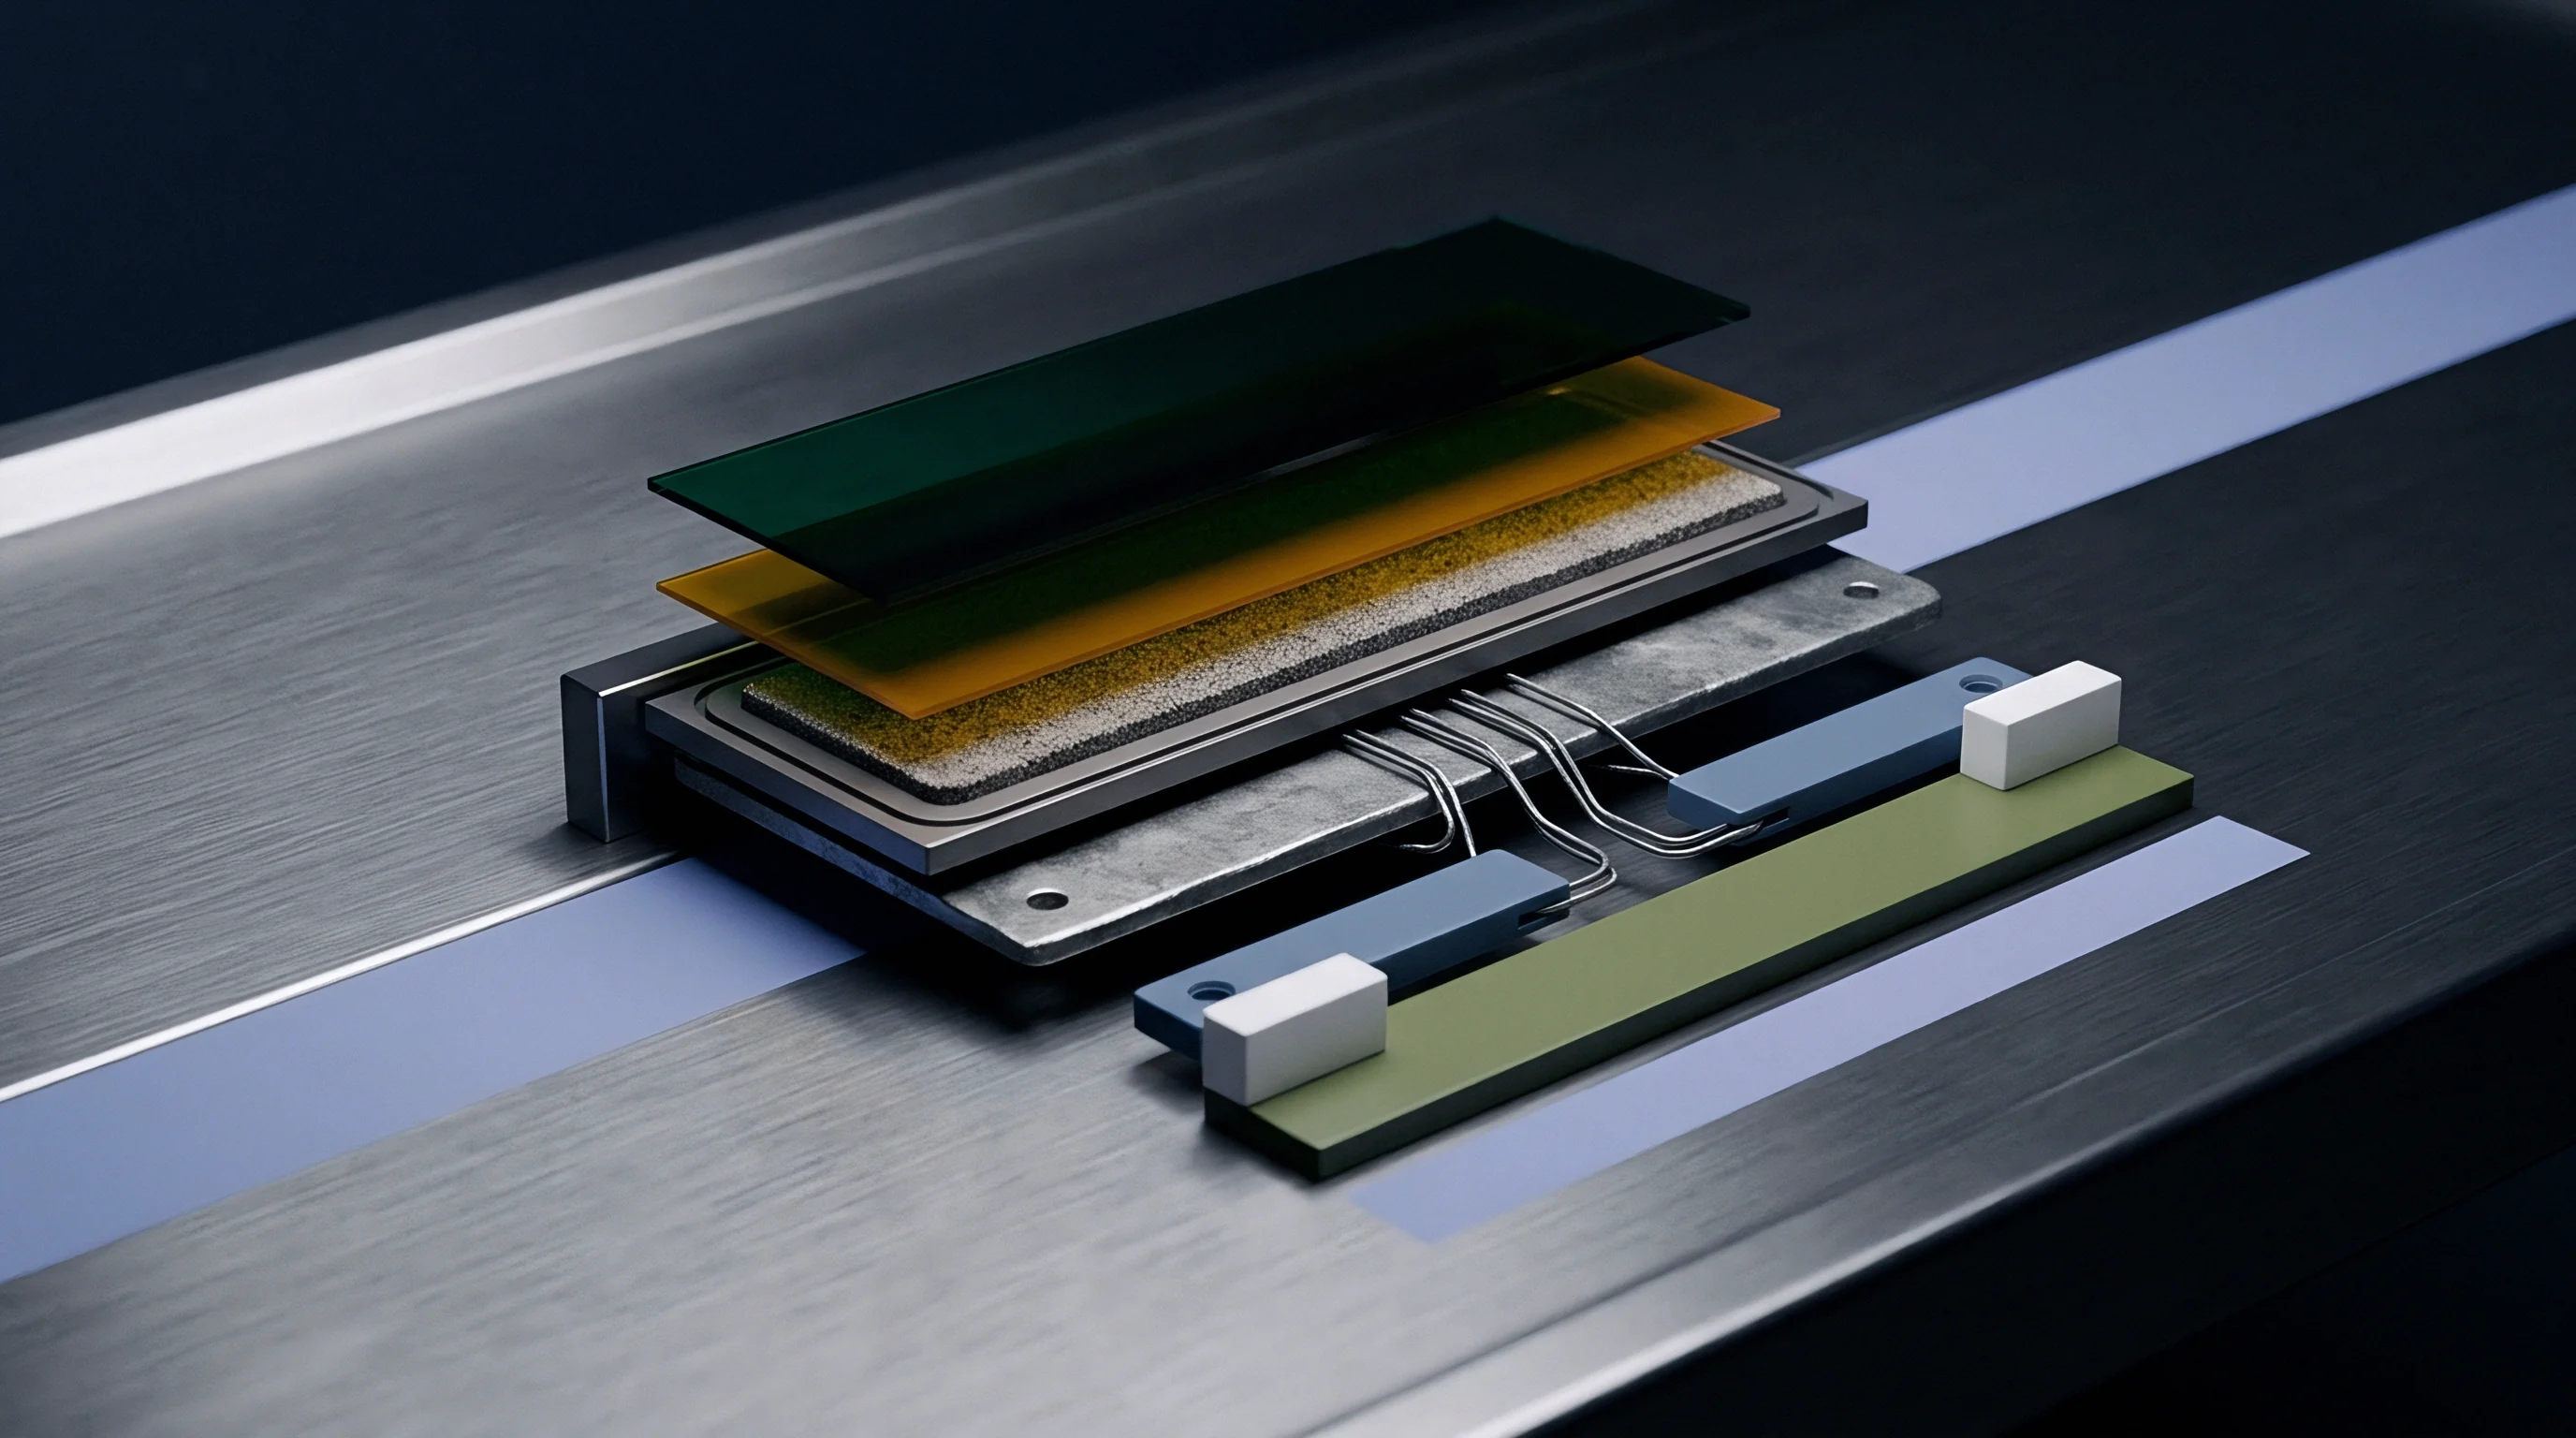
Ledger
Financial returns on factory screening equipment depend on the balance between scrap costs and field warranty liabilities. Implementing optimized multi-temperature soak profiles increases upfront production expenses through capital equipment depreciation and energy consumption. Catching internal cell defects on the factory floor prevents catastrophically expensive warranty claims, pack replacement campaigns, and brand reputation damage in commercial energy storage applications.
Field failures wreck pack warranties. Evaluating the financial payback of multi-temperature burn-in protocols requires analyzing cell yield losses against field exposure risks. Advanced thermal soak sequences catch subtle defects that pass standard room-temperature inspection, shifting the failure detection point from the customer field environment back to the factory cell line.
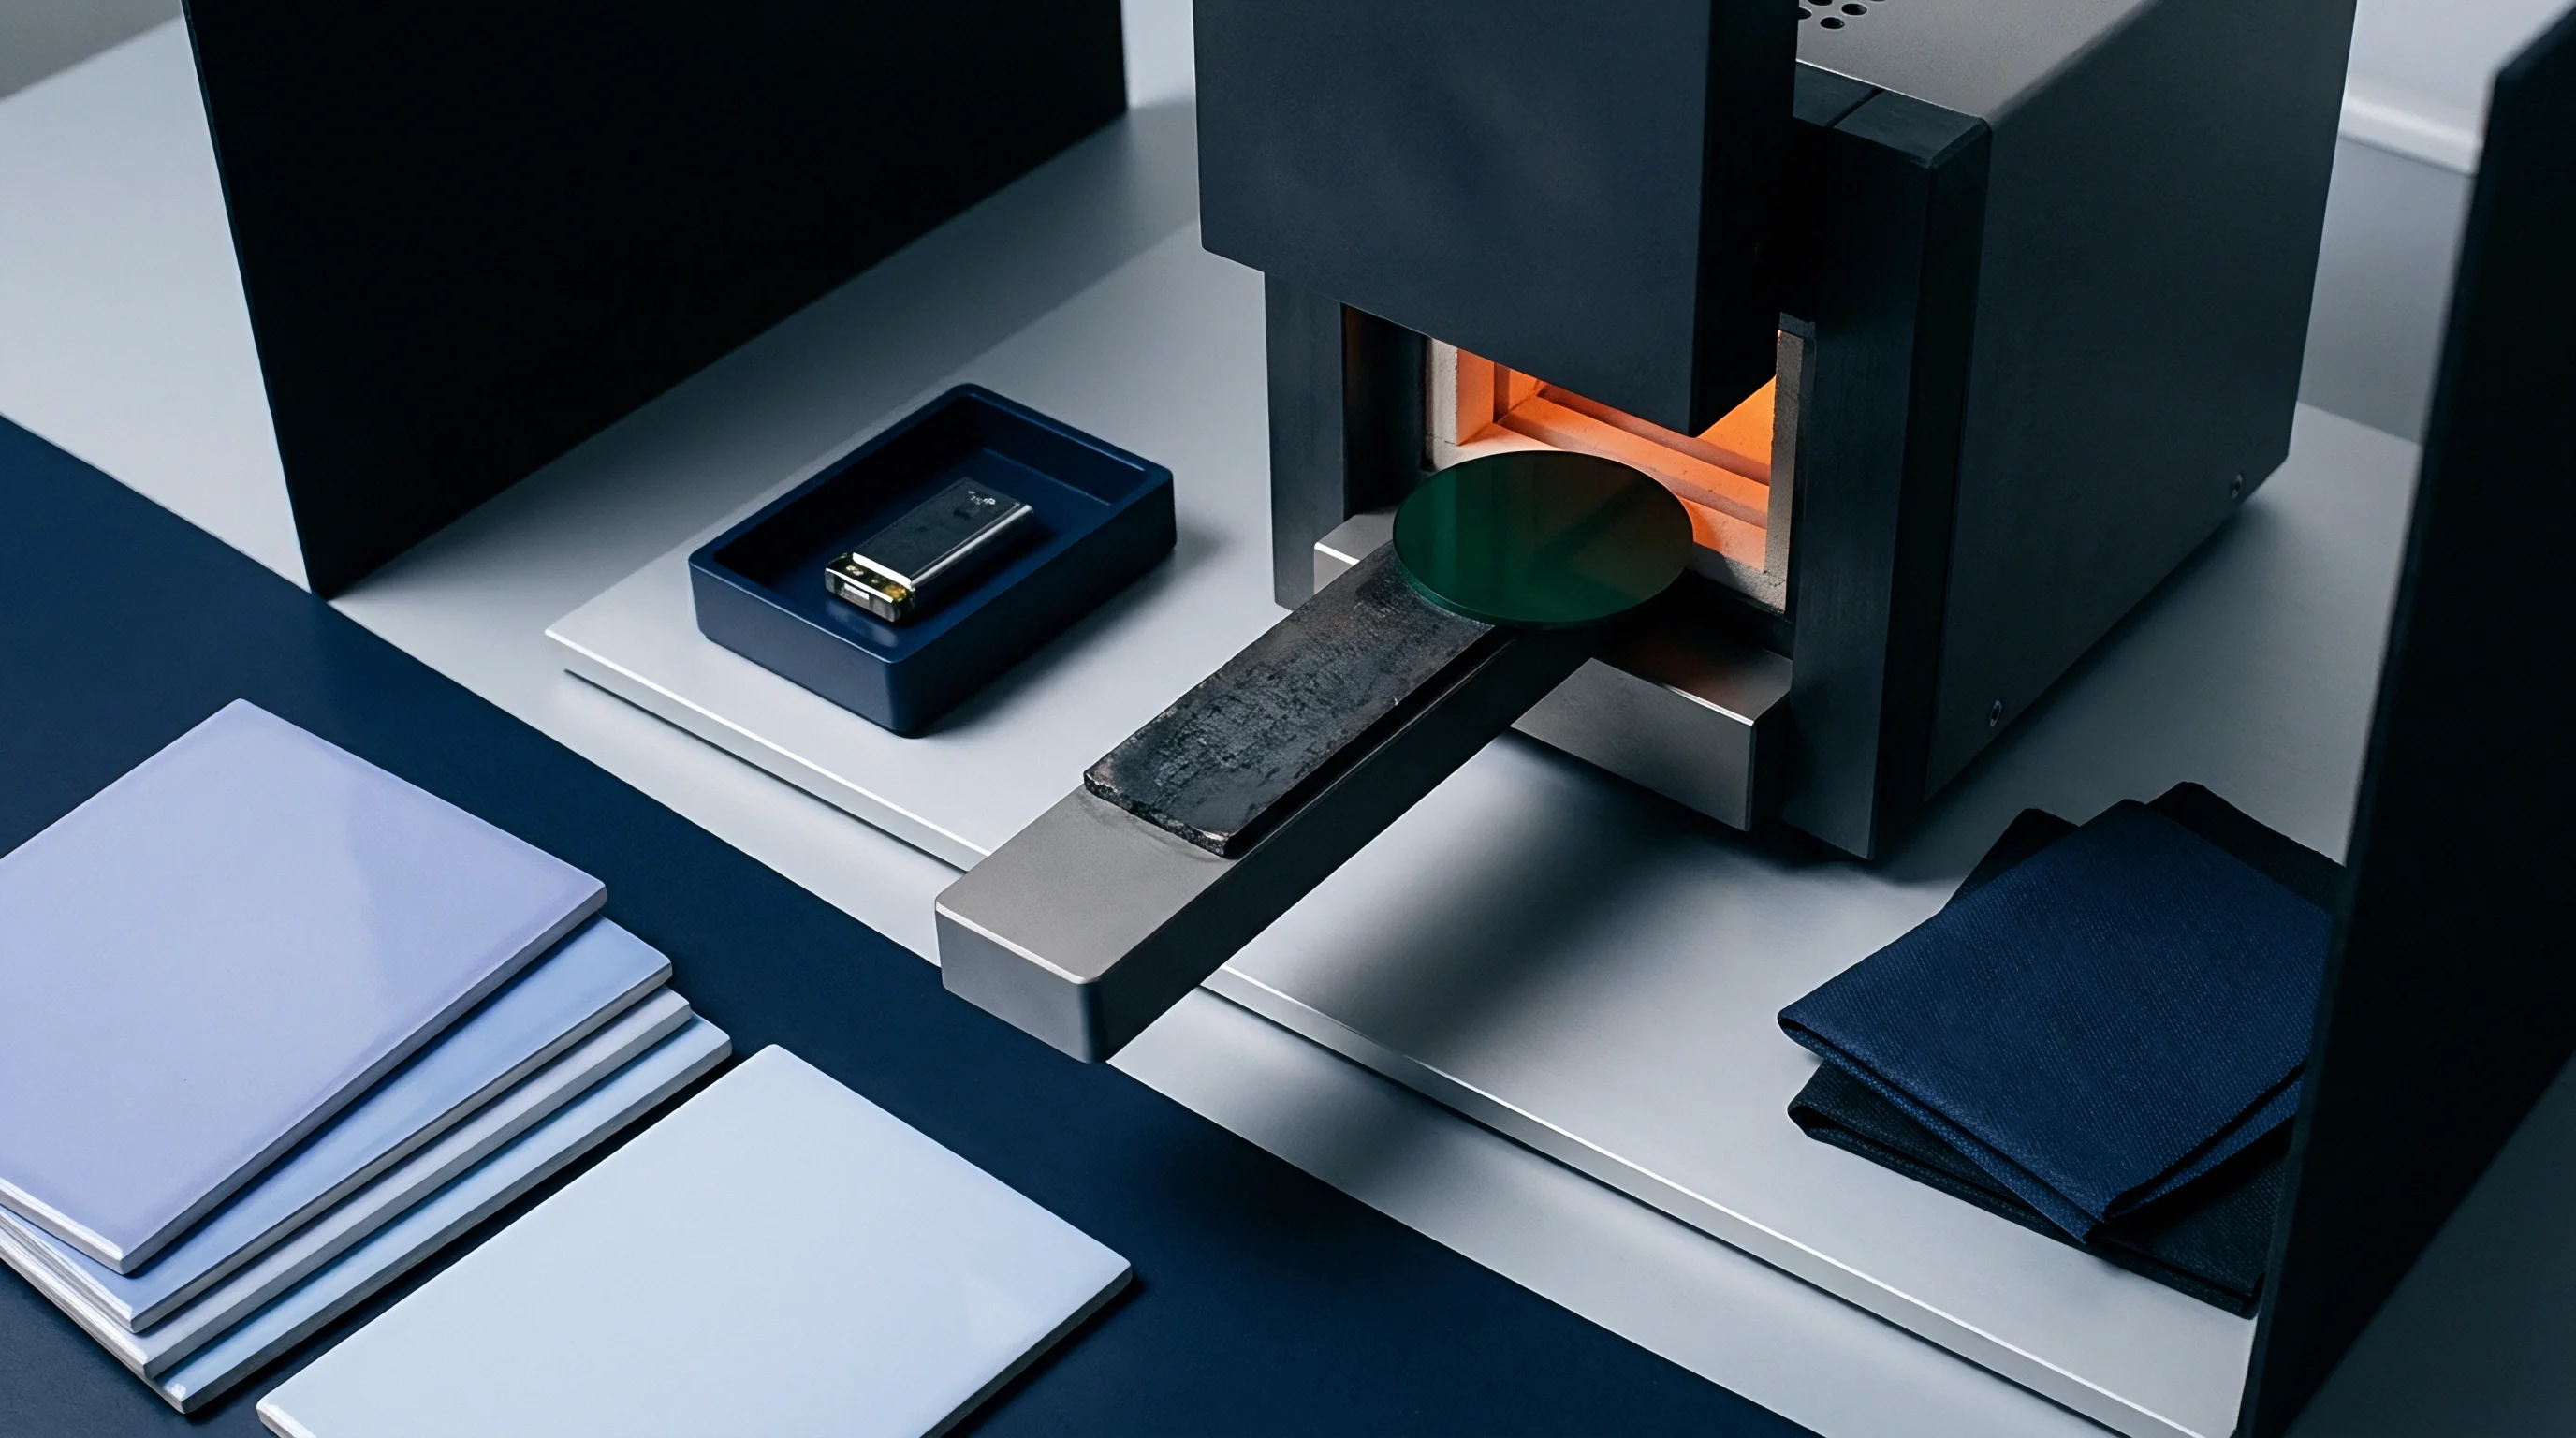
Cost-Benefit Modeling of Inline Soak Protocols
Quantifying financial ROI involves comparing screening operational cost against field failure liability reduction. Evaluating a production lot of 50,000 unit 21700 NMC cells priced at $2.20 per cell establishes a baseline material value of $110,000. Running a 72-hour multi-temperature soak profile incurs an operational energy and equipment cost of $0.08 per cell, totaling $4,000 for the lot.
Screening exposes a defect scrap rate of 0.6 percent, representing 300 defective cells ejected at a material value loss of $660.
Scrap costs underperform field recalls. Total screening expenditure for the 50,000-cell lot reaches $4,660, raising effective unit costs to $0.093 per delivered good cell. Leaving the lot unscreened allows those 300 defective cells to enter pack manufacturing, creating roughly three defective battery packs within a 497-pack build run.
Field warranty replacement costs per defective pack average $2,500, representing a total unscreened field liability of $7,500. Implementing multi-temperature screening saves $2,840 net per 50,000-cell lot while eliminating safety liabilities.
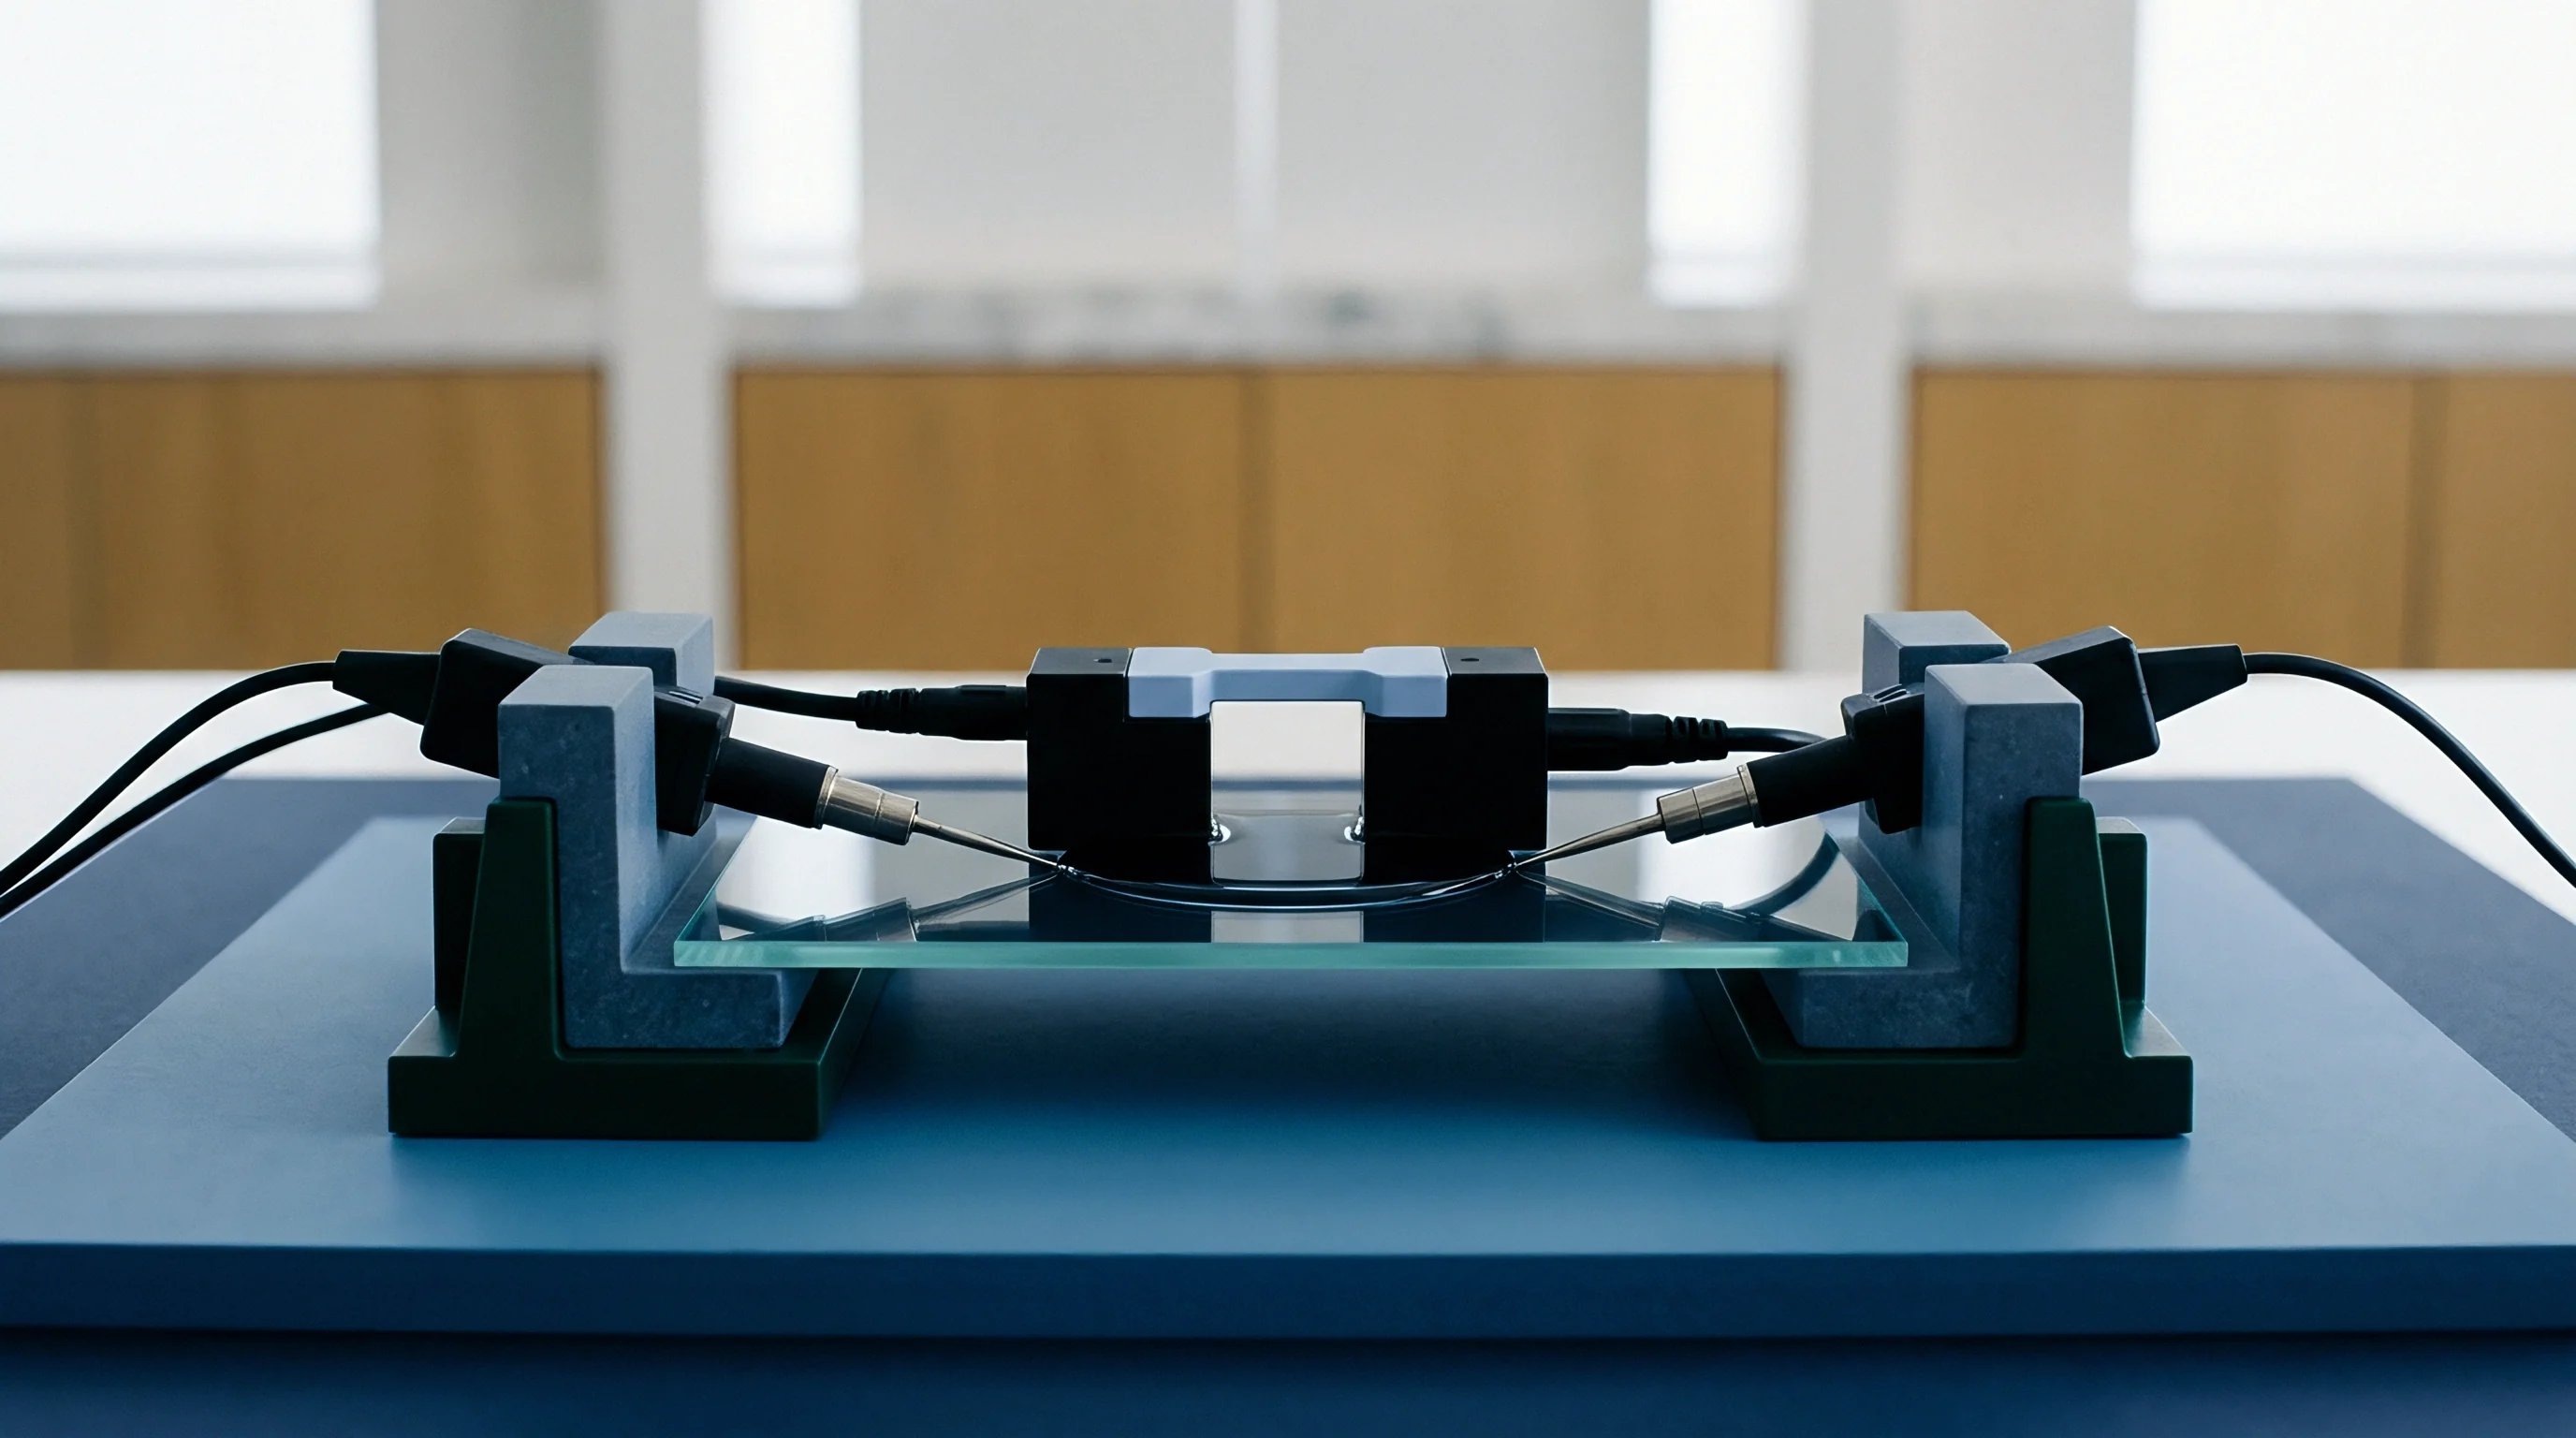
Quantifying Landed Pack Value through Yield Risk Reduction
Landed cost includes test energy. Procurement engineers negotiating cell supply contracts integrate burn-in screening clauses into baseline purchase specifications. Requiring vendors to perform multi-temperature thermal soak protocols prior to final lot acceptance shifts early yield loss expense to the cell manufacturer while guaranteeing tight K-value distributions on delivered shipments.
Quality burn-in protects pack margins. Specifying validated burn-in protocols lowers insurance premiums for large-scale battery systems by proving rigorous failure prevention measures. Factoring thermal screening expense directly into the initial procurement dossier establishes clear boundary conditions for cell warranty negotiations and supplier quality agreements.