Quantifying Solid Phase Hysteresis and Phase Boundary Microstructure Coupling in Intercalation Electrodes
Solid phase hysteresis requires state space BMS modeling and GITT quantification to prevent severe state of charge errors and uncompensated efficiency loss.


Thermodynamics
Energy Landscapes in Two-Phase Intercalation
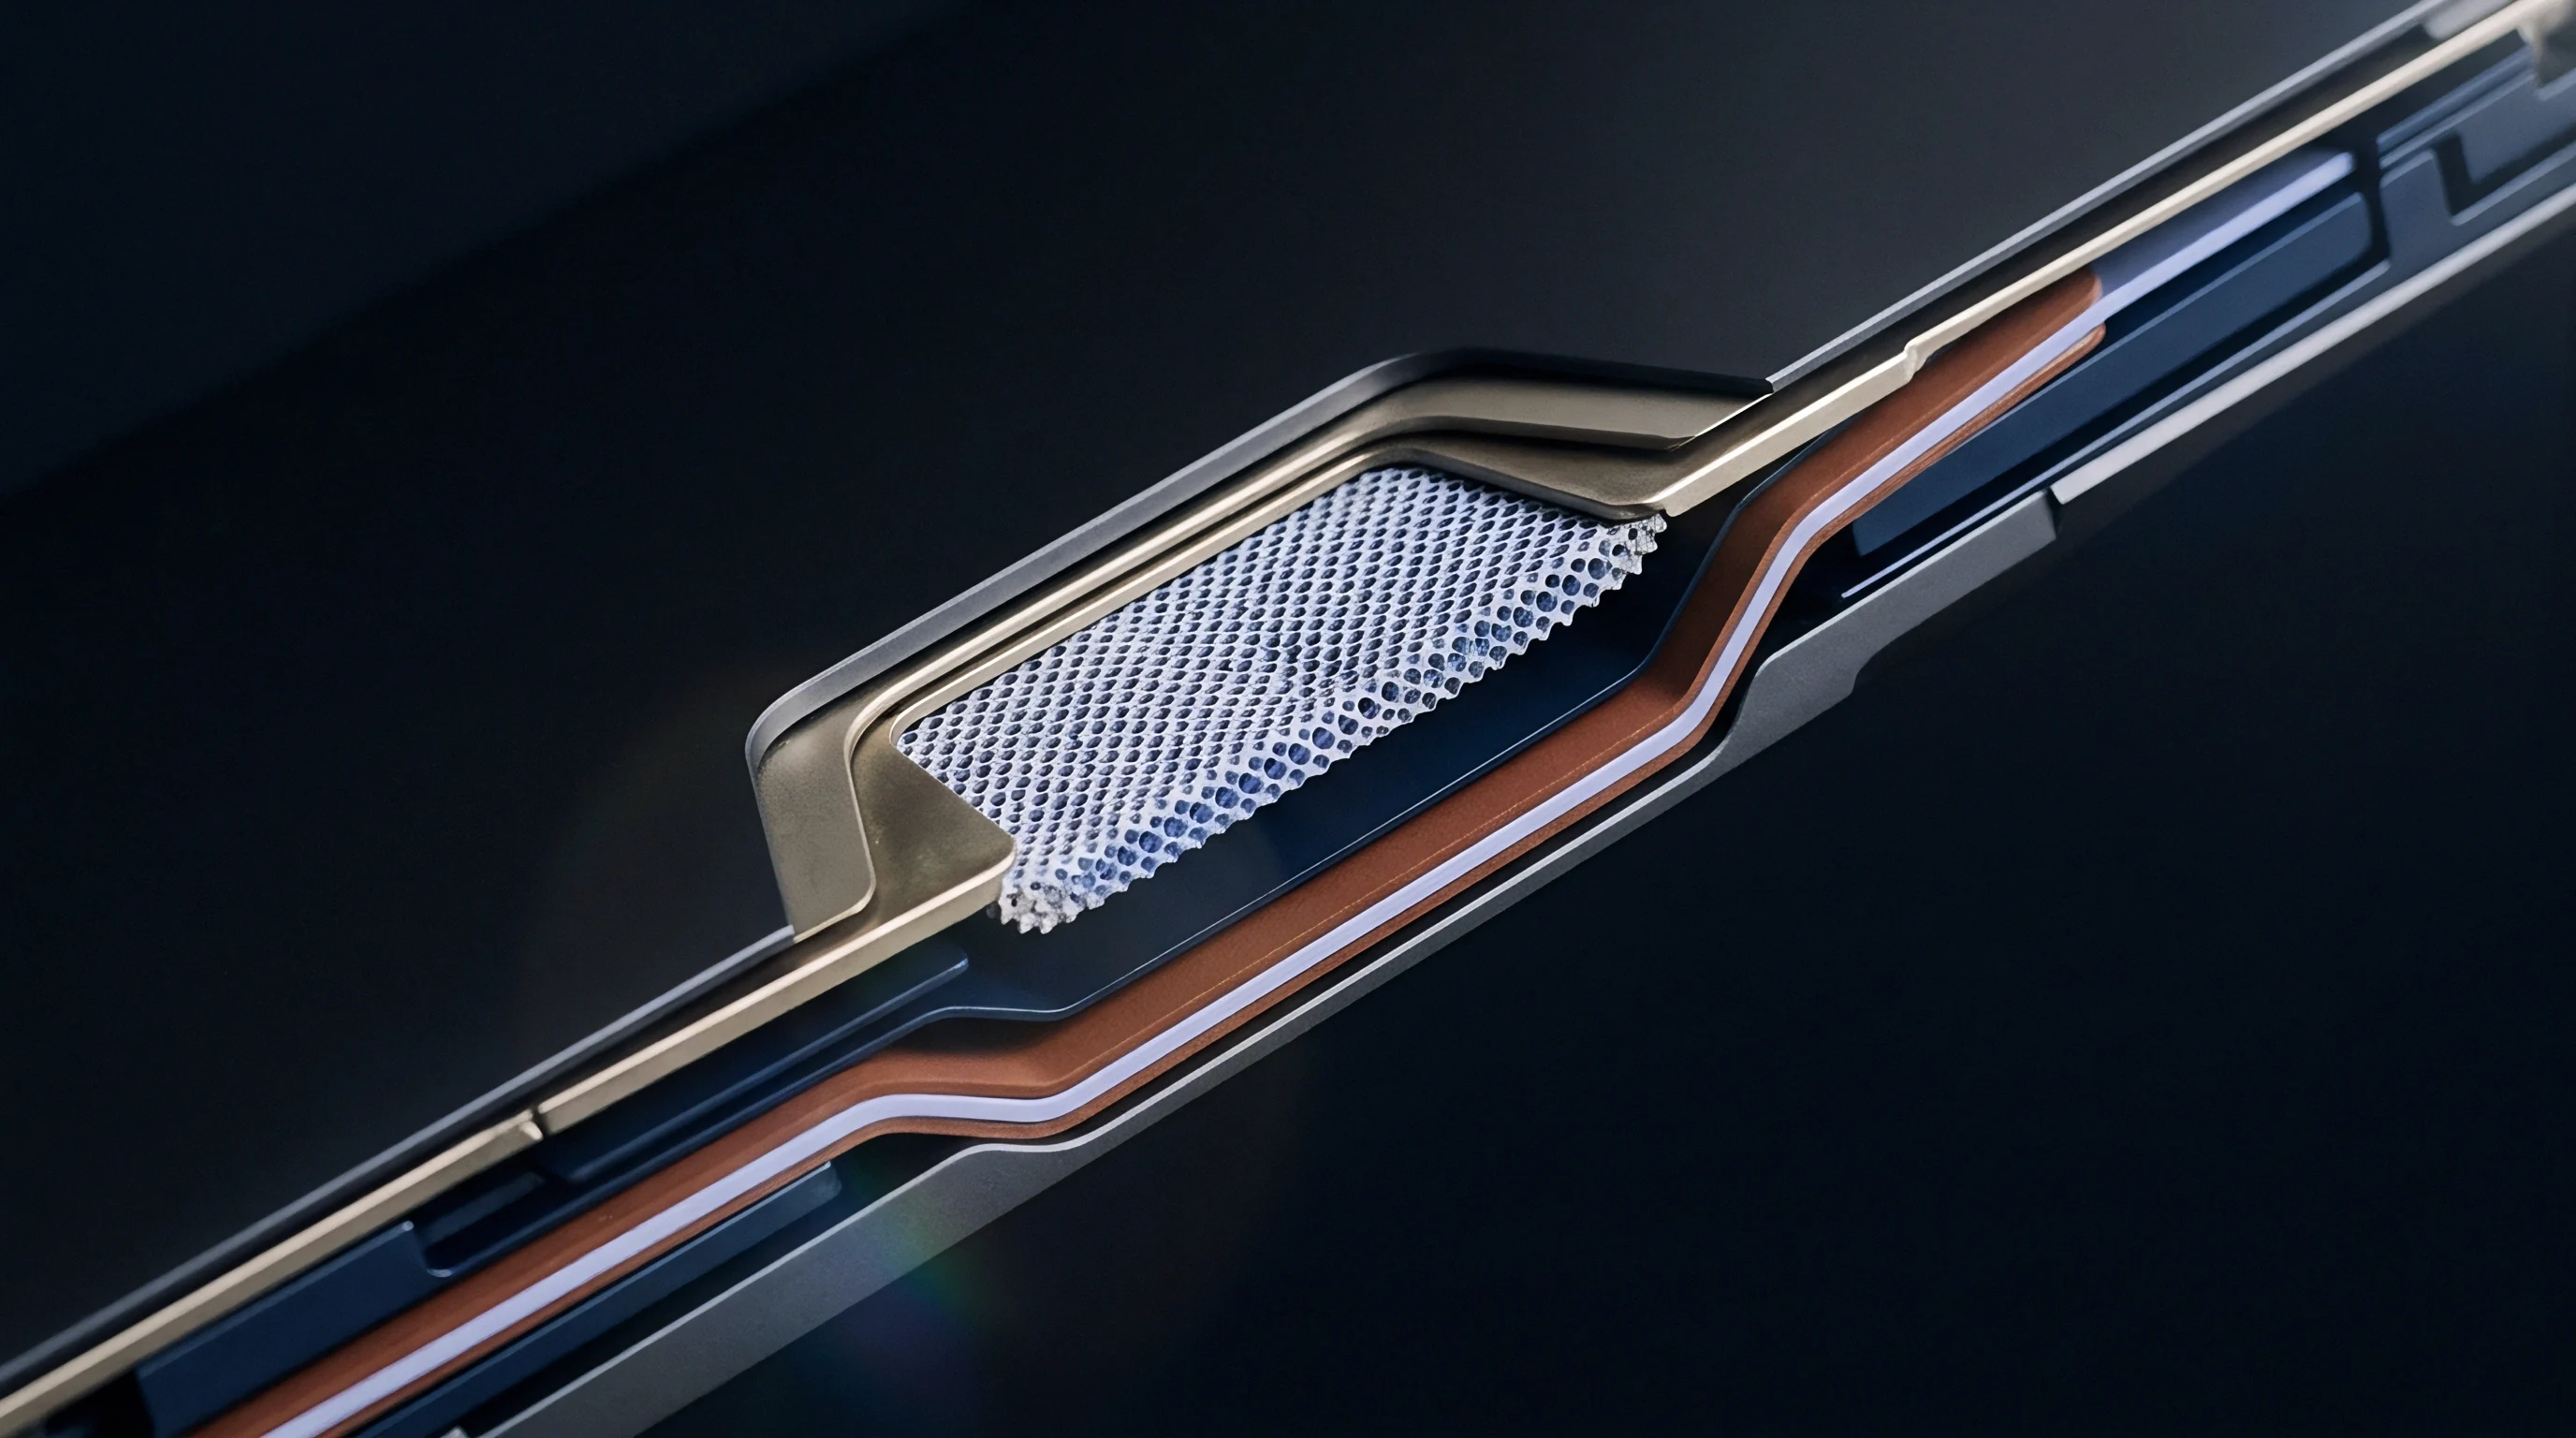
Intercalation in materials such as iron phosphate and lithium titanate happens through phase separation instead of a continuous solid-solution process. As lithium ions enter the surface of primary particles during lithiation, a structural phase boundary forms between a lithium-poor alpha phase and a lithium-rich beta phase. Their free energy density curve shows a double-well profile against local lithium concentration.
Because this energy density is non-convex, the system lowers its total free energy by splitting into discrete physical domains divided by phase interfaces.
Equilibrium cell voltage tracks the derivative of total free energy with respect to state of charge. Classical thermodynamic models treat this bulk equilibrium voltage as identical during charge and discharge. Yet experimental open-circuit voltage curves measured at micro-ampere rates show a persistent gap between charge and discharge branches, long after kinetic overpotentials fall to zero.
Phase-field models based on Cahn-Hilliard equations show that this offset comes from the interfacial energy penalty of the boundary itself and the mechanical strain needed to hold atomic continuity across mismatched lattices.

Chemical Potential Jump across Moving Interfaces
Shifting a phase interface during charge or discharge requires a net chemical potential driving force. During lithiation, lithium concentration at the boundary must overshoot the static solubility limit to push the phase transformation forward. During delithiation, concentration drops below the lower solubility limit before the phase transition begins.
This asymmetric overshoot creates a directional split in measured potential plateaus that does not vanish no matter how slowly current runs through the electrode. Holding voltage at partial states of charge reveals minor hysteresis loops bridging the upper charge and lower discharge plateaus, showing that the solid system settles into different metastable free energy states depending on current history.
An open-circuit voltage gap originating from solid-phase energy barriers persists even after multi-day relaxation periods at zero current.

Metastable Path Dependence
Individual active grains undergo sharp phase transitions at distinct local potentials, leading to path-dependent behavior across the porous electrode network. Particles closest to the separator transform first because of local electrolyte transport resistance, leaving a spatial mix of transformed and untransformed grains. Reversing current mid-cycle leaves active particles in partially transformed states, freezing phase boundaries inside the crystal lattice.
System-level open-circuit voltage represents a weighted average of surface chemical potentials across all active particles linked to the conductive matrix. When current stops mid-plateau, lithium redistributes between particles over several hours, flowing from higher-potential regions to lower-potential ones. This slow internal equilibration causes voltage drift that distorts standard state-of-charge calculations built on static electromotive force tables.


Strain

Lattice Mismatch and Elastic Energy Density
Volume changes during phase transitions generate mechanical stress within primary active particles. In iron phosphate electrodes, converting between triphylite and heterosite phases contracts unit cell volume by approximately 6.8 percent, driven by unequal axis changes: the a-axis shrinks by 5.0 percent, the b-axis shrinks by 3.6 percent, and the c-axis expands by 1.9 percent. Coherency strain accumulates along the interface where parent and product lattices meet.
Elastic strain energy scales with the square of lattice mismatch and the host material’s shear modulus. As a phase interface moves through a crystallite, elastic strain energy density builds until mechanical forces balance the chemical potential driving force. Stored elastic energy raises the free energy of the growing phase, shifting transformation potential upward during charge and downward during discharge.
| Material Phase Pair | Volume Change Percent | Elastic Modulus GPa | Coherency Strain Energy MJ per m3 | Zero-Current Voltage Gap mV |
|---|---|---|---|---|
| LiFePO4 to FePO4 | 6.8 | 120 | 14.2 | 22 to 35 |
| Li4Ti5O12 to Li7Ti5O12 | 0.2 | 145 | 0.4 | 2 to 5 |
| C6 to LiC6 Stage One | 10.2 | 32 | 8.7 | 12 to 18 |
| LiNi0.8Co0.1Mn0.1O2 H2 to H3 | 5.1 | 175 | 18.9 | 15 to 28 |
Vegard Stress Accumulation during Boundary Progression
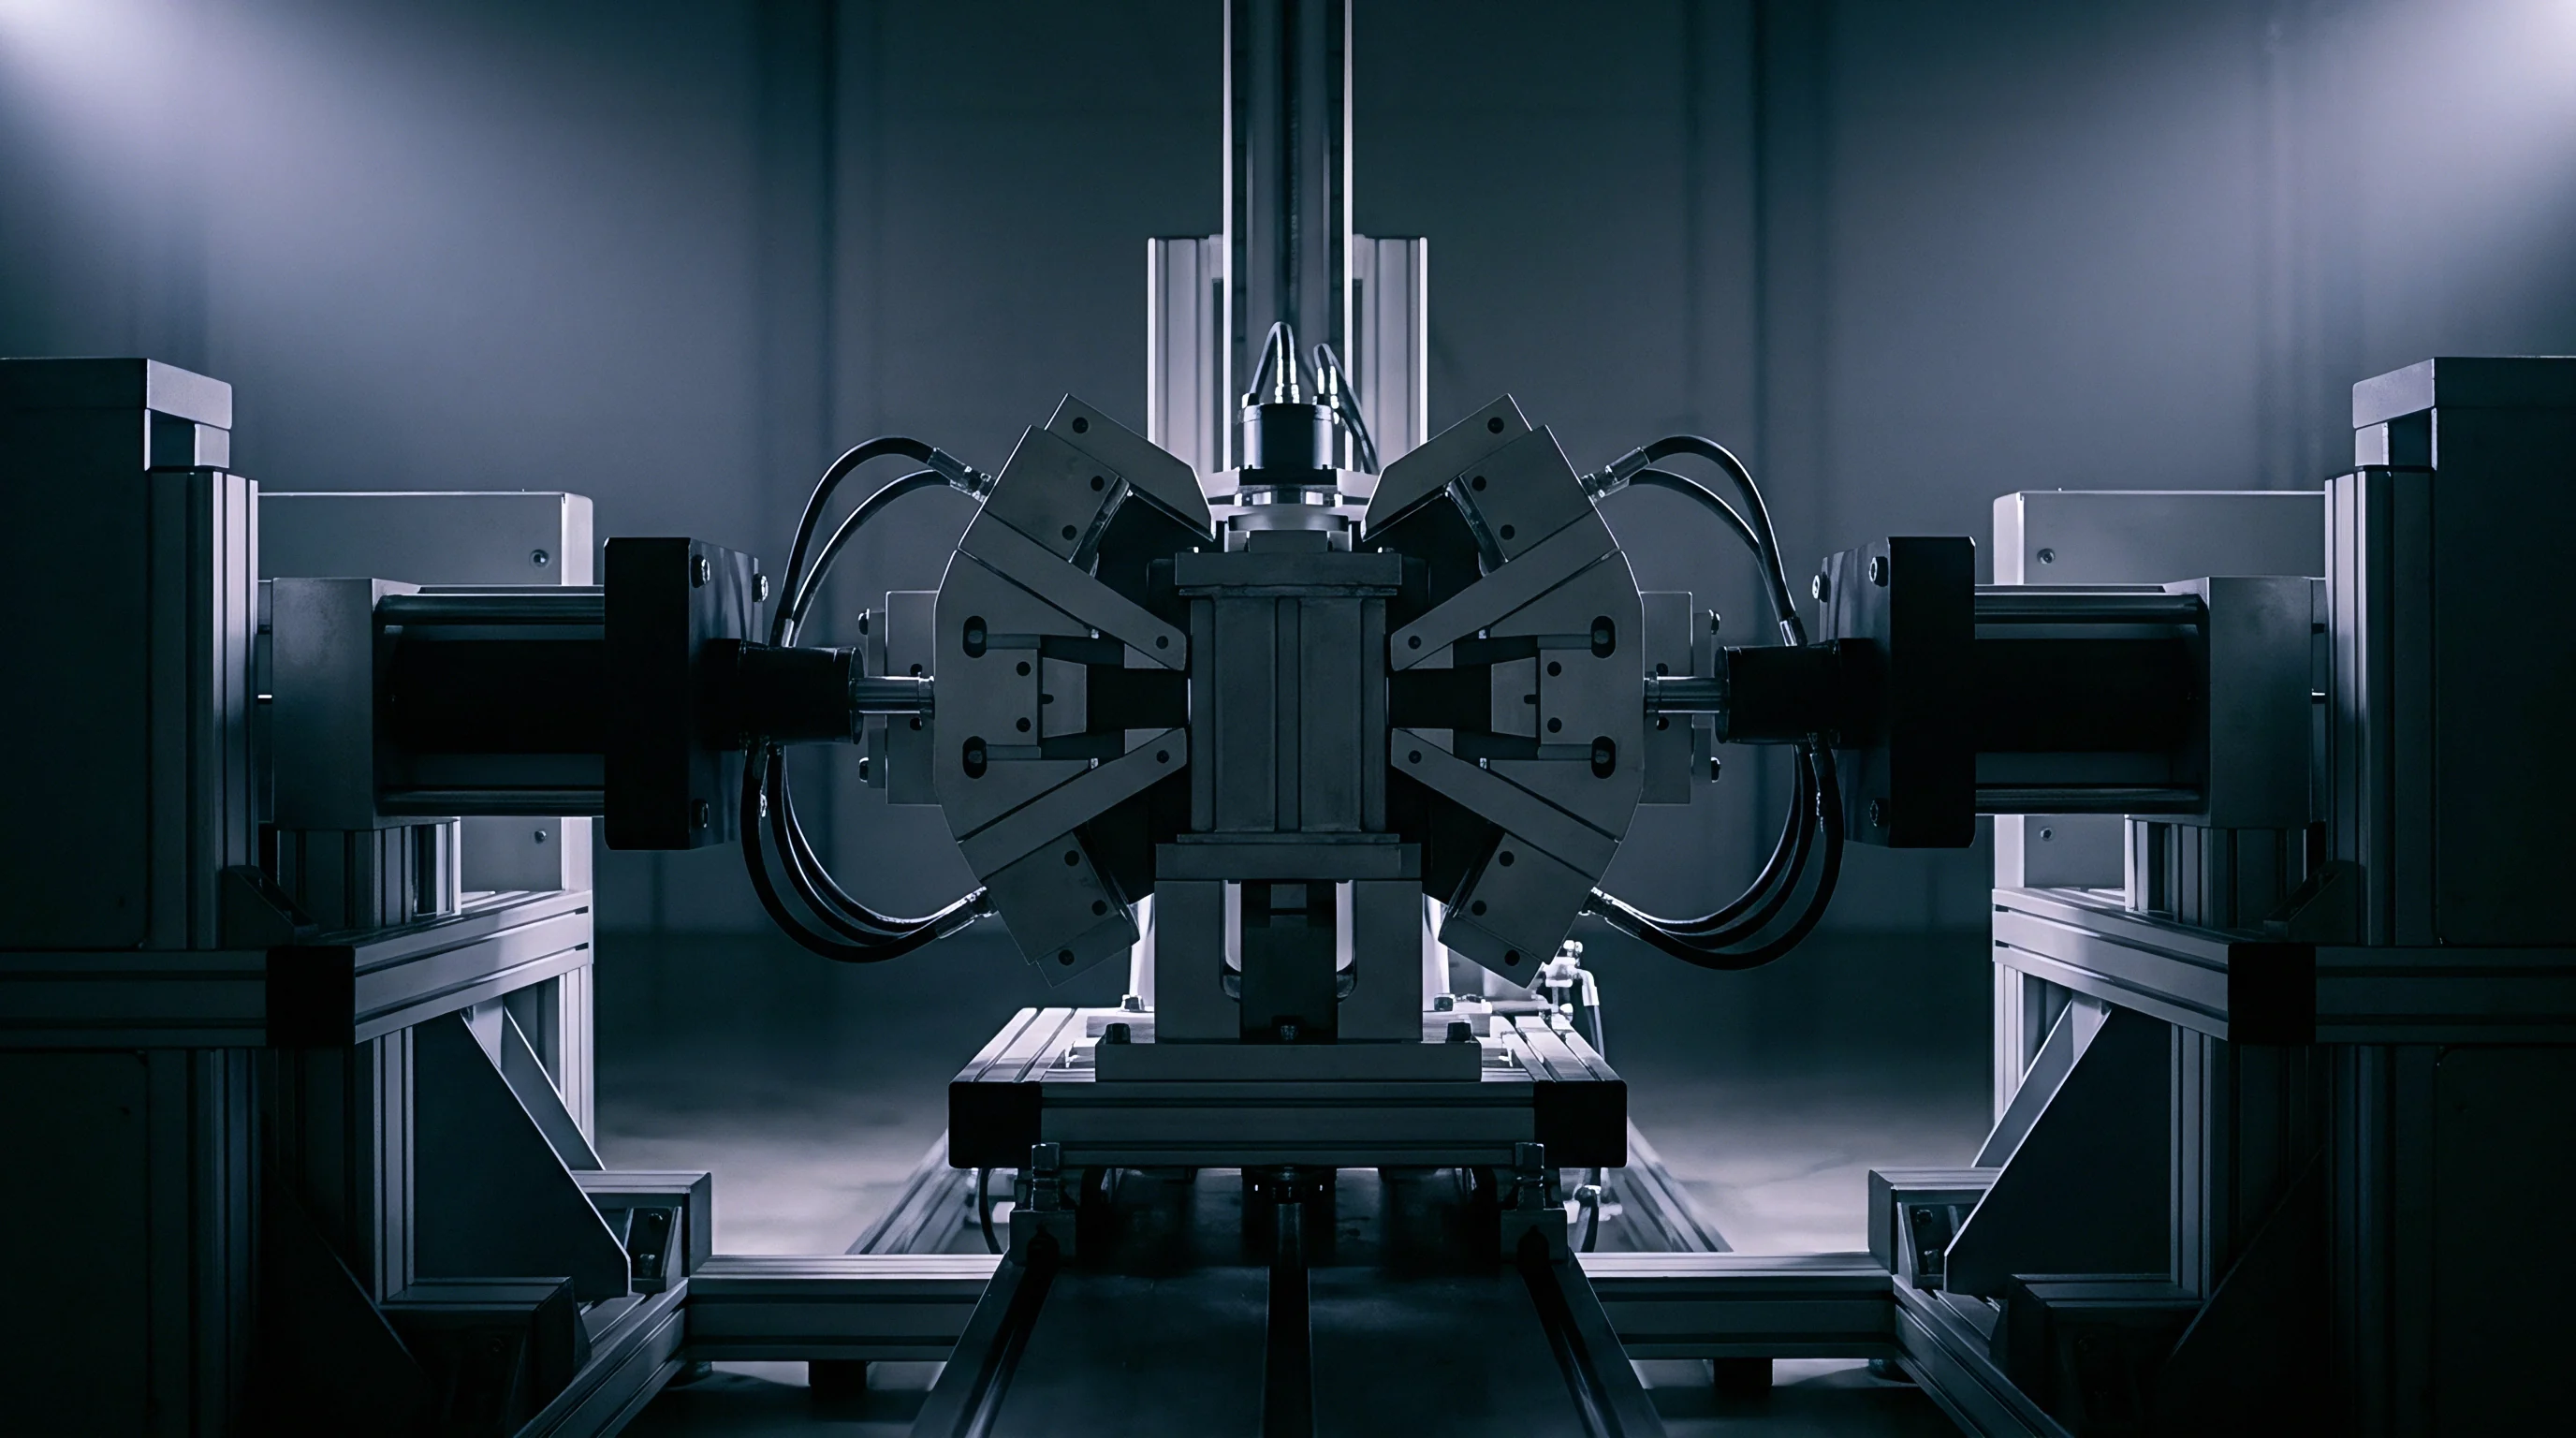
Lattice dimensions change continuously with lithium concentration within single-phase regions, producing internal Vegard stress gradients. As concentration gradients steepen near a moving phase interface, localized stress reaches a peak at particle surfaces. In polycrystalline particles, overlapping elastic strain fields from adjacent boundaries create mechanical resistance to further boundary motion.
At nanoscale particle dimensions, surface energy effects become prominent and shift phase stability windows. Smaller particles store less strain energy overall, which narrows the solid-phase voltage hysteresis gap. Synthesizing sub-100-nanometer particles lowers mechanical strain energy density enough to turn two-phase transitions into quasi-solid-solution behavior during fast cycling.
Coherency strain energy within active particle lattices forces a directional shift in phase transformation potential during current reversal.

Mechanical Failure and Plastic Relaxation
When accumulated strain exceeds the active material’s fracture toughness, micro-cracks form along grain boundaries and weak crystallographic planes. This cracking releases elastic strain energy, but exposes fresh surface area to side reactions with the electrolyte. Plastic deformation near phase boundaries also leaves irreversible dislocation arrays that permanently alter transformation energetics.
Repeated stress cycles degrade electrical contact between active particles and the conductive carbon matrix. Micro-cracks sever connections within primary particles, trapping lithium inside isolated domains and causing permanent capacity loss. High strain energy density also drives up cell impedance by continually exposing new surfaces to solid electrolyte interphase formation.
- Intergranular dislocation networks generate fixed stress fields that alter local chemical potential and pin moving phase boundaries.
- Micro-fracture propagation severs electronic pathways to active grain domains, permanently isolating active material.
- Anisotropic volume variation distorts secondary aggregate structures, opening channels for electrolyte to penetrate particle cores.
- Lattice shear localization causes permanent structural slip that shifts local phase transformation voltage thresholds.
Defect

Defect Pinning Kinetics at Phase Interfaces
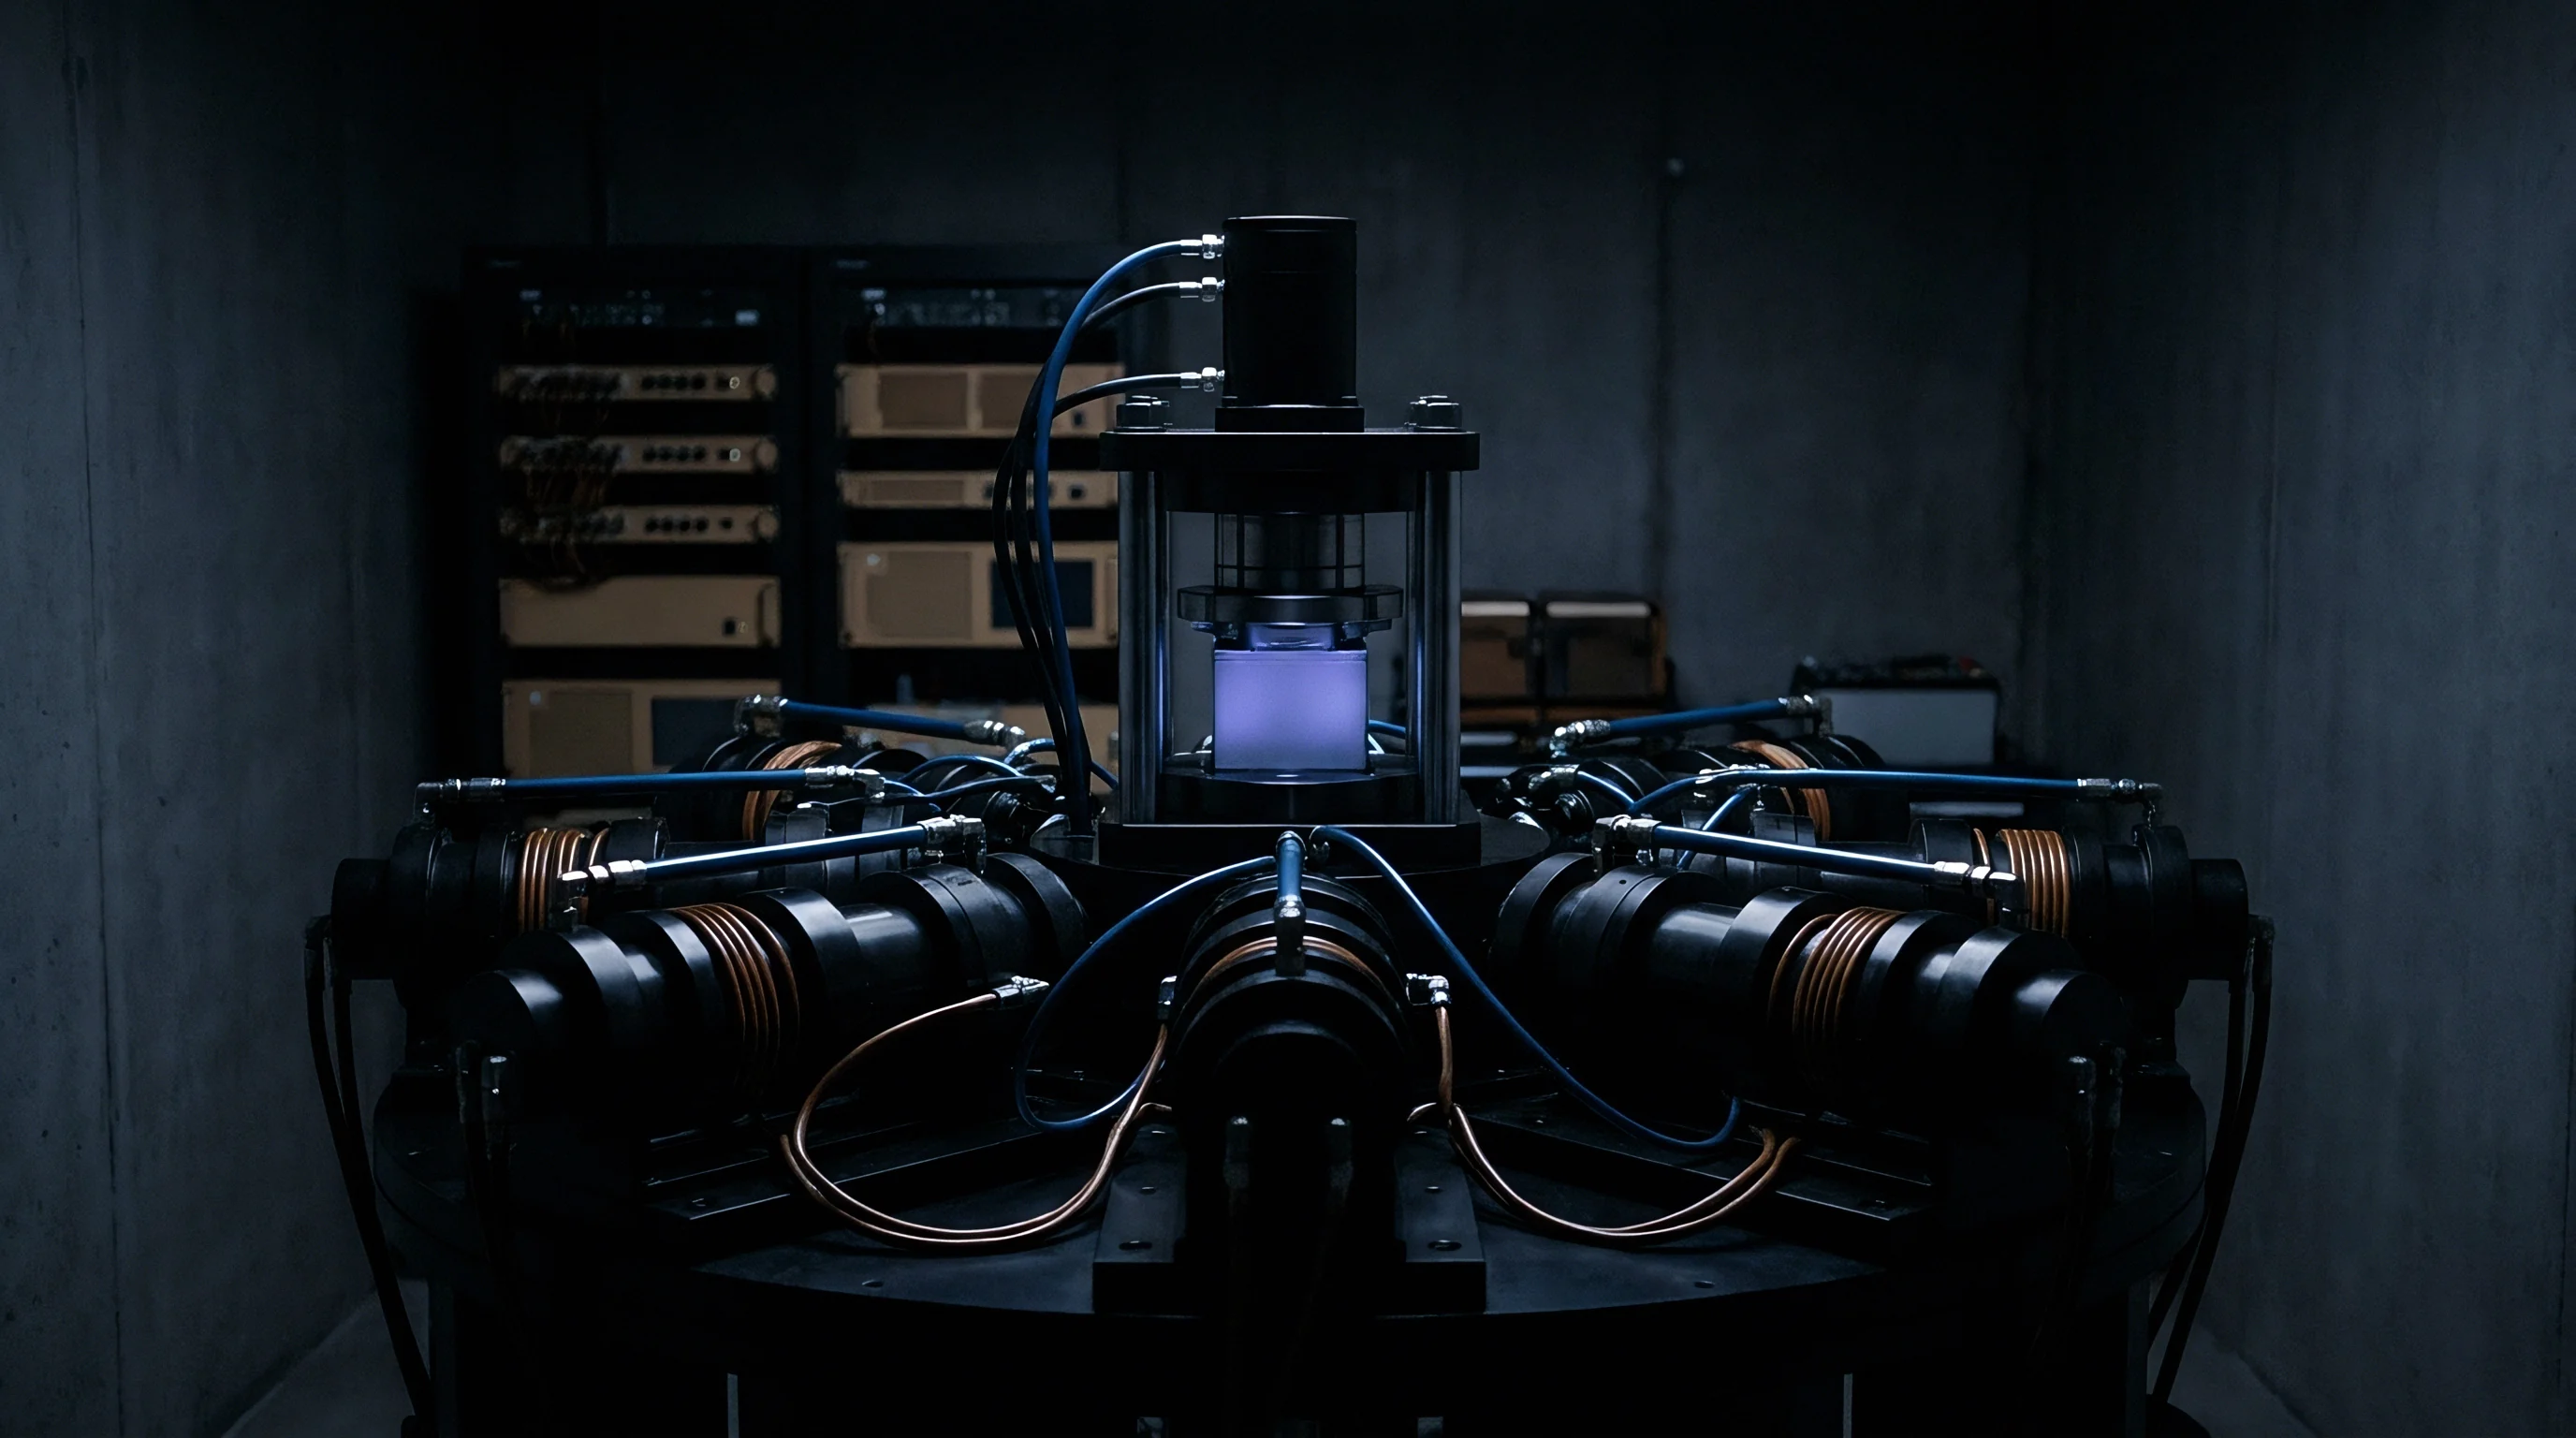
Crystalline defects in intercalation compounds create localized energy barriers that impede phase boundary movement. Point defects, anti-site pairs, and line dislocations disrupt the periodic lattice potential. As moving phase boundaries get caught in these local energy minima, the cell requires additional thermodynamic overpotential to detach the interface and continue phase propagation.
In olivine iron phosphate, iron-lithium anti-site defects block the one-dimensional lithium channels running along the b-axis. When anti-site defect concentrations exceed 1.5 percent, boundary pinning becomes frequent enough to demand higher chemical potential gradients. Phase interfaces jump discretely between pinning sites instead of advancing smoothly, producing microstructural jerks that show up as voltage noise in low-rate galvanostatic tests.

Why Do Microstructural Pinning Sites Reshape Potential Plateaus?
Pinning forces reshape macroscopic voltage plateaus by decoupling global state of charge from local thermodynamic phase fractions. When a phase boundary hits dense dislocations or grain boundaries, motion stops until external current builds enough local overpotential. The voltage plateau slants rather than staying flat because progressively higher driving forces are needed to force boundaries past microstructural obstacles.
Dislocation density grows over cycle life from repeated lattice strain, causing discharge plateaus to tilt further as the cell ages. Thermally aged cells show wider hysteresis gaps because defects aggregate into clusters that pose larger energy barriers than individual point defects. This pinning alters local lithium activity coefficients, shifting equilibrium voltage curves across the entire state-of-charge range.
Defect-pinned phase interfaces require elevated thermodynamic overpotential to escape local energy minima during phase transformation.

Interfacial Drag and Dislocation Dynamics
Phase boundary velocity scales non-linearly with applied chemical potential driving force because of microstructural drag. Solute atmospheres, point defect drag, and phonon dissipation all resist boundary motion. At high charge or discharge rates, interfacial drag outweighs solid-state diffusion resistance, pulling operating potentials farther from equilibrium.
Solute drag arises when point defects diffuse alongside a moving interface, creating a retarding force that scales with boundary speed. If the boundary accelerates past the defect diffusion rate, it breaks away from the solute cloud, producing transient voltage drops during high-rate current pulses. Microstructural features set the threshold speed for this breakaway, tying synthesis conditions directly to rate capability and thermal performance.
Poor temperature control during synthesis leads to high defect densities, which increases boundary migration resistance and accelerates capacity fade.


Titration

Separating Kinetic Overpotential from Thermodynamic Hysteresis
Galvanostatic Intermittent Titration Technique (GITT) measurements use current pulses separated by zero-current relaxation periods to determine transport properties and equilibrium potentials. Standard GITT analysis assumes that cell potential relaxes toward a single thermodynamic equilibrium state. Phase-separating electrodes break this assumption because boundary pinning and strain maintain a voltage offset even after kinetic overpotentials decay.
Kinetic overpotentials ~ covering ohmic drop, charge-transfer resistance, and solid-state diffusion ~ decay exponentially within minutes or hours after current stops. Thermodynamic hysteresis, by contrast, retains a constant voltage offset no matter how long the cell rests. Separating kinetic effects from thermodynamic gaps requires analyzing potential decay rates across multiple time scales to distinguish fast electrochemical relaxation from slow boundary movement and stress relaxation.
- Apply a C/50 galvanostatic charge pulse for 1 hour to advance cell state of charge by 2 percent.
- Interrupt current and record open-circuit potential every 10 seconds over a 4-hour relaxation period.
- Calculate logarithmic potential decay rate to identify the end of kinetic transport relaxation.
- Fit residual potential relaxation curves to a dual-exponential model to isolate phase-boundary relaxation.
- Repeat the pulse-relaxation sequence incrementally from zero state of charge to full charge capacity.
- Execute identical titration sequences during discharge to establish the steady-state hysteresis loop envelope.

Differential Capacity and Voltage Spectroscopy Analysis
Incremental capacity analysis converts flat voltage plateaus into clear differential capacity peaks. On dQ/dV curves, peak positions indicate transformation potentials, while peak areas correspond to phase transformation capacity. Solid-phase hysteresis shifts these peaks toward higher potentials on charge and lower potentials on discharge, producing a peak splitting that widens with higher strain energy density and defect concentrations.
Comparing peak separation across different C-rates separates structural hysteresis from kinetic polarization. Extrapolating dQ/dV peak positions to zero current gives the intrinsic thermodynamic voltage gap. Shifts in peak symmetry over cycle life point to microstructural damage like defect build-up or particle cracking, offering a non-destructive way to monitor solid-phase degradation in commercial cells.
| Electrode Chemistry Pair | Charge dQ per dV Peak Potential V | Discharge dQ per dV Peak Potential V | Apparent Voltage Gap at C per 20 mV | Thermodynamic Hysteresis Gap mV |
|---|---|---|---|---|
| LiFePO4 vs Graphite Stage 1 | 3.452 | 3.418 | 34 | 24 |
| LiFePO4 vs Li4Ti5O12 | 1.885 | 1.861 | 24 | 20 |
| Graphite Stage 2 to Stage 1 vs Li | 0.092 | 0.076 | 16 | 11 |
| LiNi0.6Mn0.2Co0.2O2 H1-H2 vs Li | 3.712 | 3.698 | 14 | 8 |
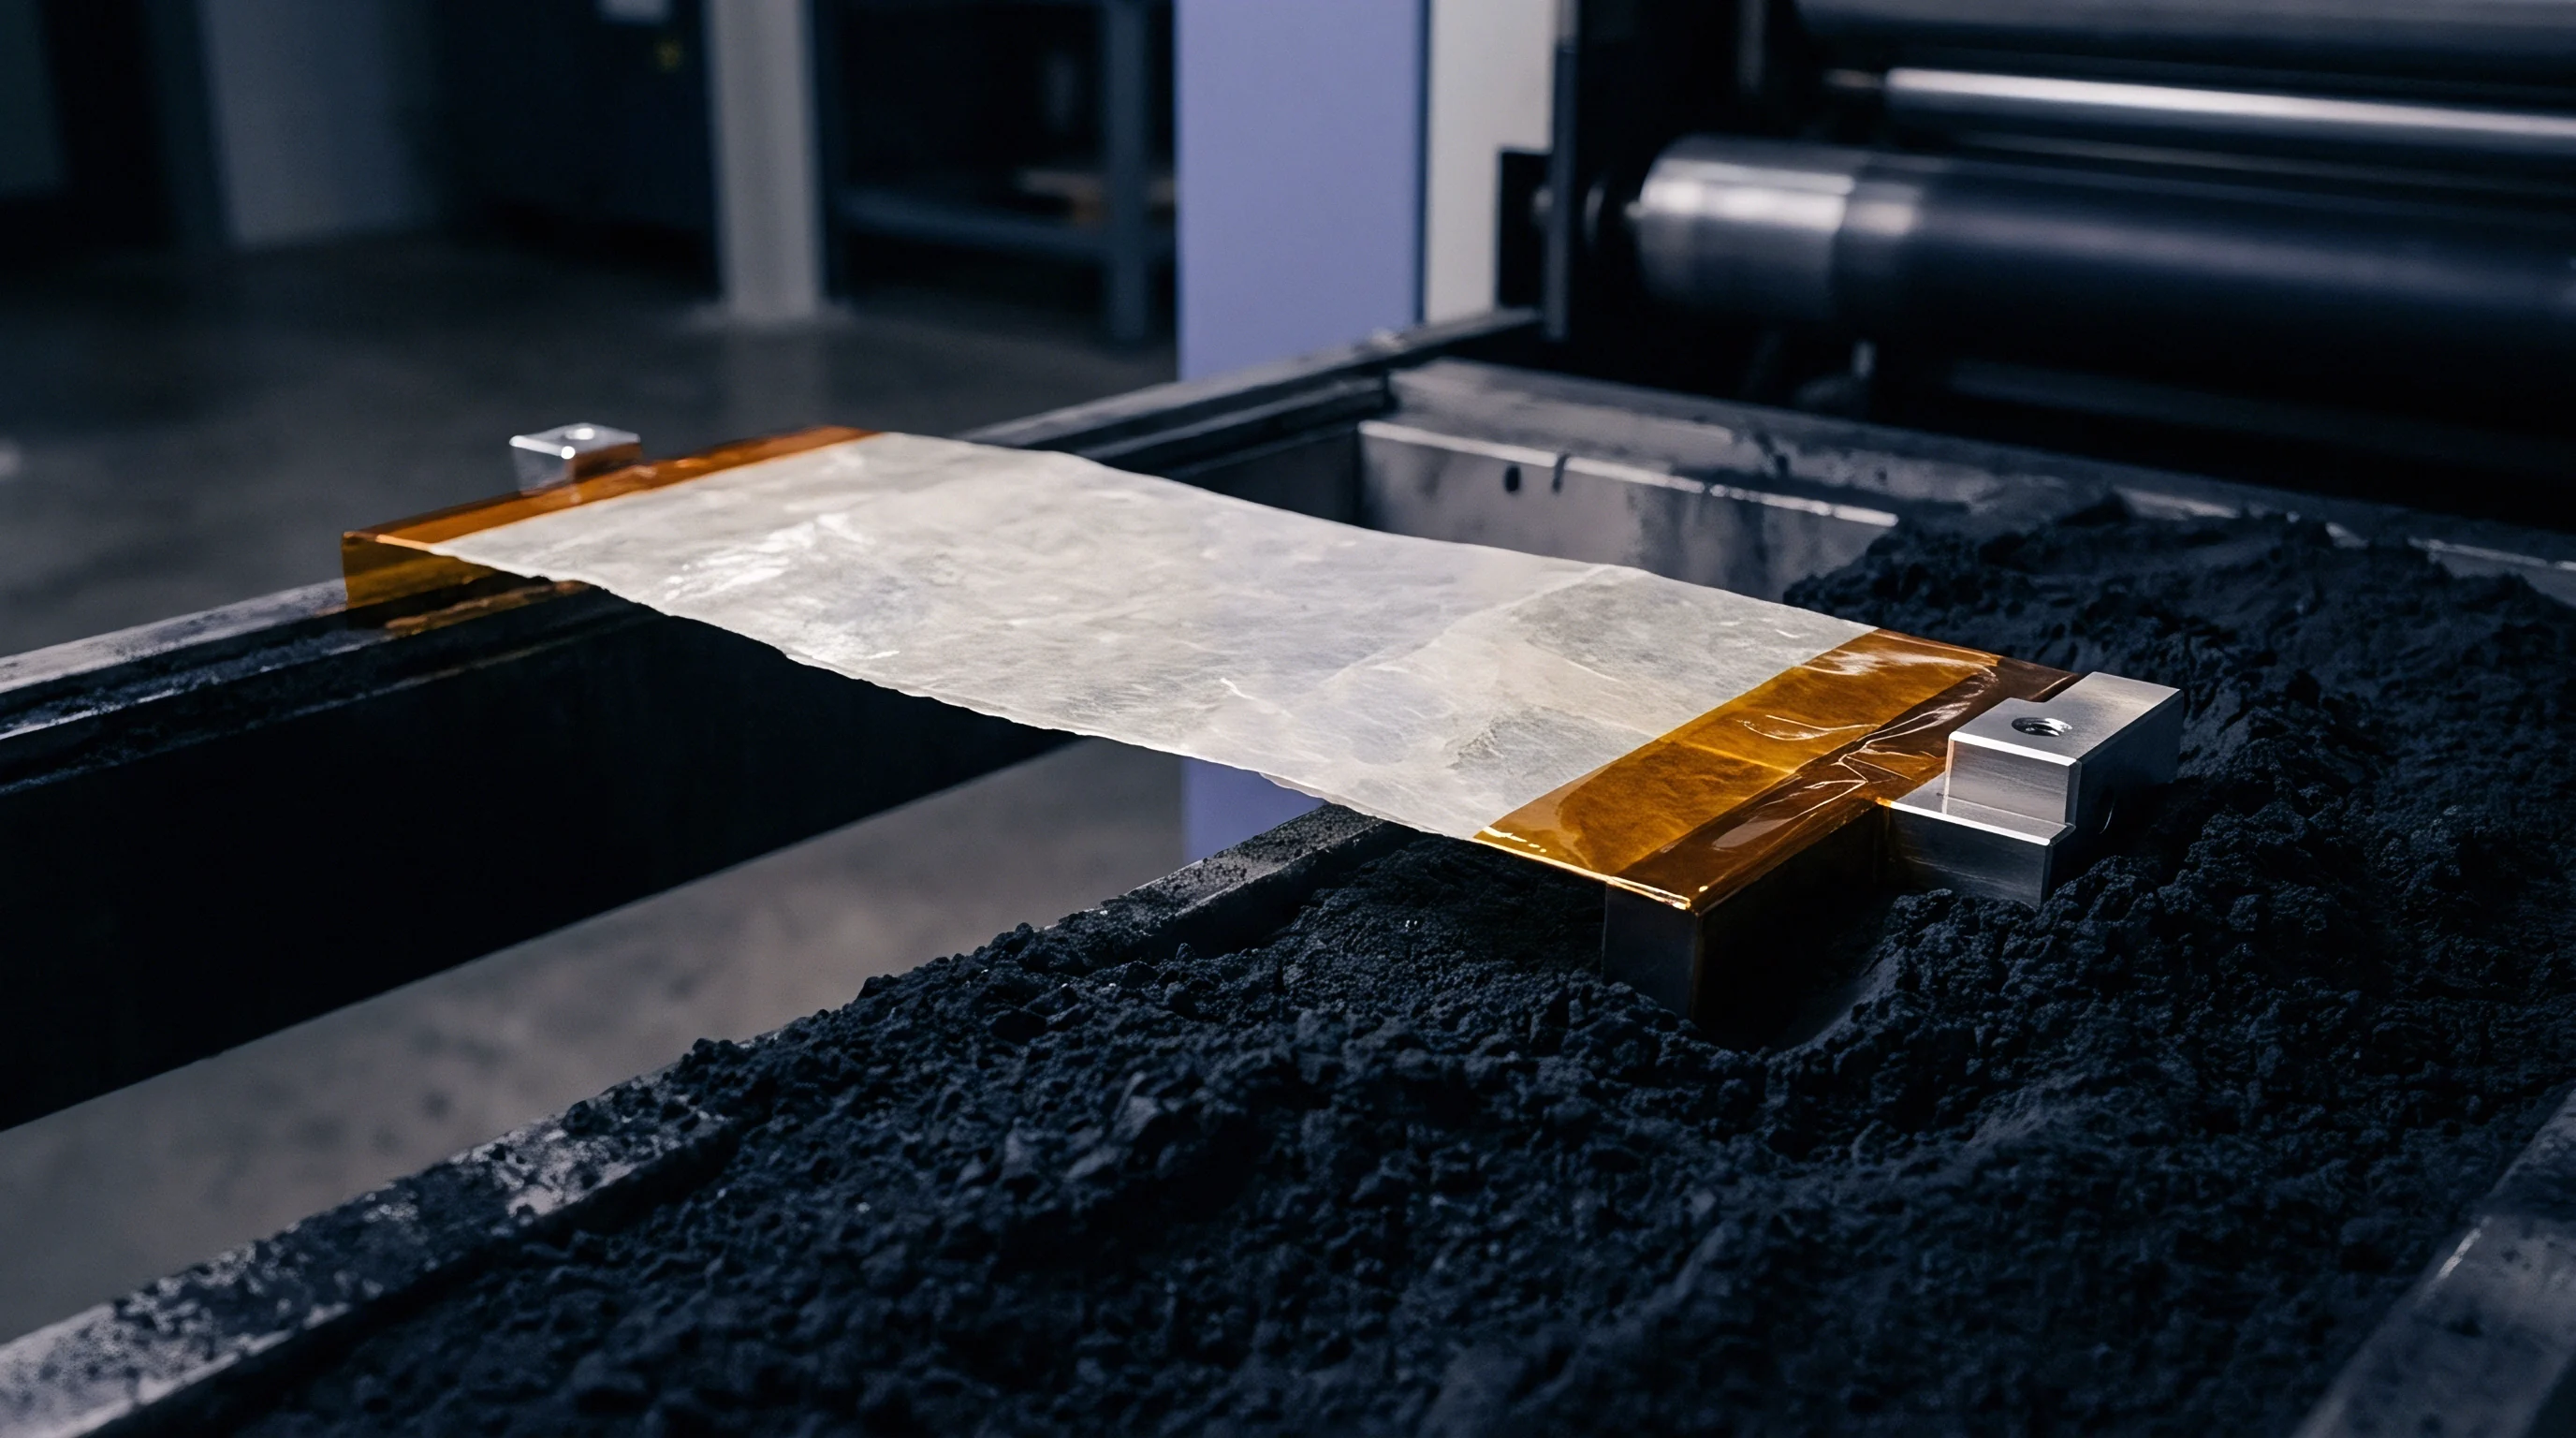
Relaxation Time Constants and Equilibrium Criteria
Determining true thermodynamic open-circuit voltage depends on setting clear relaxation criteria. Standard cell qualification routines often end relaxation when potential drift drops below 1 millivolt per hour, but solid-phase equilibration continues long after. Voltage relaxation in two-phase electrodes follows logarithmic time dependencies that persist for days after current stops.
Using raw, unextrapolated relaxation data distorts equilibrium potential curves and introduces systematic errors into state-of-charge lookup tables. Fitting logarithmic relaxation data with non-linear models allows prediction of infinite-time asymptotic voltage limits, cutting test wait times while capturing true solid-phase equilibrium profiles.
Persistent open-circuit voltage differences between charge and discharge paths are often attributed to slow diffusion relaxation rather than solid-phase energy barriers.


Calibration

State of Charge Estimator Errors in Hysteresis-Prone Chemistries
Battery management systems use open-circuit voltage lookup tables to estimate state of charge during rest periods. For materials with flat transformation plateaus and low voltage slopes, small voltage errors translate into large state-of-charge errors. A 10-millivolt voltage offset on a flat 30-millivolt hysteresis plateau can cause state-of-charge estimation errors exceeding 25 percent in iron phosphate packs.
Standard Extended Kalman Filters struggle with phase-separating chemistries because OCV-SOC mapping becomes multi-valued or non-monotonic in the presence of hysteresis. Estimators that rely on a single static voltage curve drift significantly during micro-cycling, where partial charge-discharge events move the cell along minor internal loops instead of the outer boundary curves.
Static open-circuit voltage tables cause severe state-of-charge errors when applied to phase-separating materials without hysteresis state tracking.

Hysteresis Modeling in Battery Management Systems
Accurate state-of-charge tracking requires mathematical hysteresis models built into battery management software. Preisach models and Prandtl-Ishlinskii operators represent hysteresis by combining outputs from multiple elementary operators with different switching thresholds. These models track minor loop trajectories during irregular charge-discharge patterns common in electric vehicle regenerative braking and solar storage systems.
Implementing state-space hysteresis models increases memory and processing demands on microcontrollers. Embedded processors must track a state variable representing phase history, adjusting open-circuit voltage estimates based on current direction, depth of discharge, and cumulative micro-cycling throughput. Leaving out hysteresis compensation forces pack designers to hold larger buffer margins to prevent unexpected cell depletion.
- Preisach distribution weighting matrices map complex minor loop trajectories during partial charge and discharge events.
- Temperature-dependent switching parameters adjust open-circuit potential boundaries as thermal conditions change solid-state mobility.
- Continuous state tracking functions update internal phase fraction variables to maintain voltage mapping accuracy during dynamic duty cycles.
- Dynamic relaxation compensation algorithms predict asymptotic open-circuit voltage values from short-duration rest periods.

Thermal Dissipation and Micro-Cycling Energy Losses
Thermodynamic phase hysteresis represents lost energy dissipated as heat during phase transformation cycles. Unlike ohmic losses, which scale with the square of current density, hysteresis loss per cycle remains finite even as current approaches zero. Every full phase transition converts a fixed amount of chemical energy into heat, regardless of charge or discharge rate.
Micro-cycling around phase transition points produces continuous background heat in grid storage systems. Uncounted heat from solid-phase hysteresis increases cooling power demand and accelerates thermal aging. Thermal management algorithms need to account for solid-phase hysteresis losses alongside resistive heating to maintain uniform pack temperatures.
| Cell Chemistry | Hysteresis Plateau Width mV | Uncompensated SOC Error Percent | Compensated SOC Error Percent | BMS RAM Requirement Bytes per Cell |
|---|---|---|---|---|
| LiFePO4 to Graphite | 32 | 18.5 | 2.1 | 256 |
| Li4Ti5O12 to NMC532 | 18 | 9.2 | 1.4 | 128 |
| High-Nickel NMC to Graphite | 12 | 4.1 | 0.8 | 64 |
| LFP to LTO Dual-Phase | 48 | 26.4 | 2.8 | 512 |
Per IEC 62660-1 section 6.2, capacity verification testing requires resting cells for a minimum of 4 hours at ambient temperature following complete charge or discharge cycles to eliminate kinetic polarization prior to performance quantification.

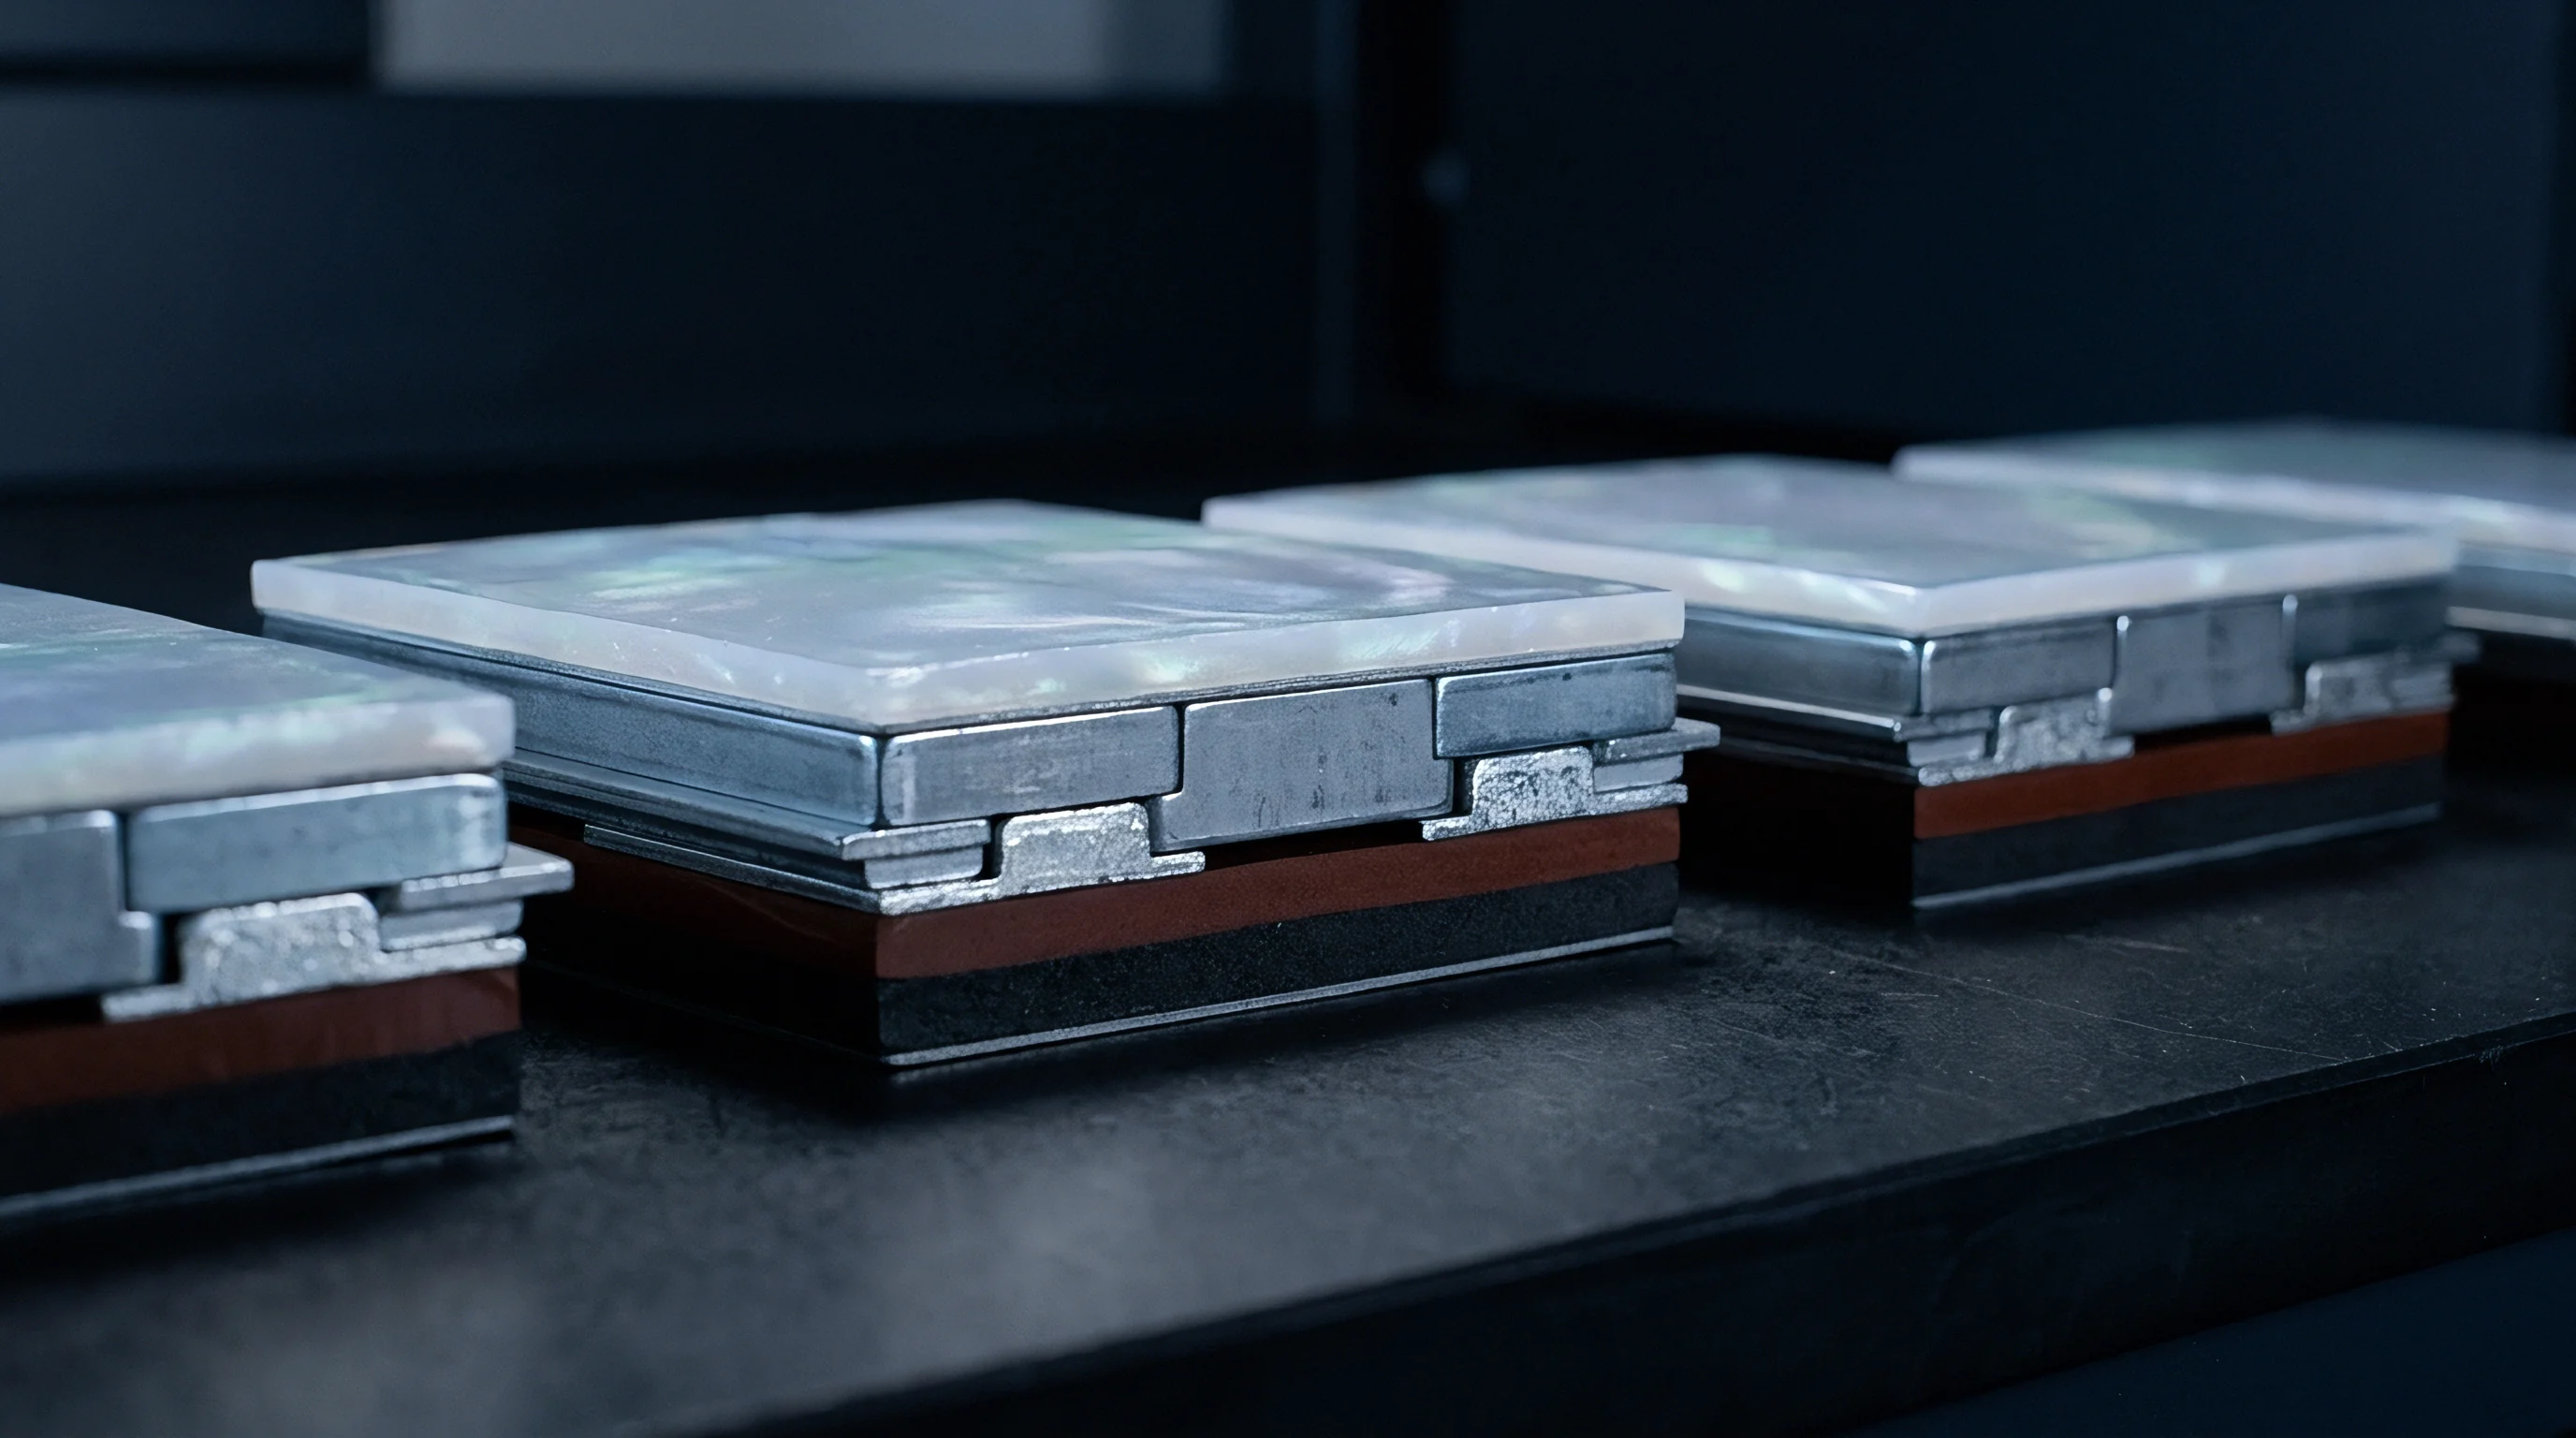
Exposure

Landed Cost per Delivered Cycle under Phase Hysteresis Losses
Solid-phase hysteresis directly reduces round-trip efficiency, raising operating costs over the life of stationary storage and commercial vehicle fleets. A battery system experiencing a 30-millivolt hysteresis loss on a 3.2-volt nominal plateau incurs an immediate 0.94 percent thermodynamic efficiency penalty before accounting for ohmic, diffusion, or auxiliary system losses. Over a 6,000-cycle lifetime, this loss accumulates into substantial costs per megawatt-hour of installed capacity.
Consider a 100-megawatt-hour energy storage installation running one full cycle per day at an electricity cost of 0.08 USD per kilowatt-hour. An uncompensated solid-phase hysteresis penalty of 0.94 percent dissipates 940 kilowatt-hours of energy daily as heat. Over a 15-year operational lifetime, cumulative hysteresis losses reach 5.14 gigawatt-hours ~ a direct financial loss of 411,200 USD per 100 megawatt-hours of storage capacity.

Cell Grading Distortions in Factory Production Lines
High-throughput end-of-line testing in automated manufacturing measures cell capacity and open-circuit voltage using fast charge-discharge protocols with brief rest periods. Testing phase-separating chemistries before complete relaxation creates artificial capacity variations based on recent current history. Cells rested after charging show higher open-circuit voltages than those rested after discharging, leading to misclassification during capacity and impedance grading.
When misgraded cells are assembled into high-voltage strings, early capacity imbalances develop during operation. Modules built with cells of mixed phase history experience localized over-charging and over-discharging during normal cycling, accelerating degradation and triggering premature management system faults. Production grading protocols must use standardized pre-conditioning steps to clear solid-phase history before measuring sorting parameters.

Warranty Exposure and Procurement Specifications
Standard commercial procurement specifications define capacity, energy, and round-trip efficiency using simple constant-current tests. Omitting pre-test rest durations, current history, and relaxation criteria allows delivery of cells that meet nominal targets under simple lab conditions but lag during dynamic field operation. Buyers of phase-separating cells face warranty exposure when field efficiency drops below contractual performance guarantees.
Including explicit solid-phase hysteresis metrics in procurement contracts protects buyers from high-defect, high-strain active materials. Contract clauses should cap open-circuit voltage hysteresis gaps measured under standardized micro-ampere GITT conditions. Procurement specs need to mandate explicit BMS hysteresis algorithms and set thermal dissipation limits under defined micro-cycling patterns to protect long-term economics.
Quantifying solid-phase hysteresis parameters during cell qualification lets pack engineers design accurate state-of-charge algorithms, establish thermal management limits, and build realistic efficiency models before committing to volume production orders.