Micro Crack Stress Intensity Analysis under Cyclic Biaxial Strain
Biaxial strain ratios above 0.5 accelerate sub-micron micro-crack growth rates by three orders of magnitude in lithiated silicon-graphite active material coatings.


Flaw
Lithium intercalation into high-capacity active material particles generates discrete volumetric strain gradients across crystal boundaries during galvanostatic charging. When an electrode structure experiences mechanical restraint inside a rigid pack enclosure, isotropic particle expansion converts into a complex biaxial stress state within the composite coating plane. Micro-voids and lattice dislocations act as stress concentrators where local mechanical energy density exceeds the critical fracture toughness of the lithiated phase.
Unchecked strain cycling turns these microscopic defects into self-propagating micro-cracks that sever electrical contact paths between secondary particle agglomerates and the surrounding conductive binder matrix.
Crack tips concentrate stress. In silicon-graphite composite anodes, volumetric expansion during lithiation reaches three hundred percent at full state of charge. Secondary nickel-rich cathode active materials undergo anisotropic unit cell contractions along the c-axis during high-voltage operation, creating intense intergranular micro-shear.
These sub-micron stress fields interact with planar boundaries, giving rise to micro-crack nucleation long before macro-scale electrode delamination manifests in capacity retention testing.

Sub Micron Shear Stress Fields
In-plane restraint converts bulk volumetric breathing into localized biaxial strain fields across the electrode thickness. Active material particles bonded to copper or aluminum current collectors cannot expand freely along the planar axes. The current collector substrate imposes a rigid geometric constraint that generates severe shear stresses at the active layer interface.
Volume swings drive fatigue. Micro-voids coalesce rapidly. Under cyclic charging, these interfacial shear stresses force sub-micron defects to open along primary crystal slip planes and phase boundaries.
The severity of micro-crack propagation depends directly on the ratio of orthogonal in-plane stresses (η = σ2 / σ1). Uniaxial testing fails to capture particle rupture mechanics because secondary transverse stresses lower the threshold stress intensity factor (Kth) required for fatigue crack growth. When the biaxial stress ratio approaches unity, crack tips experience elevated hydrostatic tension, suppressing localized plastic deformation in metal current collectors and accelerating brittle cleavage across ceramic active particles.

Initiation Pathways in High Silicon Anodes
Silicon domains embedded within carbonaceous matrices expand during lithiation, generating radical pressure fields against adjacent graphite flakes and polymeric binders. Repeated expansion and contraction cycles induce low-cycle fatigue within the elastomeric binder network, degrading its elastic recovery capacity. Fracture mechanics governs damage.
Micro-cracks initiate at sharp particle corners and void inclusions, propagating rapidly across neighboring material domains during subsequent discharge phases.
Structural failure follows micro-cracking. Liquid electrolyte penetrates newly exposed micro-crack faces, initiating secondary solid-electrolyte interphase formation within the particle interior. Consumption of active lithium ions during continuous solid-electrolyte interphase reconstruction permanently degrades cell coulombic efficiency while simultaneously consuming accessible electrolyte volume.
The resulting impedance growth shifts operating potential windows, further exacerbating localized stress concentration at particle surfaces.
- Primary cleavage planes open along grain boundaries in nickel-rich cathodes due to lattice parameter mismatches during phase transitions.
- Interphase boundary separation weakens the structural adhesion between active coating layers and current collector foils under transverse strain gradients.
- Collector foil necking occurs when localized plastic deformation in thin copper substrates concentrates cyclic fatigue damage under constrained cell expansion.
- Delamination wave fronts propagate laterally from particle rupture points, isolating active coating domains from electron transport networks.
Unchecked micro-crack coalescence lowers cell retention below standard thresholds and voids structural integrity across the pack lifecycle.

Tensor
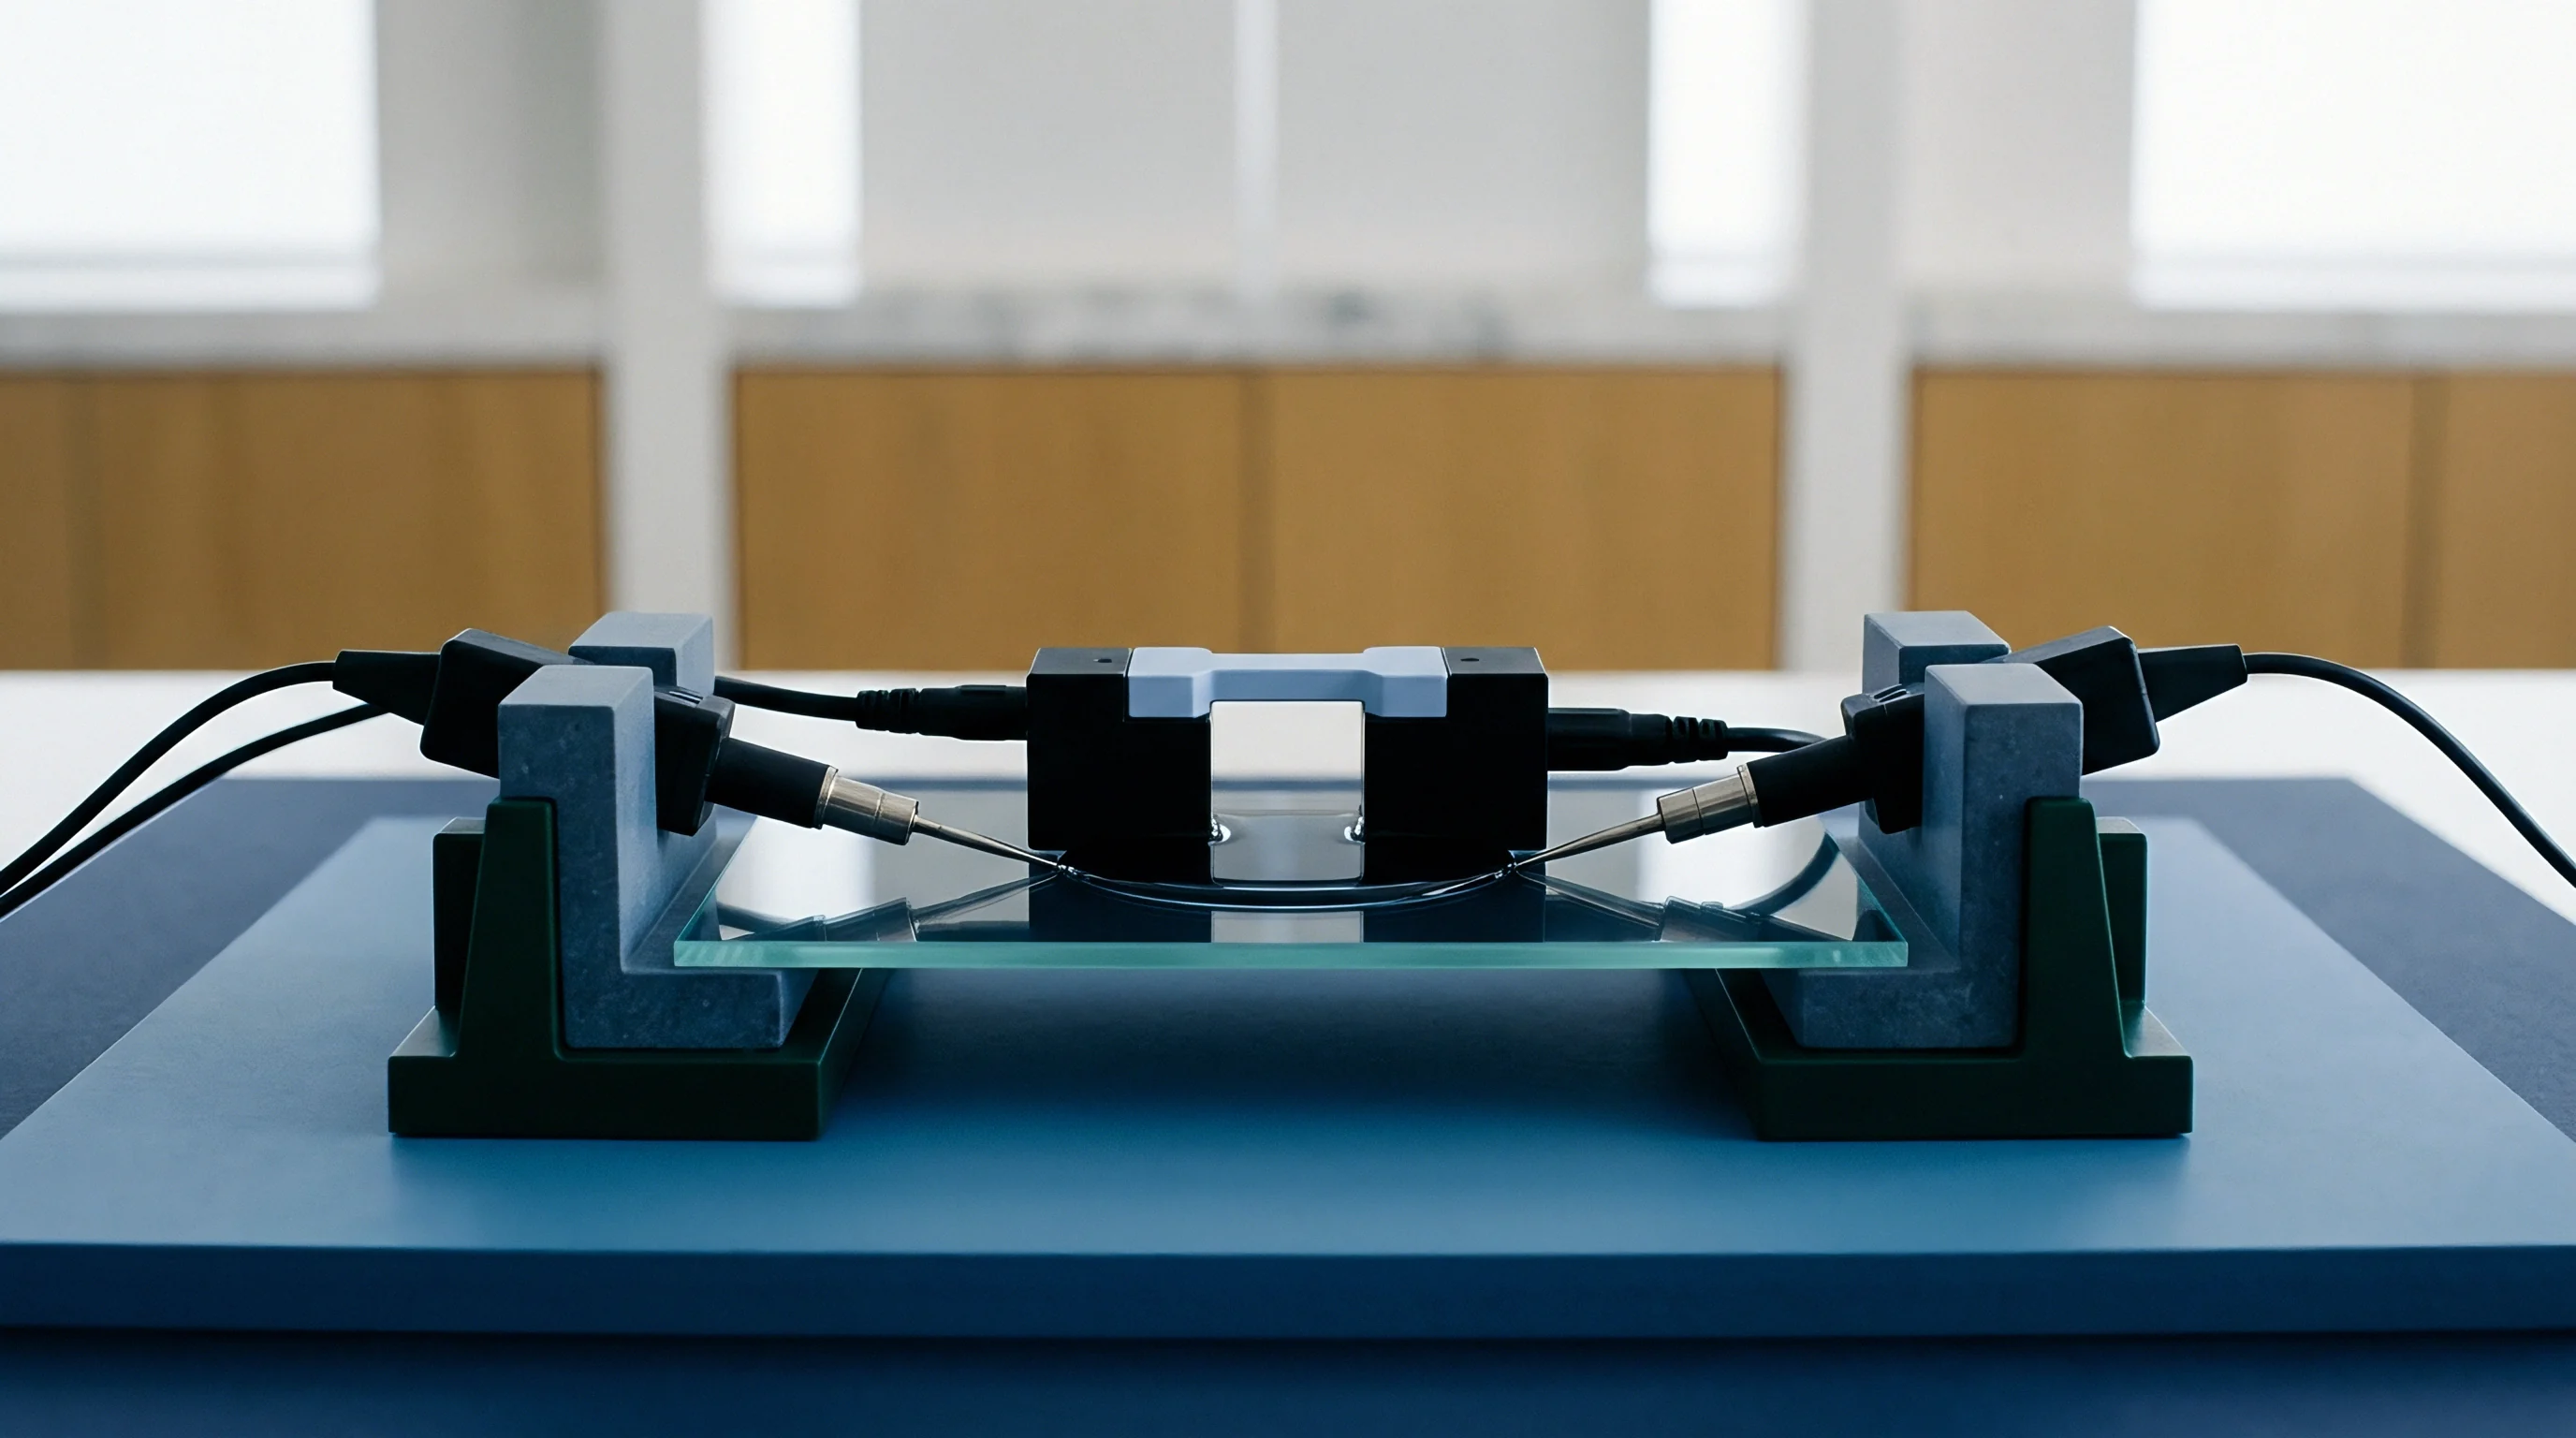
Mathematical modeling of micro-crack stress intensity under cyclic biaxial strain relies on mixed-mode linear elastic fracture mechanics modified for anisotropic electro-chemo-mechanical swelling. The stress field at a sub-micron crack tip subjected to simultaneous in-plane stresses σ1 and σ2 requires evaluating Mode I (opening) and Mode II (in-plane shear) stress intensity factors (KI and KII). Pouch cells expand laterally.
Mechanical pre-stress alters growth. The planar stress tensor boldsymbolσ within the electrode coating plane takes the matrix form:
boldsymbolσ = beginbmatrix σ1 & τ12 \ τ21 & σ2 endbmatrix
Where σ1 represents the principal stress along the primary restraint axis, σ2 represents the orthogonal in-plane stress imposed by housing boundary conditions, and τ12 represents the shear stress induced by localized current density non-uniformities.

Mixed Mode Stress Intensity Calculation
For an internal micro-crack of length 2a oriented at an angle thη relative to the primary stress axis σ1, the Mode I and Mode II stress intensity factors are expressed through modified isotropic continuum formulations:
KI = sqrtπ a · left( σ1 cos2thη + σ2 sin2thη right) · Y1
KII = sqrtπ a · left( (σ1 – σ2) sinthη costhη right) · Y2
Where Y1 and Y2 are geometric correction factors accounting for boundary proximity and adjacent particle crowding within the composite electrode assembly. The equivalent stress intensity factor range Δ Keq governing cyclic fatigue crack growth per cycle (dN) follows the generalized Paris law derivative:
fracdadN = C · (Δ Keq)m
Where C and m are empirical material constants derived under controlled environmental conditions, and Δ Keq combines mode contributions according to:
Δ Keq = sqrtΔ KI4 + 8 Δ KII40.25
Biaxial strain ratios exceeding 0.7 increase equivalent stress intensity ranges by 140 percent compared to uniaxial fatigue under identical volumetric lithium expansion.

Worked Calculation of Biaxial Crack Growth Rate
Take an active material layer containing a pre-existing micro-defect with crack length a = 1.2 μm located at an orientation angle thη = 45circ. Assume the cell enclosure imposes a principal cyclic stress σ1 oscillating between 20 MPa and 120 MPa, alongside an orthogonal stress σ2 oscillating between 10 MPa and 60 MPa during full state-of-charge swings, giving a biaxial ratio η = 0.50. Assume geometric factors Y1 = 1.12 and Y2 = 1.00, with Paris law parameters C = 3.5 × 10⁻¹¹ m/cycle · (MPa·m1/2)-m and exponent m = 3.2.
Evaluating stress ranges yields Δ σ1 = 100 MPa and Δ σ2 = 50 MPa. Substituting these values into the stress intensity formulas:
Δ KI = sqrtπ · 1.2 × 10⁻⁶ · left( 100 · cos2(45circ) + 50 · sin2(45circ) right) · 1.12 = 0.163 MPa·m1/2
Δ KII = sqrtπ · 1.2 × 10⁻⁶ · left( (100 – 50) sin(45circ) cos(45circ) right) · 1.00 = 0.049 MPa·m1/2
Combining modes into the equivalent stress intensity range:
Δ Keq = left( (0.163)4 + 8 · (0.049)4 right)0.25 = 0.168 MPa·m1/2
Calculating micro-crack growth rate per cycle:
fracdadN = 3.5 × 10-11 · (0.168)3.2 = 1.18 × 10⁻¹³ m/cycle = 0.118 nm/cycle
Over one thousand full charge-discharge cycles, this single micro-defect extends by 118 nm, representing a ten percent increase in crack length that accelerates localized current density crowding around the crack tip.
| Material Phase | Young Modulus (GPa) | Fracture Toughness K1c (MPa m1/2) | Biaxial Stress Ratio | Threshold Delta Kth (MPa m1/2) | Paris Exponent m |
|---|---|---|---|---|---|
| Silicon (Lithiated Li15Si4) | 35.0 ± 3.0 | 0.85 ± 0.10 | 0.80 | 0.12 ± 0.02 | 3.8 |
| Graphite (Lithiated LiC6) | 15.0 ± 2.0 | 1.20 ± 0.15 | 0.40 | 0.25 ± 0.03 | 2.9 |
| NMC-811 Secondary Particle | 130.0 ± 10.0 | 1.45 ± 0.12 | 0.65 | 0.31 ± 0.04 | 3.4 |
| LFP Primary Crystallite | 110.0 ± 8.0 | 1.90 ± 0.18 | 0.30 | 0.48 ± 0.05 | 2.6 |
Whether anisotropic diffusion-induced stresses fully decouple from external mechanical constraint across ultra-high-rate fast charging regimens remains an open analytical question.


Grain
Microstructural grain boundary orientation dictates local fracture vulnerability within polycrystalline cathode materials and composite anodes. Primary crystallites within secondary NMC particles feature anisotropic thermal and mechanical expansion coefficients along different crystallographic directions. During lithiation, lithium concentration gradients establish intense localized stress peaks across grain boundaries.
Thermal gradients amplify biaxiality. Shear stresses induce delamination. When biaxial external strain couples with internal grain misalignment, stress intensity factors exceed critical fracture toughness (KIc) values at low state-of-charge thresholds.

Secondary Particle Pulverization Mechanisms
Polycrystalline spherical agglomerates undergo severe intergranular micro-cracking during deep cycling. As lithium ions exit the crystal lattice, individual grains contract unevenly, inducing micro-shear along adjacent grain interfaces. Secondary particles fracture internally.
External biaxial pre-load forces these internal intergranular cracks to open into radial fissures that breach the particle surface.

How Do Biaxial Strain Ratios Accelerate Particle Pulverization?
Elevated biaxial strain ratios accelerate particle pulverization by increasing the strain energy density stored within individual grain boundary networks. Unconstrained particles dissipate swelling strain through uniform outward expansion. Constrained particles subject to orthogonal planar compression cannot displace material laterally.
Micro-voids coalesce rapidly. Internal hydrostatic tension increases exponentially, causing multi-site micro-crack initiation across internal crystallite boundaries.
Electrolyte intrusion into internal grain networks establishes secondary passivation surfaces, permanently isolating active cathode domains. Secondary particle integrity degrades rapidly under continuous high-rate charging, converting spherical structures into fragmented arrays of primary crystallites with poor inter-particle electronic conductivity.
Standard UN 38.3 mechanical testing omits low-amplitude cyclic biaxial strain regimes, leaving fatigue-driven electrode micro-fracturing unmonitored until field capacity degradation occurs.
| Cell Format | Anode Active Chemistry | Coating Thickness (um) | Max Planar Biaxial Strain (%) | Cohesion Energy Rate (J/m2) | Dominant Failure Mode |
|---|---|---|---|---|---|
| Pouch High Energy | Silicon-Graphite (15% Si) | 75 ± 3 | 2.8 ± 0.3 | 12.5 ± 1.2 | Interface Delamination |
| Prismatic Power Cell | Synthetic Graphite | 60 ± 2 | 1.2 ± 0.1 | 18.2 ± 1.5 | Foil Surface Fatigue |
| Cylindrical 21700 | Silicon Composite (5% Si) | 68 ± 2 | 1.9 ± 0.2 | 15.4 ± 1.1 | Intergranular Cleavage |
Cell design engineers select material parameters based on specific trade-offs between mechanical robustness and volumetric energy density.
- Particle morphology selection prioritizes single-crystal architectures to eliminate intergranular cleavage planes in high-nickel cathodes.
- Binder elastomeric elasticity maintains structural adhesion across particle surfaces during high-amplitude expansion cycles.
- Current collector surface texturing increases mechanical interlocking forces at the active material interface to resist shear delamination.
- Module clamping spring rates balance cell breathing accommodation against excessive volumetric swelling under structural pre-loads.
Cell manufacturers frequently attribute secondary particle fracturing to unavoidable chemical phase transformations during initial formation cycling rather than structural coating deficiencies.

Screen
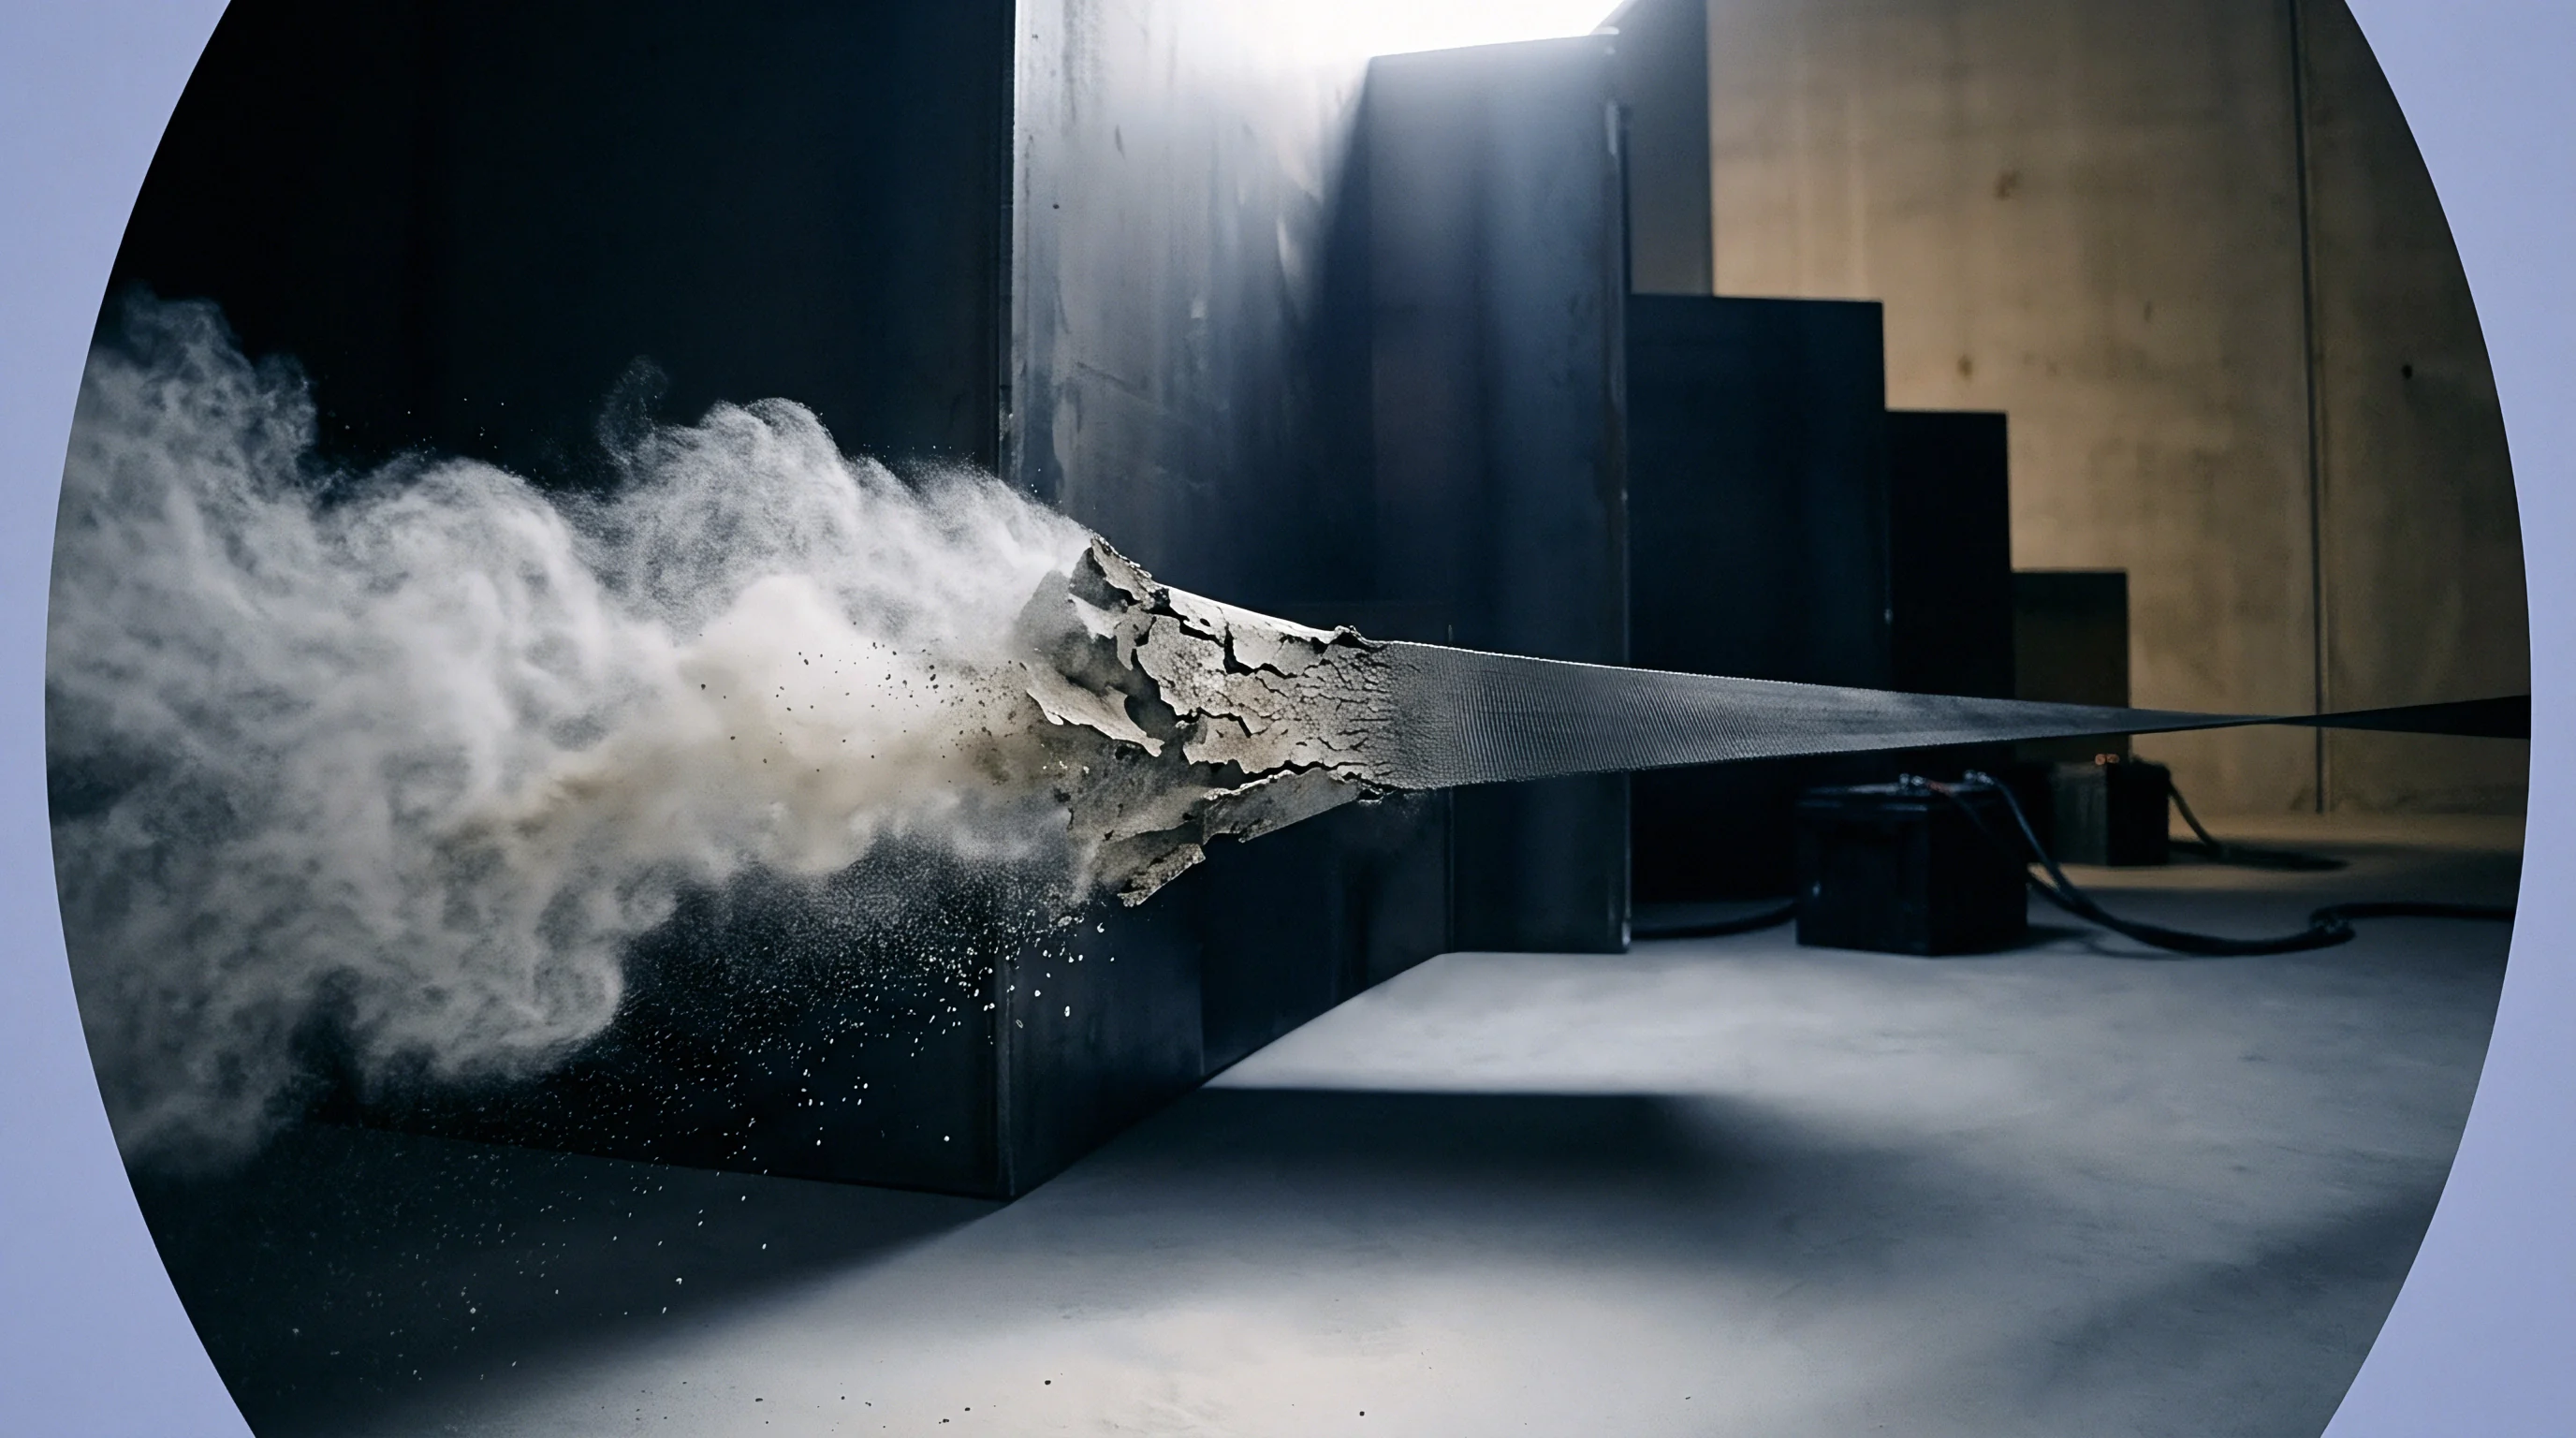
Detecting micro-crack initiation before macroscopic capacity loss occurs requires high-resolution non-destructive evaluation techniques calibrated to mechanical strain environments. Standard electrochemical impedance spectroscopy provides late-stage indicators of interfacial resistance growth but fails to isolate early-stage sub-micron crack nucleation. Advanced diagnostic protocols integrate acoustic emission monitoring, ultrasonic attenuation mapping, and high-resolution X-ray micro-tomography during active cell cycling under controlled biaxial mechanical loading.

Acoustic Emission and Ultrasonic Tracking
Acoustic emission monitoring captures transient elastic waves generated by sudden micro-fracture events within electrode coatings. Piezoelectric sensors attached directly to cell casings record high-frequency acoustic hits as micro-cracks form and propagate across active particles. Acoustic sensors detect dislocations.
Pure lithium swells isotropically. High-frequency acoustic signals above two hundred kilohertz isolate brittle particle cleavage events from low-frequency mechanical rubbing sounds generated by separator movement.
Ultrasonic attenuation measurements complement acoustic emission tracking by continuously scanning bulk electrode density changes. As micro-cracks form and expand throughout the electrode layer, ultrasonic wave velocity decreases while wave attenuation increases. Mapping these acoustic properties across the planar area provides real-time spatially resolved tracking of micro-crack density evolution under cyclic biaxial stress conditions.
Acoustic emission signal activity during early lithiation cycles identifies structural particle fracturing long before electrochemical impedance spectroscopy detects elevated charge transfer resistance.
| Diagnostic Technique | Spatial Resolution (um) | Detection Threshold (m2/m3) | In Situ Strain Compatibility | Scan Duration per Cycle |
|---|---|---|---|---|
| Acoustic Emission Waveform Analysis | 50.0 (Spatially Triangulated) | 1.5 x 10^4 Crack Hits | Full Biaxial Fixture Integration | Real-time Continuous |
| Ultrasonic Attenuation Mapping | 200.0 (Planar Grid) | 5.0 x 10^5 Micro-voids | Direct Contact Probe Array | 45 Seconds per Scan |
| Synchrotron X-Ray Computed Tomography | 0.3 (3D Voxel) | 1.0 x 10^2 Individual Cracks | Custom Miniature Strain Cell | 12 Minutes per Volume |
| Electrochemical Impedance Spectroscopy | Global Average | 15% Interfacial R Growth | Standard Test Channel | 20 Minutes per Step |
Implementation of non-destructive screening follows a systematic test sequence executed during preliminary qualification trials.
- Secure the pouch or prismatic cell in a custom biaxial tension fixture equipped with load cells and laser displacement sensors.
- Apply a predetermined initial biaxial mechanical pre-stress ratio corresponding to the pack housing constraint limits.
- Attach piezoelectric acoustic emission transducers directly to the external pouch tabs and cell casing.
- Subject the cell to full-depth galvanostatic charge and discharge cycles while recording acoustic hit counts and acoustic energy levels.
- Cross-examine acoustic signal onset locations against real-time micro-tomography scans to map micro-crack initiation thresholds.
When high-frequency acoustic emission events spike during preliminary formation steps, delamination across the current collector coating interface follows within fifty cycles.

Remedy
Managing micro-crack risk requires precise legal and technical alignment regarding cell expansion tolerances and structural constraint parameters. Cell procurement contracts that omit explicit limits on allowable cyclic biaxial swelling forces leave pack manufacturers fully exposed to premature mechanical degradation costs. Standard cell warranties guarantee capacity retention under idealized unconstrained bench conditions, ignoring the intense biaxial stress states imposed when cells operate inside rigid module enclosures.
Quality agreements must define verified threshold values for mechanical expansion force growth per hundred cycles under nominal module restraint stiffness. Inspection clauses should incorporate acoustic emission activity thresholds during cell lot acceptance testing to detect micro-structural coating fragility before feeding cells into module integration streams. Defective lots exhibiting premature micro-crack activity during initial strain-controlled qualification cycles earn immediate rejection under standardized incoming quality standards.
Contractual warranty schedules that specify maximum allowable capacity fade rates without tying metrics to biaxial stack constraint limits transfer all swelling-induced mechanical degradation risks back to the pack integrator.