Quantifying Non-Linear Capacity Knee Initiation under Combined Dynamic Thermal and Cycling Stresses
Quantifying capacity knee initiation requires tracking differential voltage peak shifts and post-charge relaxation kinetics under combined dynamic stresses.


Breach
Capacity retention in commercial lithium-ion cells shifts between two distinct regimes over extended cycling. The initial phase shows a gradual, linear loss of discharge capacity, driven mainly by solid electrolyte interphase growth and slow parasitic reactions. A sudden transition breaks this trajectory, causing a rapid, non-linear acceleration in capacity loss known as the capacity knee.
Pinpointing the exact thermodynamic and kinetic onset of this knee determines whether a storage asset meets its multi-year warranty target or fails prematurely in the field.
This transition from linear to non-linear aging marks a fundamental switch in dominant failure mechanics. Early on, the consumption of cyclable lithium ions at the graphite anode surface builds a passivation layer while leaving the active host material mechanically intact. With continued cycling under thermal and electrical stress, local structural degradation accelerates.
Anode graphite particles undergo mechanical microcracking from anisotropic volume expansion during lithiation and delithiation cycles. Fresh graphite surfaces are exposed to liquid electrolyte, consuming more active lithium ions to rebuild the passivation film and driving up internal impedance.
When the loss of cyclable lithium inventory shifts the alignment of the cathode and anode state-of-charge windows, the negative electrode potential drops toward zero volts relative to metallic lithium during charge. This creates the kinetic conditions for metallic lithium to deposit directly onto the anode surface. Plating begins as isolated micro-structures, but rapidly forms dense, continuous metallic films that block electrolyte diffusion into the graphite pores.
Clogging these pores drastically reduces accessible active surface area, causing localized spikes in current density that drive local anode potentials down even further.
Cathode degradation operates concurrently to speed up this imbalance. High-nickel layered oxides undergo phase transformations at high states of charge, shifting from hexagonal to monoclinic crystal structures with significant lattice strain. Secondary particle cracking opens internal grain boundaries to electrolyte penetration, leading to transition metal dissolution and oxygen evolution.
These dissolved transition metal ions migrate across the separator to the negative electrode, where they catalyze the breakdown of the protective interphase layer and consume additional lithium.
The non-linear capacity knee occurs when accessible void volume within anode graphite pores drops below eight percent, raising local transport resistance past the threshold of stable interstitial intercalation.
The interaction between lithium inventory loss and active material loss creates a positive feedback loop. Losing cyclable lithium shifts electrode stoichiometry, forcing the negative electrode to operate at higher SOC levels where potential drops sharply under fast charging. Losing active graphite material reduces the total surface area available for intercalating ions, elevating the local effective C-rate even while pack terminal current stays constant.
Once localized lithium plating begins, the metallic deposit reacts continuously with surrounding solvent compounds, consuming active electrolyte volume and stripping cyclable lithium from the active pool at exponential rates.

Microstructural Triggers of Electrochemical Rollover
Microscopic inspection of post-knee graphite anodes reveals clear structural differences compared to cells examined before knee onset. Electrodes harvested before non-linear decay show uniform interphase thickness across primary graphite flakes, with open pore networks filled with liquid solvent. Electrodes taken after knee initiation display dense crusts of polymeric electrolyte decomposition products interspersed with dead metallic lithium, electronically isolated from the current collector substrate.
This localized pore blockage creates severe solid-state diffusion gradients across the thickness of the electrode coating. Anode regions near the separator carry higher local current density as mass transfer resistance climbs deeper in the electrode matrix. That localized current density pushes the interfacial overpotential past the thermodynamic threshold for lithium deposition, even under moderate overall charging rates.
As a result, cell aging shifts from surface-controlled interphase growth to diffusion-controlled structural degradation.
| Chemistry | Primary Kinetic Trigger | Thermodynamic Overpotential Threshold | Dominant Post-Knee Failure Mode |
|---|---|---|---|
| NMC 811 / Graphite | Anode pore clogging via transition metal catalytic migration | 12 mV below Li/Li+ at negative electrode separator interface | Continuous metallic lithium plating and rapid gas evolution |
| NMC 622 / Graphite-Silicon (5% Si) | Silicon volume expansion and severe interphase fracturing | 28 mV below Li/Li+ at local particle boundaries | Loss of active mass via electronic isolation of silicon grains |
| LFP / Graphite | Solid electrolyte interphase fracture under mechanical expansion | 5 mV below Li/Li+ during cold temperature fast charging | Electrolyte dry-out resulting from relentless lithium consumption |
Cell design parameters dictate the margin between linear degradation and early knee onset. A lean electrolyte fill shortens the time to knee initiation, as active solvent consumption quickly leads to localized dry spots in the separator matrix. High active material mass loading reduces electrode porosity, raising transport overpotentials during dynamic discharge.
The anode-to-cathode capacity ratio (N/P ratio) acts as a buffer against early plating; an initial design N/P ratio below 1.10 leaves little margin for lithium loss before negative electrode potential hits zero volts during aggressive charging.
Disputes over capacity knee onset often pit claims of operational misuse against manufacturing variability. Localized thermal gradients across the cell casing can drive lithium deposition outside operating limits, whether caused by pack thermal management limitations or cell-level manufacturing defects.


Thermals
Temperature fluctuations during operation introduce complex stress interactions that alter degradation rates. Static thermal environments follow predictable Arrhenius kinetics, where higher temperatures accelerate interphase growth and lower temperatures suppress ionic transport. Dynamic thermal regimes ~ with rapid swings between high ambient heat and cold operational pulses ~ disrupt this behavior.
Superimposing fast, high-current cycling onto rapid thermal transients forces localized electrochemical reactions far out of equilibrium.
Rapid heating lowers electrolyte viscosity and boosts bulk ionic conductivity, reducing ohmic resistance across the separator. At the same time, elevated temperatures increase the solubility and diffusivity of parasitic species within the electrolyte. Highly reactive intermediates formed at the positive electrode migrate rapidly toward the negative electrode during thermal excursions, destabilizing the interphase layer.
When the cell then cools down, the damaged interphase lacks the structural integrity to resist cracking, triggering uneven interphase growth on subsequent charge cycles.
Cold environments severely restrict ion transfer across the electrode-electrolyte interface. Charge transfer resistance at the graphite surface spikes as temperatures drop below 15 degrees Celsius, while solid-state lithium diffusion within the graphite lattice slows by orders of magnitude. When a cold cell faces high charge current demands, the charge transfer overpotential quickly exceeds the threshold for metallic lithium deposition.
The deposited lithium forms high-surface-area mossy structures that immediately consume liquid solvent.
Uncontrolled thermal gradients exceeding three kelvin across a single pouch cell surface accelerate non-linear capacity decay by localized kinetic mismatch.
Thermal gradients inside large-format prismatic and pouch cells exacerbate localized degradation. High-current discharge pulses generate significant internal Joule heating deep within the electrode stack, whereas liquid cold plates pull heat primarily from external cell faces or terminal tabs. Core temperatures often exceed external surface temperatures by ten to fifteen kelvin under sustained dynamic loads.
This differential creates major variations in local current density across the planar area of the electrode sheets.
Warmer core regions carry higher local current density because charge transfer resistance is lower there. This higher local throughput accelerates thermal aging, interphase growth, and electrolyte decomposition in the cell interior. Meanwhile, cold perimeter regions operate at high overpotentials, making them vulnerable to lithium plating during regenerative braking or fast charging.
Coupling high-temperature chemical degradation at the core with low-temperature plating at the perimeter triggers capacity knees far earlier than homogeneous aging models predict.

Failure Sequences under Dynamic Stress Superposition
The sequence of environmental and operational drivers that forces linear cycling profiles into non-linear capacity loss follows distinct mechanical stages:
- Interphase fracturing under thermal expansion occurs when rapid ambient swings induce volumetric mismatch between metallic current collectors, polymeric binders, and ceramic electrode particles, creating microscopic fissures in the protective film.
- Solvent depletion within core electrode structures results from continuous interphase repair processes that consume free liquid solvent molecules, reducing liquid saturation across active electrode pores.
- Localized overpotential amplification arises as depleted liquid paths elevate ionic resistance, requiring higher driving potentials to maintain high current throughput during rapid charging profiles.
- Metallic dendrite nucleations initiate at graphite surface sites where local overpotentials drop below zero volts relative to the lithium reference, establishing low-resistance conductive channels.
- Internal micro-short circuiting events manifest when metallic dendrites penetrate separator membranes, releasing localized heat pulses that further degrade surrounding separator materials and accelerate systemic battery capacity knee degradation.
Thermal cycling accelerates mechanical stress through differential thermal expansion. Active electrode materials, metallic foils, polymeric separators, and exterior casings all have distinct thermal expansion coefficients. Temperature shifts generate internal shear stress at the interface between active material coatings and the copper or aluminum current collector foils.
Repeated expansion cycles weaken this bond, leading to localized delamination and higher contact resistance.
Dynamic heat generation profiles combine with high current pulses to alter the chemical composition of the solid electrolyte interphase. Higher temperatures promote inorganic salts like lithium carbonate and lithium fluoride, which offer reasonable mechanical stability but high interface resistance. Low temperatures yield organic carbonate decomposition products that are fragile and soluble in warm electrolyte.
Oscillating between ambient extremes destabilizes both organic and inorganic constituents, leaving the active graphite host exposed to aggressive chemical attack.
Thermal-electrochemical degradation testing across multi-cell strings confirms these coupled interactions. Internal temperature spikes during transient current pulses consistently precede early capacity rollover. Current distribution measurements across parallel-connected cells show that thermal imbalances force individual cells to take on unequal current loads, accelerating localized knee initiation across the entire parallel block.
How much thermal control capacity must a pack thermal management system maintain to prevent cold-spot lithium plating during fast charging transients without driving parasite pump energy past system efficiency targets?


Metrics
Predicting capacity knee onset requires non-destructive diagnostics that catch microstructural changes long before capacity drops at the terminals. Standard capacity measurements during constant-current cycling offer no early warning, as terminal capacity remains largely flat throughout the linear aging phase. Electrochemical diagnostics track minute shifts in thermodynamic potentials, charge transfer resistance, and open-circuit voltage profiles to quantify degradation trajectories before irreversible non-linear decay takes hold.
Incremental capacity analysis ~ calculating differential capacity relative to terminal voltage (dQ/dV) ~ converts broad voltage plateaus into distinct, sensitive electrochemical peaks. Each peak corresponds to a specific phase transition within the active materials during lithiation or delithiation. Shifts in peak position along the voltage axis track internal ohmic and charge transfer impedance growth, while peak area reductions quantify active material or cyclable lithium loss.
This allows engineers to isolate structural failure modes without destructive teardowns.
Differential voltage analysis (dV/dQ) complements incremental capacity by modeling open-circuit voltage behavior from terminal data. Plotting dV/dQ against discharge capacity highlights features linked to graphite phase transitions and cathode stoichiometry shifts. Measuring the distance between characteristic electrode peaks identifies the thermodynamic loss of cyclable lithium inventory.
Tracking peak spacing over time establishes a quantitative rate of lithium consumption; a sudden widening in peak separation directly signals early localized lithium plating.
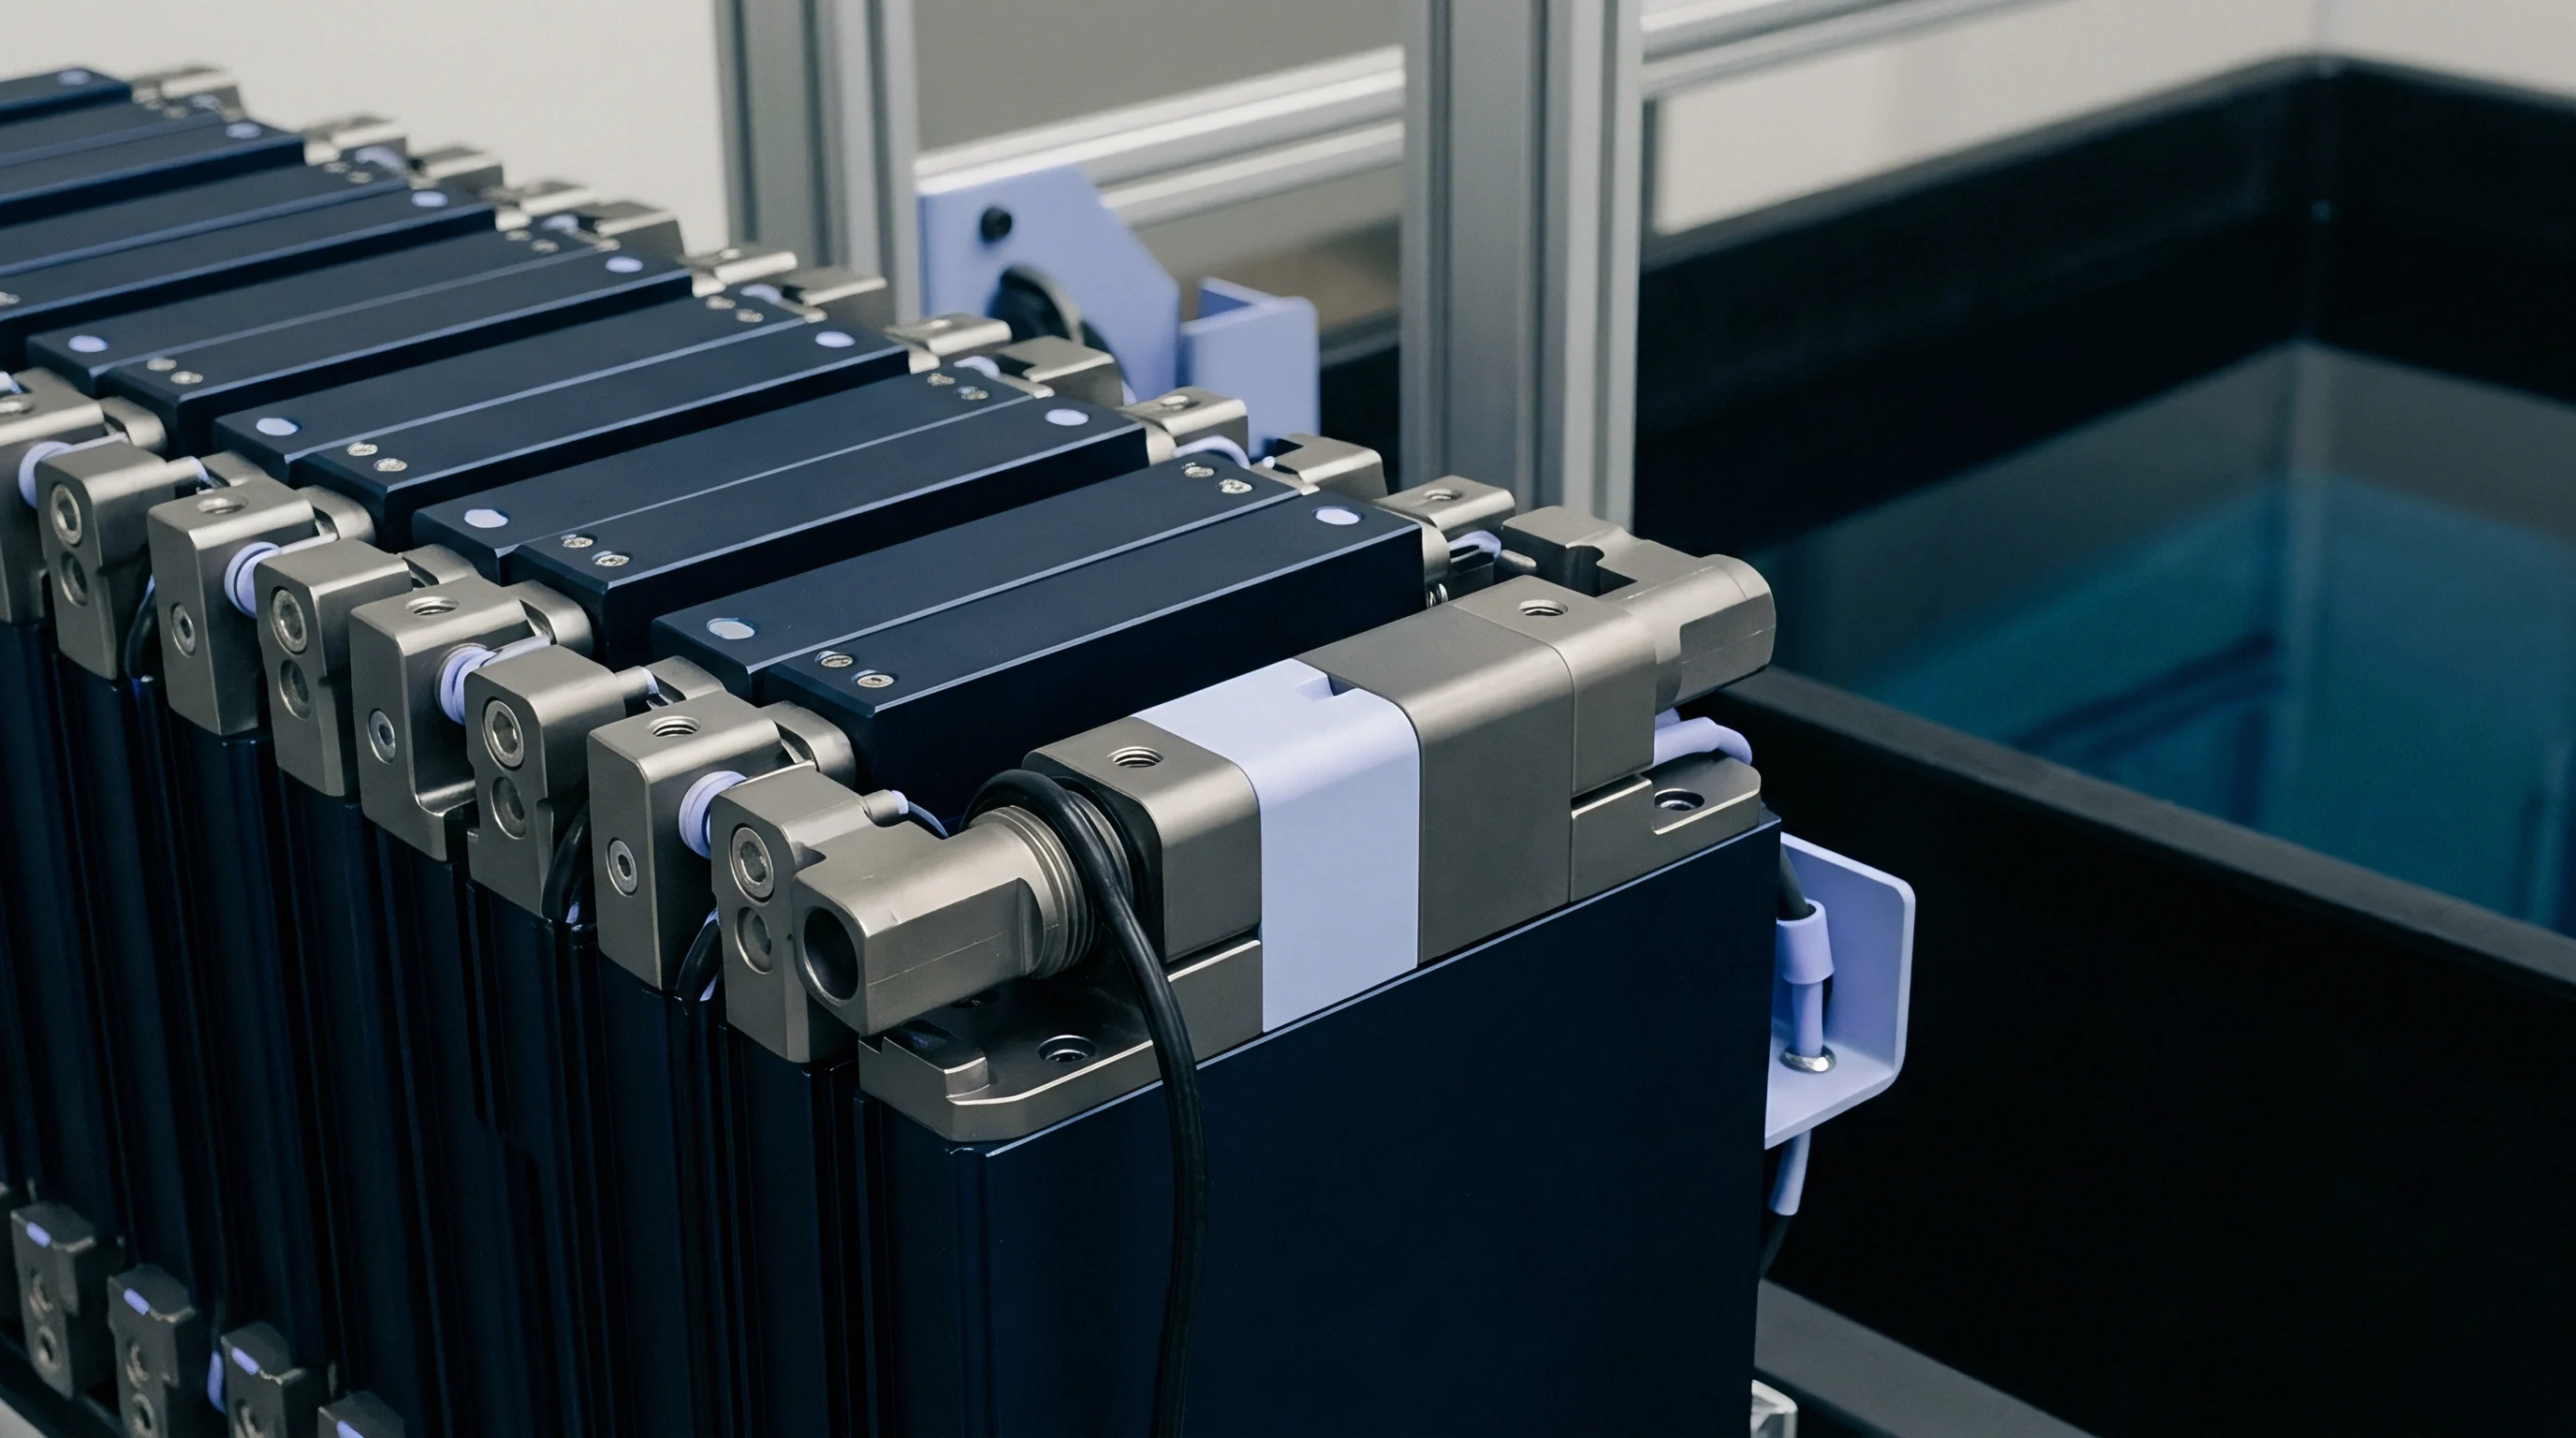
Can Differential Voltage Curves Pinpoint Local Lithium Plating before Macroscopic Knee Initiation?
Differential voltage analysis isolates localized lithium plating by tracking potential relaxation anomalies immediately after high-current charging steps. When metallic lithium deposits on the graphite surface, it creates a mixed potential governed by both the graphite intercalation state and the surface lithium stripping reaction. Upon current interruption, cell terminal voltage displays a characteristic plateau or slope inversion as the plated lithium chemically re-intercalates into the underlying graphite matrix.
The magnitude and duration of this relaxation plateau yield a direct quantitative measurement of reversible plated lithium mass. Regular inspection of post-charge relaxation curves reveals the precise cycle where lithium deposition transitions from a temporary, reversible phenomenon to irreversible dead lithium formation ~ marking the exact onset of the capacity knee.
| Diagnostic Method | Primary Physical Metric Measured | Knee Onset Sensitivity | Implementation Complexity |
|---|---|---|---|
| Differential Capacity (dQ/dV) | Phase transition peak intensity and position | High (detects initiation 100 to 200 cycles prior) | Low (requires high-precision low-rate cycling data) |
| Electrochemical Impedance (EIS) | Charge transfer resistance (R_ct) expansion rate | Moderate (tracks general impedance growth trends) | Medium (requires specialized AC perturbation equipment) |
| Post-Charge Voltage Relaxation | Mixed-potential relaxation plateau duration | Very High (pinpoints exact onset cycle of plating) | Low (computational processing of standard rest phase) |
| High-Precision Coulombic Efficiency | Parasitic loss current ratio (CE deficit) | Extremely High (detects subtle chemical consumption) | High (requires temperature stability within 0.05 K) |
Electrochemical impedance spectroscopy (EIS) tracks the growth of internal resistance components across a broad frequency spectrum. On a Nyquist plot, the high-frequency real-axis intercept measures pure ohmic resistance, mid-frequency semicircles reflect solid electrolyte interphase and charge transfer resistance, and the low-frequency Warburg tail captures solid-state mass diffusion. Knee initiation correlates strongly with an exponential expansion of the mid-frequency charge transfer semicircle, signaling severe passivation layer degradation and active site blockage.
High-precision coulombic efficiency (HPCE) measures the ratio of discharge to charge capacity during controlled cycling. Standard industrial cyclers lack the voltage and current resolution needed to resolve microscopic parasitic losses. HPCE systems, holding tight thermal control within 0.05 kelvin, detect coulombic efficiency drops below 0.9990 long before capacity loss shows up on standard discharge curves.
A continuous drop in coulombic efficiency confirms ongoing parasitic lithium consumption, providing a clear precursor to capacity rollover.
A sudden inflection point in the charge transfer resistance growth rate indicates irreversible interphase fracture before any capacity knee becomes visible in testing.
Combining multiple non-destructive diagnostic metrics into an integrated health vector improves prediction accuracy. Relying on a single parameter risks false positives caused by temporary temperature shifts or operational noise. Mapping dQ/dV peak area reduction against post-charge voltage relaxation kinetics yields a robust metric that clearly separates benign interphase growth from catastrophic non-linear failure.
A reliable quantitative indicator of impending capacity knee failure is a continuous increase in dV/dQ peak spacing paired with a sudden drop in coulombic efficiency across twenty consecutive full-depth cycles.

Screening
Designing accelerated life testing to quantify capacity knee onset requires balancing stress acceleration against failure mode validity. Pushing test parameters too far with excessive C-rates or extreme temperatures risks triggering unrepresentative failure mechanisms, like thermal runaway or current collector corrosion, that do not occur in real-world field duty cycles. Qualification matrices must apply combined thermal and cycling stresses that accelerate relevant degradation pathways while preserving representative electrochemical failure modes.
Stress matrix design starts by mapping the operational envelope across temperature, charge rate, discharge rate, and state-of-charge limits. Accelerated testing replaces static isothermal conditions with dynamic thermal profiles that mirror real environmental exposure. Temperature ramping protocols cycle ambient chambers between low-temperature charge acceptance boundaries and elevated stress limits while the cell faces continuous high-current power pulses.
This combined stress environment exposes kinetic vulnerabilities in cell design, forcing early knee initiation without altering the underlying degradation physics.
Laboratory test channels must maintain exceptional current stability, high voltage resolution, and tight temperature control over multi-month campaigns. Parasitic resistance in fixtures, uncompensated cable voltage drops, and room temperature fluctuations introduce measurement noise that can obscure subtle early indicators of knee onset. Using three-wire or four-wire Kelvin sensing contacts directly on cell terminal tabs eliminates contact resistance artifacts, ensuring accurate differential voltage calculations and reliable impedance tracking.
| Charge C-Rate | Thermal Swing Limits | SOC Window Depth | Mean Cycles to Knee Onset | Failure Distribution Weibull Shape (beta) |
|---|---|---|---|---|
| 1.0C Constant | 25 deg C Isothermal | 10% to 90% SOC | 2,850 cycles | 4.2 (narrow wear-out spread) |
| 2.0C Pulse | 25 deg C Isothermal | 10% to 90% SOC | 1,420 cycles | 3.8 (moderate wear-out spread) |
| 1.0C Constant | -10 deg C to 45 deg C Dynamic | 10% to 90% SOC | 1,150 cycles | 2.6 (broad environmental sensitivity) |
| 2.0C Pulse | -10 deg C to 45 deg C Dynamic | 5% to 95% SOC | 480 cycles | 1.9 (early scattered onset risk) |
Translating accelerated test results to real-world lifespans relies on empirical and physics-based degradation models. Accelerated stress factors map life reduction using Eyring equations that combine Arrhenius thermal dependencies with non-thermal stress inputs like current density and SOC window span. Validating these models requires long-term baseline tests under nominal conditions run alongside accelerated matrix channels, establishing precise mathematical transformation factors between laboratory time and field operating hours.
Commercial storage projects have suffered severe financial losses when laboratory screening evaluated cell samples under purely isothermal conditions. The cell batch demonstrated flat, linear capacity retention through 2,000 cycles at 25 degrees Celsius, passing initial qualification checks. Once deployed into field enclosures operating under dynamic ambient heat swings and rapid power demand profiles, the cells experienced widespread capacity knees before cycle 650, forcing full pack replacement under warranty.

Verification Sequence for Cell Qualification
Quantifying knee initiation boundaries across candidate cell models follows a structured laboratory verification sequence:
- Establish baseline open-circuit voltage curves, initial discharge capacity, and electrochemical impedance spectroscopy spectra across five reference temperatures using calibrated test channels.
- Mount cell specimens within custom test fixtures featuring four-wire Kelvin contacts, surface-mounted thermocouples, and controlled mechanical compression plates applying precise initial preload pressures.
- Execute dynamic stress profiles combining fast charging pulses, dynamic discharge steps, and ambient thermal chamber ramps between specified lower and upper operating limits.
- Pause dynamic stress cycling every fifty cycles to run standardized diagnostic probe steps, capturing high-resolution dQ/dV curves and post-charge voltage relaxation profiles.
- Process collected diagnostic data through differential analysis scripts to track shifts in phase transition peak areas, charge transfer resistance expansion, and parasitic coulombic efficiency deficits.
- Identify the precise inflection point cycle where the rate of change in dV/dQ peak distance accelerates by more than three standard deviations above baseline linear trends.
- Extract tested cell samples exhibiting early knee signatures for tear-down analysis, cross-sectioning, and structural scanning electron microscopy to confirm microscopic plating failure modes.
Statistical distribution analysis of capacity knee initiation cycles reveals critical information about manufacturing batch consistency. Applying Weibull distribution models to knee onset cycle counts across multi-cell sample populations yields shape parameters (beta) and characteristic life scale parameters (eta). A high Weibull shape parameter indicates a tight, predictable wear-out distribution driven by intrinsic electrochemical limits.
A low shape parameter highlights high sample-to-sample variance caused by inconsistent coating thickness, localized N/P ratio variations, or erratic electrolyte fill volumes across the manufacturing line.
Statistical variation in manufacturing coating thickness shifts localized N/P ratios, broadening the Weibull distribution of capacity knee initiation cycles across cell production batches.
Evaluating sample populations under dynamic stress matrices reveals whether early failure instances stem from isolated material defects or systemic design vulnerabilities. Sourcing practices use Weibull shape metrics to set minimum acceptable quality thresholds during vendor selection. A cell lot displaying early, scattered knee initiation poses unacceptable warranty risk, regardless of how impressive its nominal datasheet cycle life appears.

Risk
Commercial contracts for energy storage systems depend on accurate cycle-life projections to build bankable financial models. Standard manufacturer datasheets present cycle life under gentle laboratory conditions ~ typically 25 degrees Celsius ambient temperature, moderate 0.5C charge and discharge rates, and narrow voltage windows. These flattering datasheet curves hide the non-linear degradation risks that emerge under actual operating profiles.
When cells reach their capacity knee point in field service, effective capacity drops far faster than baseline warranty amortization models anticipate, destroying project economics.
Financial exposure from unexpected capacity knee initiation shows up across multiple operational channels. System degradation forces operators to add supplementary capacity ~ augmentation ~ far earlier in the project lifecycle than budgeted. Early augmentation increases capital expenditure while introducing integration challenges when combining aged cell strings with fresh cell blocks.
Furthermore, increased internal resistance post-knee generates excessive heat during standard operation, elevating parasitic HVAC cooling loads and degrading round-trip efficiency.
Warranty frameworks drafted by suppliers often contain protective clauses designed to shift the financial burden of early capacity rollover onto the buyer. Standard agreements define end-of-life as seventy or eighty percent remaining capacity, but evaluate compliance against static laboratory test conditions defined by the vendor. When field-deployed cells undergo premature knee initiation under dynamic stress exposure, disputes often turn on whether operational profiles exceeded ideal conditions or remained within published maximum ratings.

Commercial Verification Checklist for Procurement Contracts
Mitigating financial exposure to non-linear degradation requires embedding strict technical and commercial safeguards directly into supply contracts and procurement frameworks:
- Explicit dynamic stress cycle definitions must replace static isothermal cycle specifications, incorporating thermal swings, power pulse profiles, and full operational SOC window boundaries.
- Continuous diagnostic telemetry requirements obligate project operators to log high-frequency voltage, current, and temperature parameters necessary to prove operational compliance during warranty dispute resolution steps.
- Pre-knee threshold verification clauses define contractually binding early diagnostic trigger metrics, such as dQ/dV peak area reduction rates, that initiate vendor technical reviews before macroscopic capacity drop occurs.
- Augmentation remedy allocations require cell suppliers to compensate buyers for extra cell modules and installation labor if non-linear capacity decay manifests prior to a specified cycle milestone.
- Third-party laboratory arbitration protocols establish clear technical testing procedures and independent testing facility selection rules to settle disputed warranty claims without expensive legal litigation.
Landed-cost calculations must account for capacity degradation kinetics over the asset’s full operational life. Evaluating cell cost purely on an initial dollar-per-kilowatt-hour (/kWh) basis ignores the financial difference between a cell that maintains linear decay through 4,000 cycles and one that hits a capacity knee at cycle 1,200. Calculating the true levelized cost of storage (/kWh-delivered) requires dividing total pack capital and operating expenses by the cumulative energy delivered before capacity drops below functional thresholds.
Financial modeling across utility-scale storage procurement tenders demonstrates the long-term impact of non-linear rollover. A cell model featuring a 15% lower initial purchase price ($/kWh) but suffering knee initiation at cycle 1,400 under dynamic field conditions yields a significantly higher levelized cost of energy compared to a premium cell that maintains linear degradation through 3,500 cycles. Initial capital savings disappear quickly once accounting for premature capacity augmentation and a shortened operational lifespan.
Redlining cell supply contracts involves restructuring warranty terms to bind supplier guarantees directly to dynamic stress cycle profiles. Buyers must replace generic cycle-life metrics with detailed energy-throughput guarantees that remain valid across the application’s full operational temperature and C-rate spectrum. Supply agreements should explicitly classify capacity knee initiation as a latent manufacturing defect if non-linear capacity drop occurs within guaranteed energy-throughput bounds.
An effective contractual mechanism for managing non-linear degradation risk is including a mandatory supply agreement term: “If the delivered capacity of any cell batch exhibits a non-linear decay rate exceeding 0.15 percent capacity loss per ten cycles over any continuous fifty-cycle window within the guaranteed energy-throughput limit, the supplier shall, within thirty days of notification, deliver replacement cell modules sufficient to restore nominal system capacity at zero landed cost to the buyer.”