Statistical Sampling Plans for Incoming Prismatic Lithium Cell Shipments
Incoming prismatic cell sampling relies on ISO 3951-1 variable plans and ISO 2859-1 attribute plans to reject defective lots before module integration.


Dock

Environmental Thermal Stabilization and Receiving Protocols
Large-format prismatic lithium-ion cells arrive packed inside multi-layer wooden or corrugated crates, kept at a shipping state of charge between twenty and thirty percent per transport regulations. Cold transit creates steep thermal gradients between outer packaging layers and internal cell rows. Moving a crate stored at five degrees Celsius directly into an inspection bay maintained at twenty-five degrees Celsius creates immediate condensation risks on exposed aluminum terminal posts and foil packaging.
Standard operating procedures dictate a forced stabilization window of twenty-four to forty-eight hours within a climate-controlled staging zone prior to breaking outer crate seals.
Because full thermal equilibrium takes twenty-four hours, measuring open-circuit voltage or internal resistance on thermally unstabilized cells introduces errors that exceed tolerance windows defined in supply agreements. Lithium iron phosphate cell chemistries exhibit a negative open-circuit voltage thermal coefficient of approximately negative zero point six millivolts per degree Celsius, whereas nickel manganese cobalt chemistries vary by negative zero point three millivolts per degree Celsius across standard operating ranges. A temperature differential of fifteen degrees Celsius across a single pallet causes an artificial voltage spread of up to nine millivolts across identical cells, causing false rejections during initial voltage grading checks.
A thermal gradient of ten degrees Celsius across a shipping crate shifts open-circuit voltage readings by up to eight millivolts in lithium iron phosphate cells.
Pallet receiving procedures initiate with a physical inspection of transport indicators and outer packaging. Mechanics examine external shock sensors, tilt monitors, and humidity indicator cards embedded inside sealed vapor-barrier bags, checking for seal failures that admit oxygen or electrolyte leaks that corrupt plastic trays. Any breached vacuum foil bag or tripped shock sensor triggers an immediate isolation protocol, shifting the affected crate into a secondary quarantine hold before full lot logging proceeds.

Unboxing Verification and Primary Seal Audit
Unsealing the moisture-barrier foil bags exposes stacked cell trays held under structural banding to prevent movement during transport. Operators verify the condition of plastic separator trays, cell sleeve insulation, and terminal protection covers before clearing the lot. Prismatic cell cans, fabricated from thin-walled 3003-series aluminum alloy, remain vulnerable to corner impacts and side-wall denting when outer crate corner posts sustain transit loads.
Minor terminal pole oxidation is frequently attributed to ambient humidity spikes during maritime transit rather than improper desiccant volume inside outer vacuum barrier bags.


Metrics

Classification of Parametric and Physical Defect Modes
Incoming quality plans classify defect conditions into critical, major, and minor categories based on risk severity to safety, pack module automation, and electrical performance. Critical defects encompass conditions capable of causing immediate thermal event hazards, insulation failure, or chemical contamination during downstream module laser welding. Major defects impact long-term pack capacity, power delivery, or mechanical fitment within rigid enclosure frames.
Minor defects involve cosmetic non-conformances on external protective PET sleeves that leave primary insulation barriers intact.
| Defect Category | Inspection Parameter | Measurement Tool | Specification Boundary | Consequence of Non-Conformance |
|---|---|---|---|---|
| Critical (Class A) | Zero Voltage / Micro-Short | Digital Multimeter (0.1 mV) | OCV less than 2.800 V (LFP) | Internal separator breach, thermal runaway hazard |
| Critical (Class A) | Can-to-Pole Insulation | Megohmmeter (500 V DC) | Resistance greater than 100 MΩ | HV busbar short to pack enclosure ground |
| Critical (Class A) | Helium Leakage Rate | Mass Spectrometer Sniffer | Leak rate greater than 10^-6 mbar L/s | Electrolyte drying, moisture ingress, cell swelling |
| Major (Class B) | AC Internal Resistance | 1 kHz Milliohm Meter | 1 kHz AC-IR outside 0.18 – 0.24 mΩ | Imbalanced module heat generation and power loss |
| Major (Class B) | Cell Swelling Thickness | Flat Platen Load Fixture (300 kg) | Thickness over USL (+0.30 mm) | Module assembly line jam, cell crushed under constraint |
| Major (Class B) | Terminal Thread Runout | Laser Distance Sensor | Coplanarity variation over 0.15 mm | Defective busbar laser weld, contact resistance spikes |
| Minor (Class C) | PET Sleeve Coverage | Vision System / Caliper | Sleeve gap over 0.5 mm at top rim | Cosmetic non-conformance, potential creepage reduction |
Electrical Measurement Protocols and Voltage Decay Tracking
Electrical parameter screening focuses on open-circuit voltage, four-wire AC internal resistance at one kilohertz, and open-circuit voltage decay rates. Open-circuit voltage measurements demand calibrated five-and-a-half digit multimeters to detect subtle self-discharge anomalies. Recording cell voltage at two distinct time intervals separated by seven days yields the K-value self-discharge metric, expressed in millivolts per day.
Cells exhibiting elevated K-values harbour latent internal micro-shorts driven by transition metal contamination or burrs on cathode current collector foils.
Alternating-current impedance screening at one kilohertz captures ohmic resistance contributions from current collectors, terminal welds, and electrolyte conductivity. Direct-current internal resistance testing applies a ten-second discharge pulse at a two-C current rate, evaluating charge-transfer resistance and ion diffusion limits within porous electrodes. Because measuring direct-current resistance requires high-current cycler channels, this evaluation is restricted to smaller variable sample sizes.

Dimensional Tolerances under Mechanical Preload
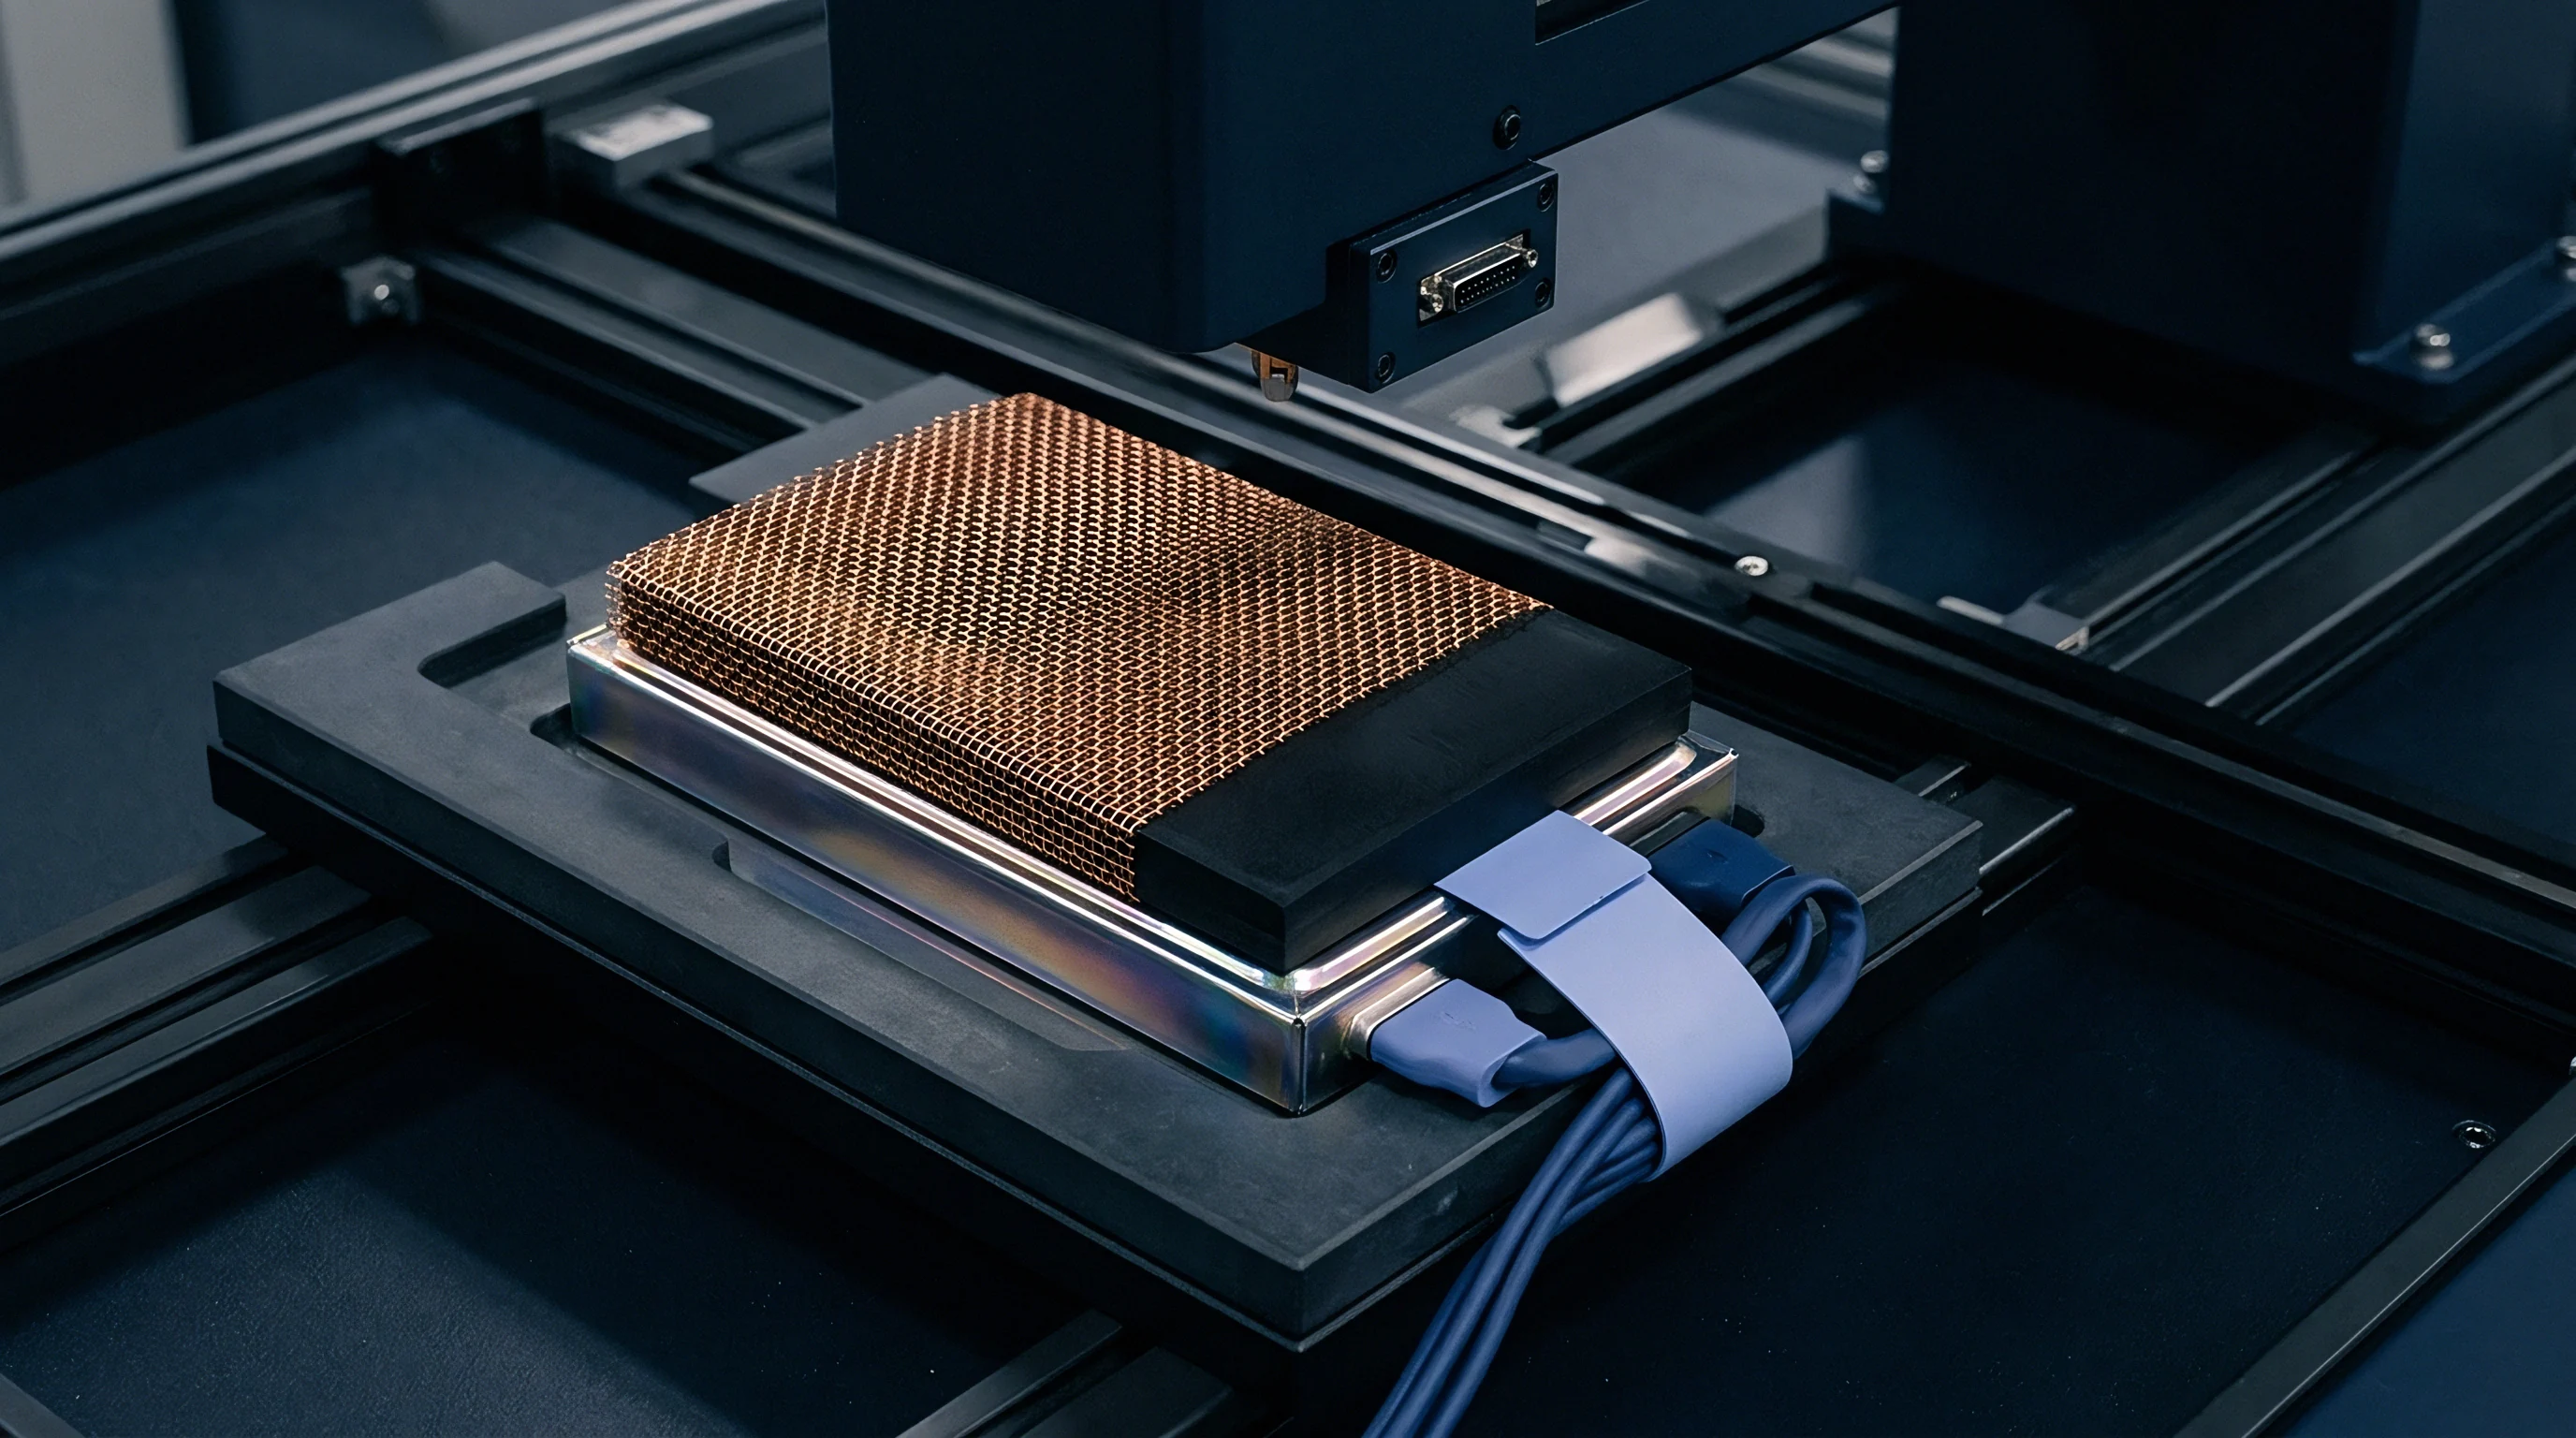
Prismatic cell envelope dimensions vary non-linearly with internal gas pressure, state of charge, and mechanical load, making uncompressed thickness measurements meaningless. Quality control fixtures incorporate pneumatic or hydraulic platens that exert a standardized clamping force of three hundred kilograms across the broad face of a 280Ah cell, simulating the mechanical compression applied by module end-plates.
Because terminal post geometry dictates busbar joint integrity, laser sensors record pole runout and dual-laser profiling systems scan terminal height, surface flatness, and thread pitch on threaded stud variants. Variations in terminal height exceeding zero point one five millivolts across adjacent cells inside a module string induce vertical force spikes on laser-welded copper-aluminum busbars, inducing fatigue cracks during vehicular vibration testing.
Ignoring mechanical thickness tolerances measured under flat clamping pressure causes module housing distortion, crushing adjacent cooling plates and initiating micro-short failure modes during field expansion cycles.


Arithmetic

Attribute Acceptance Sampling Mechanics
Attribute sampling evaluates each sampled cell as either conforming or non-conforming against defined specification thresholds. Standards such as ANSI/ASQ Z1.4 and ISO 2859-1 define lot acceptance probability using sample size code letters and Acceptable Quality Levels. The Acceptable Quality Level represents the maximum percent defective that is considered acceptable as a process average over a continuous series of submissions.
| Plan Structure | Standard Reference | Inspection Level | Sample Size (n) | Acceptance Criteria | Consumer Risk (LTPD at 10% Pass) |
|---|---|---|---|---|---|
| Single Attribute Normal | ISO 2859-1 | General Level II | 125 cells | Ac = 0, Re = 1 (AQL 0.10%) | 1.8% defective lot has 10% acceptance chance |
| Single Attribute Tightened | ISO 2859-1 | General Level II | 125 cells | Ac = 0, Re = 1 (AQL 0.065%) | 1.2% defective lot has 10% acceptance chance |
| Double Attribute Normal | ISO 2859-1 | General Level II | n1=80, n2=80 | Ac1=0, Re1=2; Ac2=1, Re2=2 | 1.7% defective lot has 10% acceptance chance |
| Variable Single (s Method) | ISO 3951-1 | General Level II | 35 cells | k-factor = 2.02 (AQL 0.10%) | 0.9% defective lot has 10% acceptance chance |
| Special Attribute (Critical) | ISO 2859-1 | Special Level S-3 | 20 cells | Ac = 0, Re = 1 (AQL 0.01%) | 10.8% defective lot has 10% acceptance chance |
Calculating lot acceptance probability under attribute sampling utilizes the hypergeometric distribution for finite lot sizes where sampling occurs without replacement. The probability of finding exactly d defective units inside a sample of size n drawn from a lot of size N containing D total defects follows the relation:
P(X = d) = / C(N, n)
When lot size N exceeds sample size n by more than a factor of ten, the binomial distribution serves as a valid mathematical approximation. Binomial modeling simplifies the calculation of the Operating Characteristic curve, plotting lot defect percentage against acceptance probability:
P(Accept) = Sum from i=0 to c of
Where p represents actual lot defect proportion, and c denotes the acceptance number. Setting c equal to zero creates a strict zero-defect plan where finding a single non-conforming cell in sample n forces complete lot rejection. Zero-defect attribute plans yield steep Operating Characteristic curves, subjecting buyers to high Producer Risk unless sample sizes remain large.
ISO 2859-1 switching rules compel transition to tightened inspection when two out of five consecutive incoming batches fail primary attribute screening.

Variable Sampling Plans and Quality Index Calculations
Variable sampling plans evaluate continuous metrics, including open-circuit voltage, AC internal resistance, and mechanical thickness under load. Standards including ANSI/ASQ Z1.9 and ISO 3951-1 assume sampled parameters follow a normal normal distribution. Measuring exact parametric values extracts significantly more statistical information per unit than attribute pass/fail binary sorting, though small sample sizes increase consumer risk.
Variable acceptance decisions depend on calculating the upper quality index or lower quality index, using sample mean and sample standard deviation. For a upper specification limit, the quality index calculation follows:
Q_U = (USL – x_bar) / s
For a lower specification limit, the lower quality index calculation follows:
Q_L = (x_bar – LSL) / s
Where x_bar represents sample mean, s denotes sample standard deviation, USL represents upper specification limit, and LSL represents lower specification limit. Evaluators compare the calculated quality index against a critical acceptability constant k, extracted from ISO 3951-1 standard tables based on sample size n, chosen AQL, and inspection level. A lot receives acceptance if the quality index equals or exceeds acceptability constant k.
When both upper and lower specification limits constrain a single parameter simultaneously, such as AC internal resistance, acceptance requires satisfying the combined double-specification criteria using the sample standard deviation method.
Under ISO 3951-1 Clause 6.4, any variable measurement falling outside double specification limits automatically converts the lot disposition to tightened single attribute sampling under ANSI/ASQ Z1.4.


Stratification

Physical Packaging Schemes and Spatial Sampling Bias
Prismatic lithium cells undergo formation, aging, and grading steps inside automated factory lines before insertion into outer ocean transport packaging. Cells occupy fixed spatial locations within heat-treatment chambers and thermal aging racks during manufacturing. Internal spatial temperature variances across factory aging rooms generate systematic property gradients across cells assigned to a single packaging lot; cells aged on outer rack boundaries experience faster heat dissipation, altering SEI layer stabilization and self-discharge decay rates compared to cells aged in central rack blocks.
- Thermal Core Concentration leads to elevated self-discharge rates in cells located within inner pallet rows due to heat retention during factory formation steps.
- Vibration Loading Harms outer crate corners during transit, where mechanical acceleration spikes induce micro-fretting on terminal surfaces and damage foil bags.
- Vertical Stacking Pressure crushes cell bottom edges when bottom-tier pallet trays absorb combined transit shock loads across ocean container shipping lines.
- Moisture Gradient Traps retain ambient humidity in top-tier cardboard divider sheets, accelerating local pole post oxidation under defective desiccant seals.
Sampling plans drawing cells exclusively from accessible top packaging layers suffer from severe spatial bias. A lot inspection algorithm must enforce a three-dimensional stratified random sampling matrix across the packaging structure, dividing each shipping crate into discrete spatial zones along the horizontal X-Y plane and vertical Z-tier axis.

Three-Dimensional Random Stratification Matrix
Implementing a stratified sampling plan demands systematic indexing of every cell container prior to extraction. Pallet unboxing sequences assign coordinate identifiers (X, Y, Z) to every tray location inside the master crate. For a target sample size of n cells drawn from a crate containing T total trays with C cells per tray, the auditor divides the total volume into equal stratification blocks.
- Assign numeric identifiers to all crates, inner trays, and cell grid positions contained within the arrival lot.
- Determine required sample size n using the selected ISO 2859-1 attribute or ISO 3951-1 variable inspection level.
- Divide sample size n equally across top, middle, and bottom vertical tray tiers within each crate to capture Z-axis transport compression variance.
- Generate pseudo-random X-Y coordinate pairs for each tier using computer-generated random number tables, excluding adjacent cells.
- Extract selected cells using vacuum suction lifting tools while maintaining ESD grounding on exposed terminal posts throughout the sampling process.
- Label each extracted sample cell with its original pallet, tray, and grid coordinate to preserve traceability during diagnostic electrical bench testing.
Cells positioned at crate corners reveal mechanical shock history, whereas cells located in central tray rows expose thermal aging variance.


Acceptance

Worked Case Demonstration for Prismatic Lot Disposition
Evaluating a delivery batch of 5,000 prismatic lithium iron phosphate 280Ah cells demonstrates variable sampling mechanics in practice. Contractual specifications establish an AC internal resistance Upper Specification Limit of zero point two five milliohm, evaluated at one kilohertz and twenty-five degrees Celsius. The supplier contract designates ANSI/ASQ Z1.9 (ISO 3951-1) General Inspection Level II, Single Sampling Plan, Normal Severity, with an Acceptable Quality Level of zero point one zero percent.
Table lookup in ISO 3951-1 yields sample size code letter L, specifying a sample size n of thirty-five cells and an acceptability constant k equal to two point zero two.
Inspectors extract thirty-five cells across a three-dimensional stratification matrix and measure AC internal resistance using a calibrated four-wire milliohm meter. The resulting sample dataset yields a mean AC internal resistance x_bar of zero point two one two milliohm, with a sample standard deviation s of zero point zero one one milliohm. Calculate the upper quality index Q_U:
Q_U = (USL – x_bar) / s = (0.250 – 0.212) / 0.011 = 3.45
Comparing calculated upper quality index Q_U against critical acceptability constant k:
Q_U (3.45) > k (2.02)
Because upper quality index Q_U exceeds acceptability constant k, the incoming lot meets the upper specification limit requirement for AC internal resistance under variable sampling rules, and quality control clears the shipment for commercial acceptance.
Variable sampling plans reduce required sample sizes by up to seventy percent compared to attribute plans while maintaining identical consumer risk protection.

Commercial Quarantine Holds and Supplier Dispute Boundaries
When an incoming lot fails sampling acceptance criteria, quality engineering issues an immediate quarantine hold, locking the associated material batch inside ERP tracking systems. Non-conforming lot notices trigger formal contract clauses governing disposition timing, supplier sorting expenses, and return-to-vendor protocols. Cell manufacturers reserve the right to perform joint re-testing on quarantined lots within a fourteen-day window, using identical test equipment and environmental controls.
Re-testing protocol disputes center on measurement setup variation, environmental stabilization times, and calibration standards. Supplier re-tests must utilize identical cell clamping force, temperature equilibration windows, and instrument lead configurations agreed upon in primary engineering drawings. Unilateral 100-percent sorting by the buyer without written supplier authorization forfeits direct sorting cost chargeback rights under standard cross-border procurement terms.
Whether automated high-throughput laser profiling of prismatic top-plate welds will supersede manual leak testing in standard incoming inspection remains an open operational question for high-volume pack integrators.