Statistical Acceptance Sampling for Imported Prismatic Battery Cell Shipments
Enforce zero-acceptance sampling plans and 48-hour thermal soak protocols on imported prismatic cell lots to prevent non-conforming units from entering pack production lines.


Dock
Container doors open at the receiving bay to reveal the physical toll of ocean transit. Packed inside heavy cardboard or expanded polypropylene crates, prismatic cells register roughly thirty days of transit vibration, humidity exposure, and maritime temperature swings long before any test leads touch a terminal. Before offloading starts, receiving staff examine external box condition, confirm that tamper-evident security tape remains intact, and inspect environmental monitoring tags fixed to internal pallet structures.
Shock indicators and temperature logging discs mounted to the pallets yield the shipment’s earliest hard data. Vessels crossing tropical corridors regularly subject cargo holds to temperatures past forty-five degrees Celsius, just as winter handling at northern ports exposes shipments to sub-zero freezes. Thermal swings outside the manufacturer’s storage envelope accelerate self-discharge, promote localized electrolyte pooling inside tightly wound jellyrolls, and alter the development of the solid electrolyte interphase before the cell ever goes into service.

Freight Arrival and Thermal Stabilization
Crates pulled straight from hot or cold holds show temporary shifts in open-circuit voltage and internal resistance that disrupt baseline inspection. Because densely packed, aluminum-cased cells carry substantial thermal mass inside their wooden or plastic crates, core jellyroll temperatures lag ambient warehouse air by multiple hours. Tracking dock conditions against crate core temperatures with infrared thermometers or embedded thermocouples keeps baseline measurements dependable.
Standard protocols call for at least forty-eight hours of thermal soaking in a climate-controlled room held at twenty-five degrees Celsius, plus or minus two degrees, before unpacking individual cells. Receiving procedures specify a ninety-six-hour thermal soak inside ambient environmental chambers before open-circuit voltage checks begin.
Thermal gradients across an unconditioned pallet skew early test runs. A cell resting on an outer corner equilibrates well ahead of one buried deep in the center of the stack. Sampling immediately off the container leaves interior units carrying transit temperatures while exterior units reflect room conditions.
That spread creates artificial variance in AC internal resistance and open-circuit voltage, which can prompt unwarranted rejections or disguise actual cell defects.

Package Integrity and Physical Damage Inspection
Crushed carton edges, torn vapor barriers, and snapped strapping point to rough handling during intermodal transfers. Prismatic cells depend on intact aluminum outer cans to preserve hermetic sealing and withstand internal pressure. A dent in an exterior wall reduces clearance between the case and the internal electrode stack, raising the likelihood of internal shorts once modules are compressed into final pack assemblies.
Desiccant packets sealed inside moisture-barrier bags must remain active when cut open. Saturated desiccant reveals air leakage through torn foil liners, exposing laser-welded aluminum terminal rivets to moist air. Condensation on positive and negative terminals triggers galvanic corrosion, drives up contact resistance at testing fixtures, and skews milliohm readings on incoming screening lines.
Freight temperature logs exceeding forty degrees Celsius trigger immediate quarantine prior to electrical sorting.
Quarantine rules isolate incoming shipments at the dock until transit logs clear compliance checks. Facilities rely on dedicated yellow-line holding bays backed by fire suppression and local temperature logging to stage unverified lots. Master bills of lading, transit manifests, and vendor lot numbers are checked directly against serial markings stamped on cell casings to prevent mixed-lot staging.
Terminal oxidation from ocean transit is often dismissed as a harmless cosmetic issue rather than an indicator of packaging failure or an early cause of elevated contact resistance.


Sampling
Statistical acceptance sampling cuts bulk container volumes down to workable test lots while keeping commercial and technical exposure within defined limits. When importing ten thousand prismatic cells for battery pack manufacturing, running exhaustive electrical screening or destructive tear-downs across the entire delivery is cost-prohibitive. Instead, incoming inspection relies on sampling standards that calculate the probability of lot acceptance from the defects found within a representative sample.
Structuring the plan means weighing producer risk against consumer risk: the risk of rejecting an acceptable shipment versus the risk of accepting lots with defect counts above tolerance thresholds. Widely used frameworks like ISO 2859-1 and ANSI/ASQ Z1.4 offer attribute tables indexed to Acceptance Quality Limits, while zero-acceptance number plans apply tighter stop-ship rules geared toward mission-critical battery builds.

Sampling Plan Architecture and Operating Characteristic Curves
Operating Characteristic curves show a sampling plan’s discriminatory strength by plotting lot defect percentages against acceptance probabilities. A steeper curve offers greater statistical confidence in turning away lots that drift past allowable defect limits. For primary energy storage parts, standard single-sampling plans under ISO 2859-1 General Inspection Level II rarely provide sufficient screening against low-frequency, high-consequence flaws like separator pinholes or stray metallic particulates.
Acceptance Quality Limit tiers categorize defects by severity. Critical defects involve severe hazards ~ cell leakage, pronounced swelling, or internal shorts that can initiate thermal runaway. Major defects cover functional shortfalls, such as available capacity falling more than three percent below rated nominals or internal resistance drifting above the maximum design limit.
Minor defects involve surface scuffs on non-conductive areas or minor exterior dimensional drift within mechanical allowances.
Zero-acceptance plans developed by Nicholas Squeglia adjust traditional attribute tables by setting the acceptance threshold to zero across all lot sizes. Standard ISO 2859-1 plans permit one or more defective cells while still approving the broader delivery ~ a major hazard for assemblers wiring thousands of cells in series and parallel strings. Under a zero-acceptance framework, finding a single non-conforming unit stops processing and fails the shipment immediately.
| Sampling Standard | Inspection Level | Lot Size (Units) | Sample Size (n) | Acceptance Number (c) | Rejection Number (r) | LTPD at 10 Percent Consumer Risk |
|---|---|---|---|---|---|---|
| ISO 2859-1 Normal | Level II (Code K) | 3,201 to 10,000 | 125 | 0 (AQL 0.10) | 1 | 1.84% |
| ISO 2859-1 Tightened | Level II (Code K) | 3,201 to 10,000 | 125 | 0 (AQL 0.065) | 1 | 1.84% |
| ANSI/ASQ Z1.4 Single | Level III (Code L) | 3,201 to 10,000 | 200 | 1 (AQL 0.25) | 2 | 1.94% |
| MIL-STD-1905C C=0 | Index AQL 0.25 | 3,201 to 10,000 | 96 | 0 | 1 | 2.37% |
| MIL-STD-1905C C=0 | Index AQL 0.10 | 3,201 to 10,000 | 200 | 0 | 1 | 1.14% |
| Calculations assume binomial distribution for lot defect rates with large lot sizes relative to sample quantities. LTPD values reflect the lot percent defective corresponding to a ninety percent probability of lot rejection. | ||||||

Worked Scenario for a Five-Thousand-Cell Shipment
An import lot consists of five thousand 280 Ah lithium iron phosphate prismatic cells distributed across twenty wooden crates. The procurement agreement specifies a zero-acceptance sampling plan based on an Index AQL of zero point one zero percent for safety-critical electrical parameters. Squeglia index tables for lot sizes between three thousand two hundred one and ten thousand units require a sample size of two hundred cells pulled randomly from across all twenty pallets.
Technicians apply stratified random sampling to guarantee even distribution throughout the container. Each of the twenty pallets yields ten cells: three from top layers, four from inner layers, and three from bottom tiers. Pulling only from top layers introduces clear sampling bias, missing base-level crushing damage or water intrusion that settles near pallet bottoms during ocean transport.
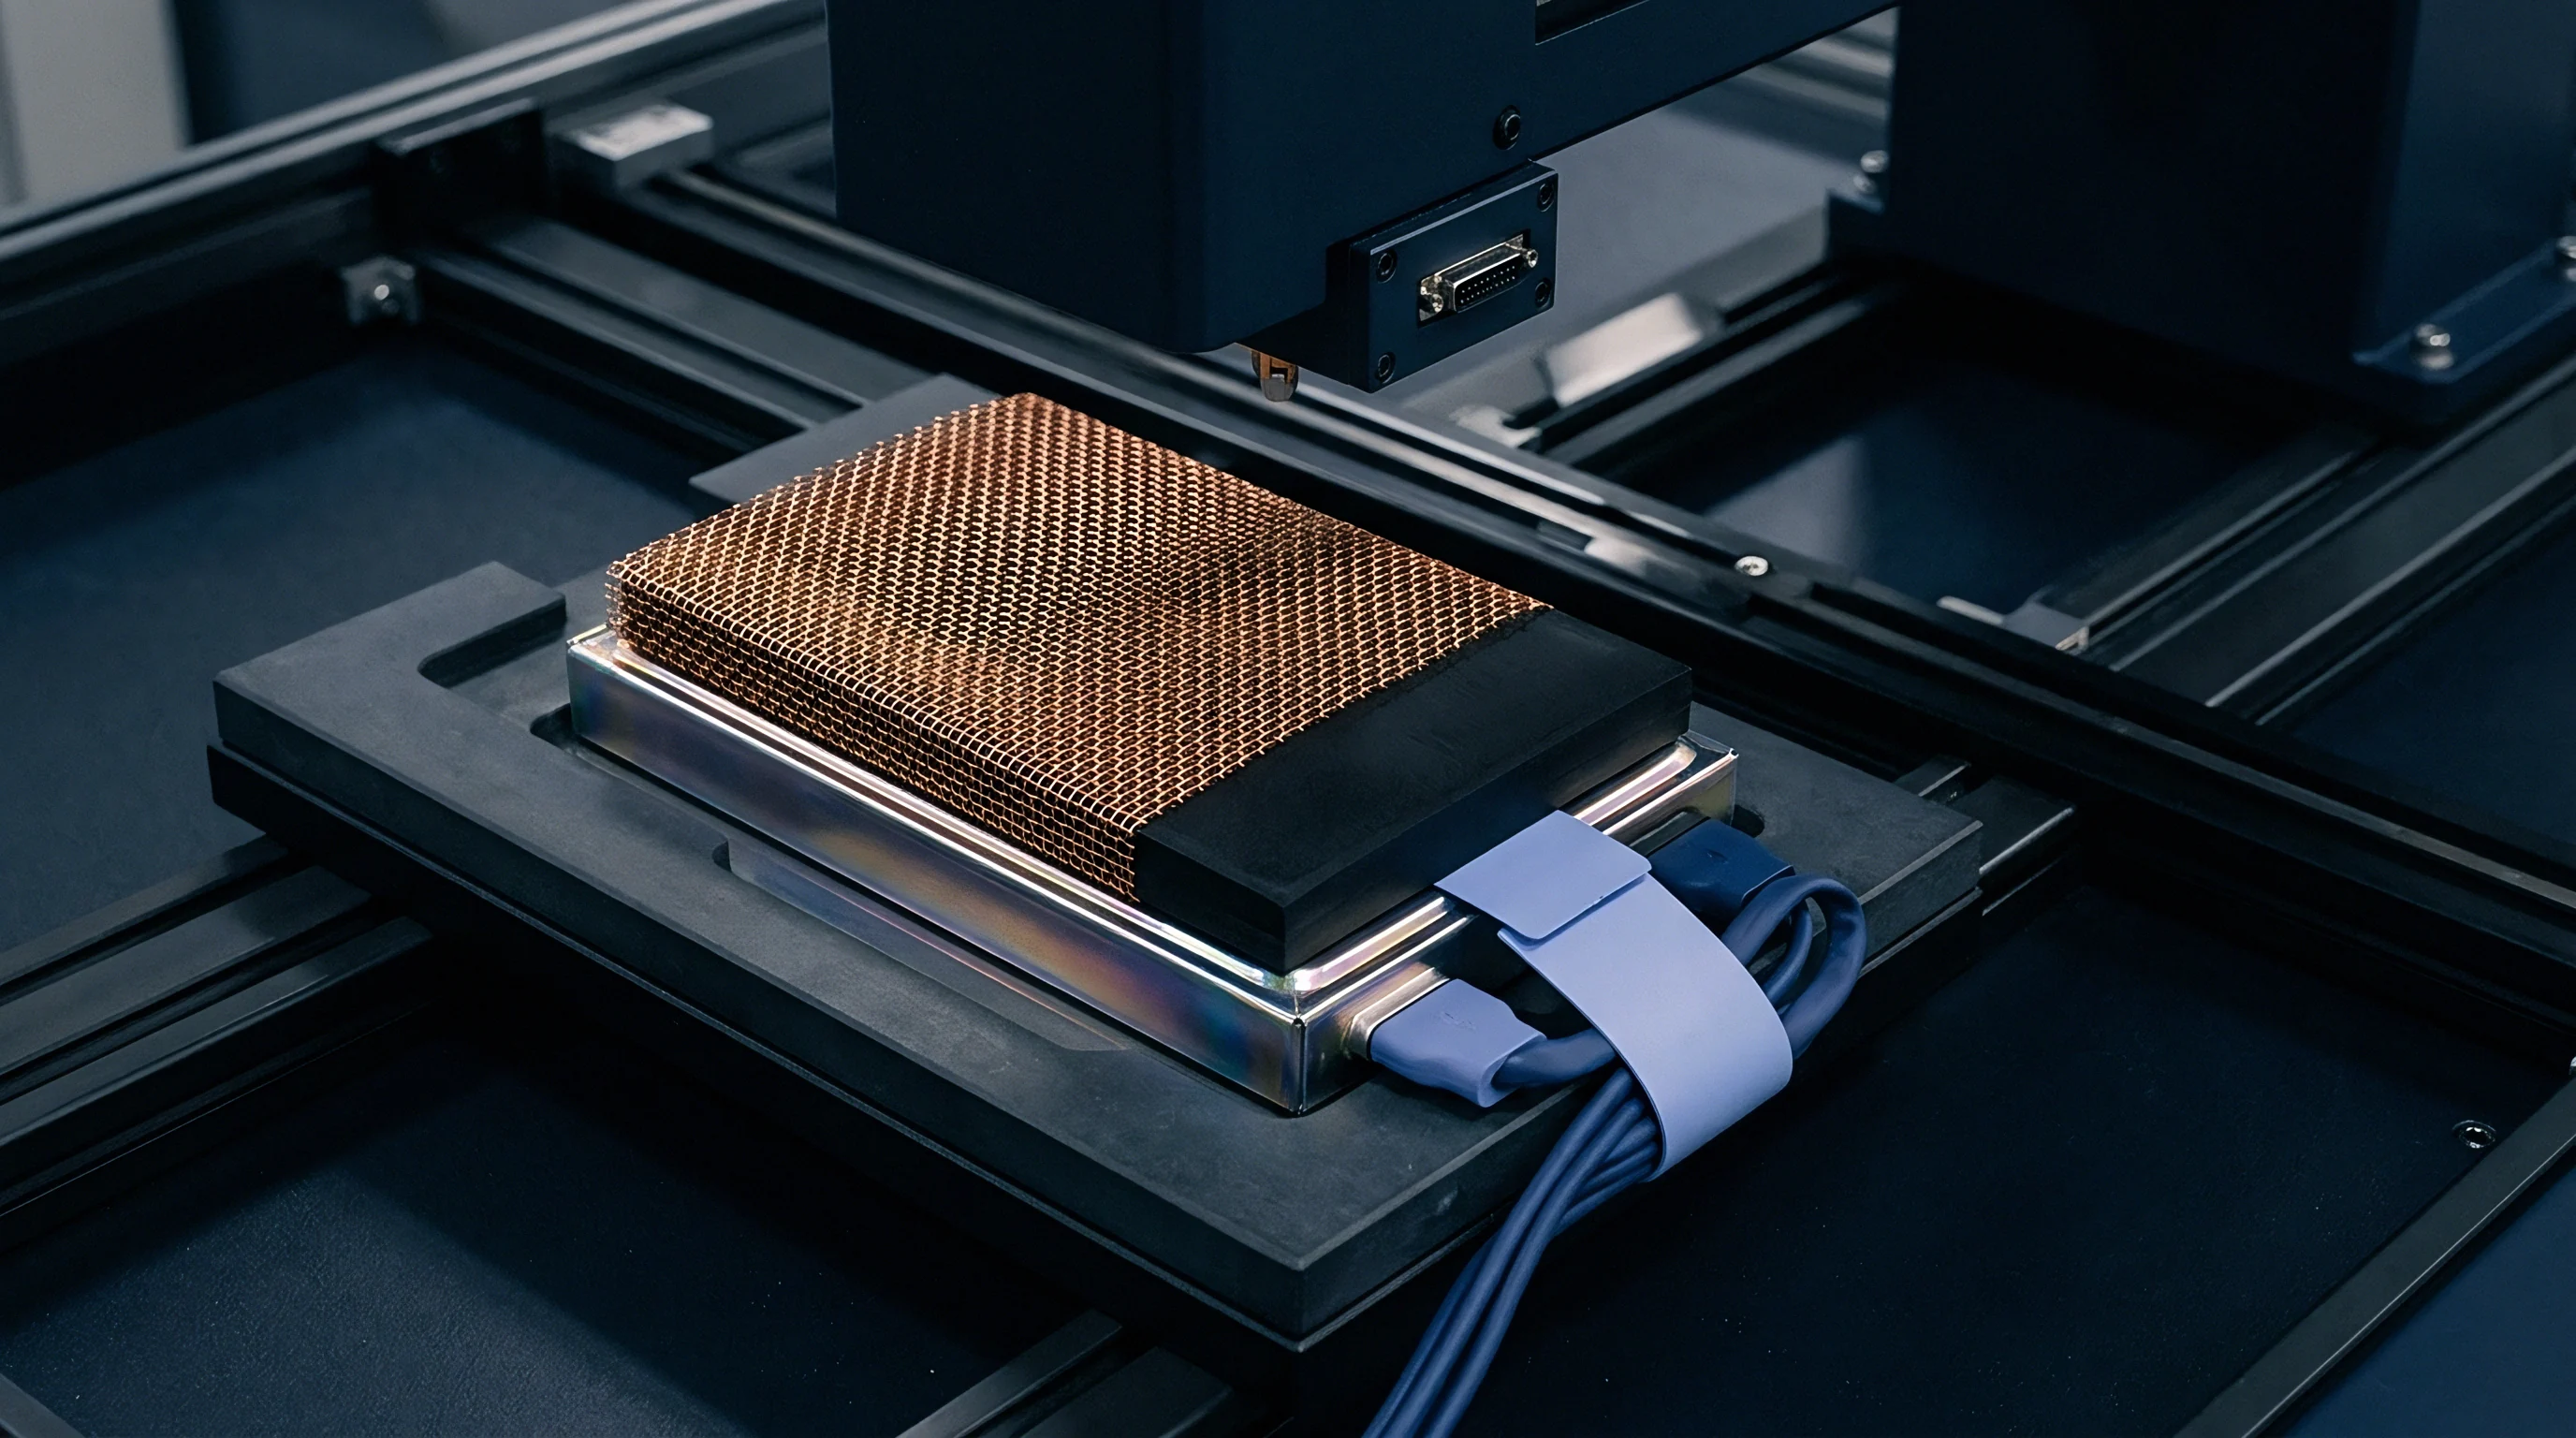
All two hundred units undergo open-circuit voltage screening, one kilohertz AC internal resistance measurement, high-voltage casing insulation tests, and optical dimensional scans. If every cell falls within published specifications and satisfies physical gauge checks, the shipment clears for pack assembly. If unit one hundred forty-seven registers an internal resistance of zero point eight five milliohms against an upper ceiling of zero point five zero milliohms, the lot fails inspection immediately.
Lot Rejection Probability follows the binomial probability distribution formula:
P(Acceptance) = (1 – p)^n
Where p represents the true underlying lot defect fraction and n represents the sample size. For a sample size of two hundred units under a zero-acceptance requirement, a true lot defect rate of just one percent results in an acceptance probability of:
P(Acceptance) = (1 – 0.01)^200 = 0.99^200 = 0.134 or 13.4%
The math shows that this sampling structure provides an eighty-six point six percent probability of turning away a lot carrying one percent defective units. Expanding the sample to three hundred fifteen units raises rejection confidence to ninety-five point eight percent for that same one percent defect rate, curbing consumer risk while increasing testing labor and fixture occupancy.
Zero-acceptance sampling plans shift the statistical burden of lot rejection entirely to the first observed non-conformity.
Selection Factors for Statistical Sampling Protocols
Balancing traditional ISO attribute schemes against zero-acceptance plans depends on several concrete operational constraints.
- Criticality of Pack Topology determines the allowable defect rate, because high-voltage series strings fail completely when a single cell exhibits excessive self-discharge or sudden capacity decay.
- Testing Channel Constraints govern the maximum sample volume achievable within production timelines, dictating whether high-density automated test benches are necessary to clear incoming container volumes.
- Supplier Manufacturing Maturity dictates whether inspection levels remain at normal baseline settings or escalate to tightened status following historical lot non-conformities.
- Destructive Testing Costs balance sample size decisions when evaluating internal weld strength or sectioning cell jellyrolls for microstructural inspection.
Statistical sampling plans function effectively only when sample extraction maintains rigorous randomness across the entire volume of imported crates.


Metrics
Verifying imported prismatic battery cells requires high-precision test routines capable of catching immediate manufacturing errors alongside subtle degradation patterns. Prismatic formats bring distinct mechanical and electrochemical verification challenges due to their rigid aluminum cans, large-surface electrode stacks, and sensitive pressure-relief safety vents. Comprehensive screening verifies basic electrical values, envelope dimensions, and hermetic seals before cells head to production modules.
Electrical screening starts with high-resolution open-circuit voltage and AC internal resistance readings. Digital voltmeters with six-and-a-half digit precision measure cell potential down to microvolts, establishing the baseline needed to track self-discharge. Four-wire Kelvin test fixtures bypass lead resistance and contact variation, enabling repeatable AC impedance checks at the standard one kilohertz test frequency.

Electrochemical Test Vectors and Self-Discharge Dynamics
Direct-current internal resistance tests assess polarization dynamics and lithium transport across the electrolyte-separator interface. Applying a high-current load pulse ~ typically one C-rate for ten seconds ~ causes a sudden ohmic drop followed by a gradual slope tied to charge-transfer resistance and diffusion limits. Calculating DC resistance from that voltage response under load highlights inconsistent electrode coatings or poor adhesion between current collectors and active material.
Tracking self-discharge relies on the K-value metric, expressed in millivolts per day. The figure captures open-circuit voltage loss over a specific storage window using the standard formula:
K = (V1 – V2) / (t2 – t1)
Where V1 and V2 represent open-circuit voltage readings taken at times t1 and t2, separated by a resting period of fourteen to twenty-eight days within a temperature-controlled environment held at twenty-five degrees Celsius. Tracking open-circuit potential drop over twenty-eight days isolates cells with microscopic separator pinholes. Cells exhibiting elevated K-values suffer from internal micro-shorts caused by burrs on slitted foil edges, localized iron impurity contamination, or accelerated parasitic reactions at the solid electrolyte interphase.
| Test Parameter | Measurement Method | Acceptance Tolerance | Primary Target Defect | Governing Standard |
|---|---|---|---|---|
| Open-Circuit Voltage (OCV) | 6.5-Digit DMM Kelvin Probe | +/- 2.0 mV from Lot Mean | State of Charge Mismatch, Self-Discharge | IEC 62660-1 |
| AC Internal Resistance (1 kHz) | Four-Wire AC Milliohm Meter | +/- 5.0% of Datasheet Max | Tab Weld Failure, Electrolyte Dry-out | IEC 61960-3 |
| DC Internal Resistance (10s Pulse) | High-Current Pulse Load Bench | Under Specified Ceiling (e.g. <0.6 mΩ) | Coating Delamination, SEI Growth | UL 2580 |
| K-Value (Self-Discharge Rate) | Dual OCV Drift over 21 Days | < 0.5 mV / Day at 25°C | Separator Pinholes, Metallic Contamination | Internal Factory Spec |
| Outer Casing Dimensions | Laser Line Profile Scanner | +0.5 mm / -0.2 mm Width/Thickness | Aluminium Shell Bulging, Swelling | ISO 1101 |
| Insulation Breakdown Resistance | 500 V DC Megohmmeter | > 100 MΩ (Terminal to Case) | Anode/Cathode Insulation Sleeve Breach | UL 1642 |
| Vent Weld Leak Rate | Helium Mass Spectrometer Sniffer | < 1 x 10^-6 mbar l/s | Defective Safety Vent Laser Weld | MIL-STD-883K |

Mechanical and Enclosure Integrity Verification
Prismatic form factors require tight dimensional tolerances to seat correctly in structural packs and cold plate assemblies. Outer aluminum dimensions expand under internal pressure and thermal cycling. Laser profilometers verify overall height, width, and thickness across several points while the unit is held under three hundred kilopascals of preload force to simulate pack restraint conditions.
Terminal height and surface planarity dictate the quality of busbar joints. Tilted or warped terminal faces reduce direct contact area against bolted or laser-welded copper-aluminum busbars, concentrating current flow and causing hot spots under heavy discharge. Automated vision fixtures verify terminal co-planarity against the top cover plate, failing units that exceed zero point two millimeters of runout.
Checking hermetic seals prevents electrolyte loss and air ingress over years of field operation. Sensitive helium mass spectrometers inspect laser welds across the top header, the electrolyte fill plug, and the safety vent disc. Enclosing cells in a vacuum chamber with tracer helium identifies leak rates higher than one times ten to the minus six millibar-liters per second.
Unchecked electrolyte seepage degrades structural adhesives, corrodes management system electronics, and bridges electrical isolation gaps.
Prismatic cells measured at twenty-five degrees Celsius after fourteen days of resting exhibit self-discharge voltage drops below zero point five millivolts per day under compliant electrolyte wetting.

Internal Stack Inspection via Non-Destructive Imaging
Computed tomography provides non-destructive inspection of internal electrode alignment and current collector tab joints. Industrial X-ray systems scan incoming samples to measure anode-to-cathode overhang along jellyroll edges. Insufficient overhang allows lithium to plate out as metallic dendrites around cathode boundaries during cold charging, creating direct short circuits and thermal runaway risks.
CT data tracks overhang dimensions through the entire jellyroll height, confirming active anode material extends at least zero point5 millimeters beyond the cathode boundary on all sides. Internal distortion ~ waving or buckling in the wound layers ~ points to uneven tensioning during cell winding. Pinched or creased separator sheets restrict ionic transfer and produce localized current crowding during high C-rate cycling.
Skipping insulation breakdown screening allows cells with compromised plastic outer sleeves to enter module assembly, causing direct high-voltage shorts to grounded aluminum pack frames upon installation.


Variance
Lot uniformity remains the clearest early indicator of long-term pack life and string balance. Even when every cell clears basic datasheet limits, broad statistical dispersion in capacity, internal resistance, or self-discharge rates creates chronic balancing issues in series strings. Statistical process control metrics gauge this homogeneity to confirm that incoming inventory comes from stable, well-controlled manufacturing runs.
Factory drift across parallel production lines introduces noticeable variation between lots turned out on different shifts or coating machines. Slurry batch inconsistencies, separator thickness drift, or trace moisture in the electrolyte yield distinct sub-populations within a single ocean container. Incoming screening separates these mixed groups using serial barcode decoding and cluster analysis prior to final binning.

Statistical Process Control and Process Capability Index
Capability indices measure how reliably a supplier produces cells within stated engineering limits. The index Cpk reflects both process spread and centering against specification limits, derived through the standard formula:
Cpk = min((USL – mu) / (3 * sigma), (mu – LSL) / (3 * sigma))
Where USL and LSL represent the upper and lower specification limits, mu represents the sample mean, and sigma represents the sample standard deviation. A process capability index below one point three three indicates excessive process spread or poor centering, signaling elevated production risk even if no individual tested unit violates absolute specification boundaries.
Evaluating incoming AC internal resistance data across a sample of two hundred cells provides a practical demonstration of Cpk analysis. If the manufacturer specifies a maximum AC internal resistance of zero point five zero milliohms with a target mean of zero point four zero milliohms, and test results yield a sample mean of zero point four three milliohms with a standard deviation of zero point zero three milliohms, the resulting upper process capability index calculates as:
Cpk = (0.50 – 0.43) / (3 * 0.03) = 0.07 / 0.09 = 0.78
This low capability index value alerts procurement engineers that the cell production line operates with excessive variability, predicting that future shipments will yield high rates of out-of-spec non-conforming units as manufacturing equipment wears.
| Parameter Metric | Target Capability (Cpk) | Maximum Coefficient of Variation (CV) | Statistical Distribution Model | Action Threshold on Cpk Failure |
|---|---|---|---|---|
| AC Internal Resistance (1 kHz) | > 1.67 | < 3.0% | Normal (Gaussian) | Enforce 100% Sorting / Quarantine |
| Discharge Capacity (0.5C) | > 1.33 | < 1.5% | Normal (Gaussian) | Downgrade Lot Grade Rating |
| Open-Circuit Voltage (Post-Soak) | > 2.00 | < 0.1% | Normal (Gaussian) | Re-evaluate Self-Discharge Soak Time |
| K-Value Drift Rate | > 1.33 | < 8.0% | Log-Normal / Weibull | Hold Lot for 14-Day Extended Aging |
| Cell Wall Thickness (Pre-Charge) | > 1.33 | < 2.0% | Normal (Gaussian) | Reject Lot for Enclosure Defect |

Weibull Reliability Analysis for Defect Distribution Tails
Gaussian models regularly miss the skewed, long-tail defect patterns typical of electrochemical degradation. Weibull distribution analysis handles early mortality and wear-out failures by fitting sample histories to two-parameter cumulative distribution curves. The shape parameter beta tracks failure rates over time: a value below one highlights infant mortality from assembly flaws, while a value above one signals classic mechanical or chemical wear-out.
Bimodal distributions in incoming test records generally point to mixed lots from brokers or third-party traders. Resellers occasionally mix lower-grade B-stock cells into shipments of prime A-grade stock to improve margins. Graphing internal resistance histograms for these lots exposes double peaks or elongated high-resistance tails that give away blended inventory.

Indicators of Cell Batch Anomaly and Sub-Standard Lots
Incoming verification protocols flag specific data patterns that indicate compromised lot quality or unverified manufacturing sources.
- Distorted Bimodal Parameter Distributions appear on capacity and internal resistance frequency plots when cells from different manufacturing lines or production dates are packed into the same ocean container.
- Scraped or Overprinted QR Codes on cell top covers conceal original factory serial numbers, masking true manufacturing dates, grade classifications, and factory origin data.
- Abnormal Coefficients of Variation in Open-Circuit Voltage exceeding zero point two percent across a rested pallet indicate inconsistent electrolyte aging or variable solid electrolyte interphase formation quality.
- Discrepancies Between Serial Number Batch Stamps and Bill of Lading Dates reveal long-term warehouse storage under unmonitored environmental conditions prior to export shipment.
Quality audits enforce a zero-acceptance threshold for vent valve score depth defects across every imported lot.
Whether statistical drift observed in low-rate initial production runs stems from uncalibrated slurry mixing equipment or shifting cathode precursor purity remains an open operational question for buyer-side quality audits.


Paperwork
Importing dangerous goods demands that regulatory filings, environmental clearances, and customs paperwork match physical container contents item-for-item. Inbound shipments of lithium iron phosphate and nickel manganese cobalt cells fall under strict maritime dangerous goods codes and domestic port controls. Mismatches between case markings, test reports, and bills of lading bring immediate customs holds, carrier impoundment, or loss of insurance coverage during transit incidents.
Customs entry relies on proper tariff assignment under the Harmonized System. Prismatic cells fall under HS Code 8507.60.00 for lithium-ion accumulators. That classification governs applied customs duties, trade remedies, and regional trade preferences.
Entering cells as finished modules or misreporting net mass energy densities triggers customs reviews, civil penalties, and container seizures at port terminals.

UN 38.3 Transport Testing Documentation Integrity
UN 38.3 transport certification is mandatory for any ocean or air movement of lithium cells. Section 38.3 of the United Nations Manual of Tests and Criteria outlines eight physical and environmental evaluations, spanning T.1 altitude simulation, T.3 vibration, T.7 overcharge, and T.8 forced discharge. Importers must secure a valid UN 38.3 Test Summary from an accredited laboratory before freight is accepted for vessel loading.
Sub-clause 38.3.5 details the mandatory contents for every valid Test Summary. The file must state the cell manufacturer name, laboratory report reference, test completion date, clear physical description of the format, unit mass, rated watt-hours, and pass status for all individual tests. Importers check that the part number stamped on the cell case matches the test certificate character-for-character; minor suffix differences often indicate alternate tab geometry or modified electrode chemistries requiring distinct UN filings.
Section thirty-eight point three point five of the United Nations manual renders uncertified lithium shipments liable to immediate port impoundment and carrier refusal.

CB Scheme, Safety Standards, and Transport Documentation Audit Procedure
Regulatory verification involves systematic validation of safety certificates, safety data sheets, and environmental transport tracking records before container arrival.
Completing this sequential paper audit protects importing entities against regulatory non-compliance penalties and confirms that transit conditions maintained cell integrity during ocean crossing.
Standard purchasing contracts incorporate statutory warranty lines stating that seller warrants all delivered products comply fully with UN 38.3 and IEC 62133-2 regulations, shifting financial liability for customs delays and transport fines back to the exporting entity.


Remedy
Uncovering non-conforming cells during receiving inspection triggers formal commercial claim procedures. Supply contracts establish clear paths when test metrics violate agreed Acceptance Quality Limits or zero-defect criteria. Immediate quarantine, clear defect dossiers, and formal escalation steps keep bad inventory off the module lines while preserving rights to cost recovery.
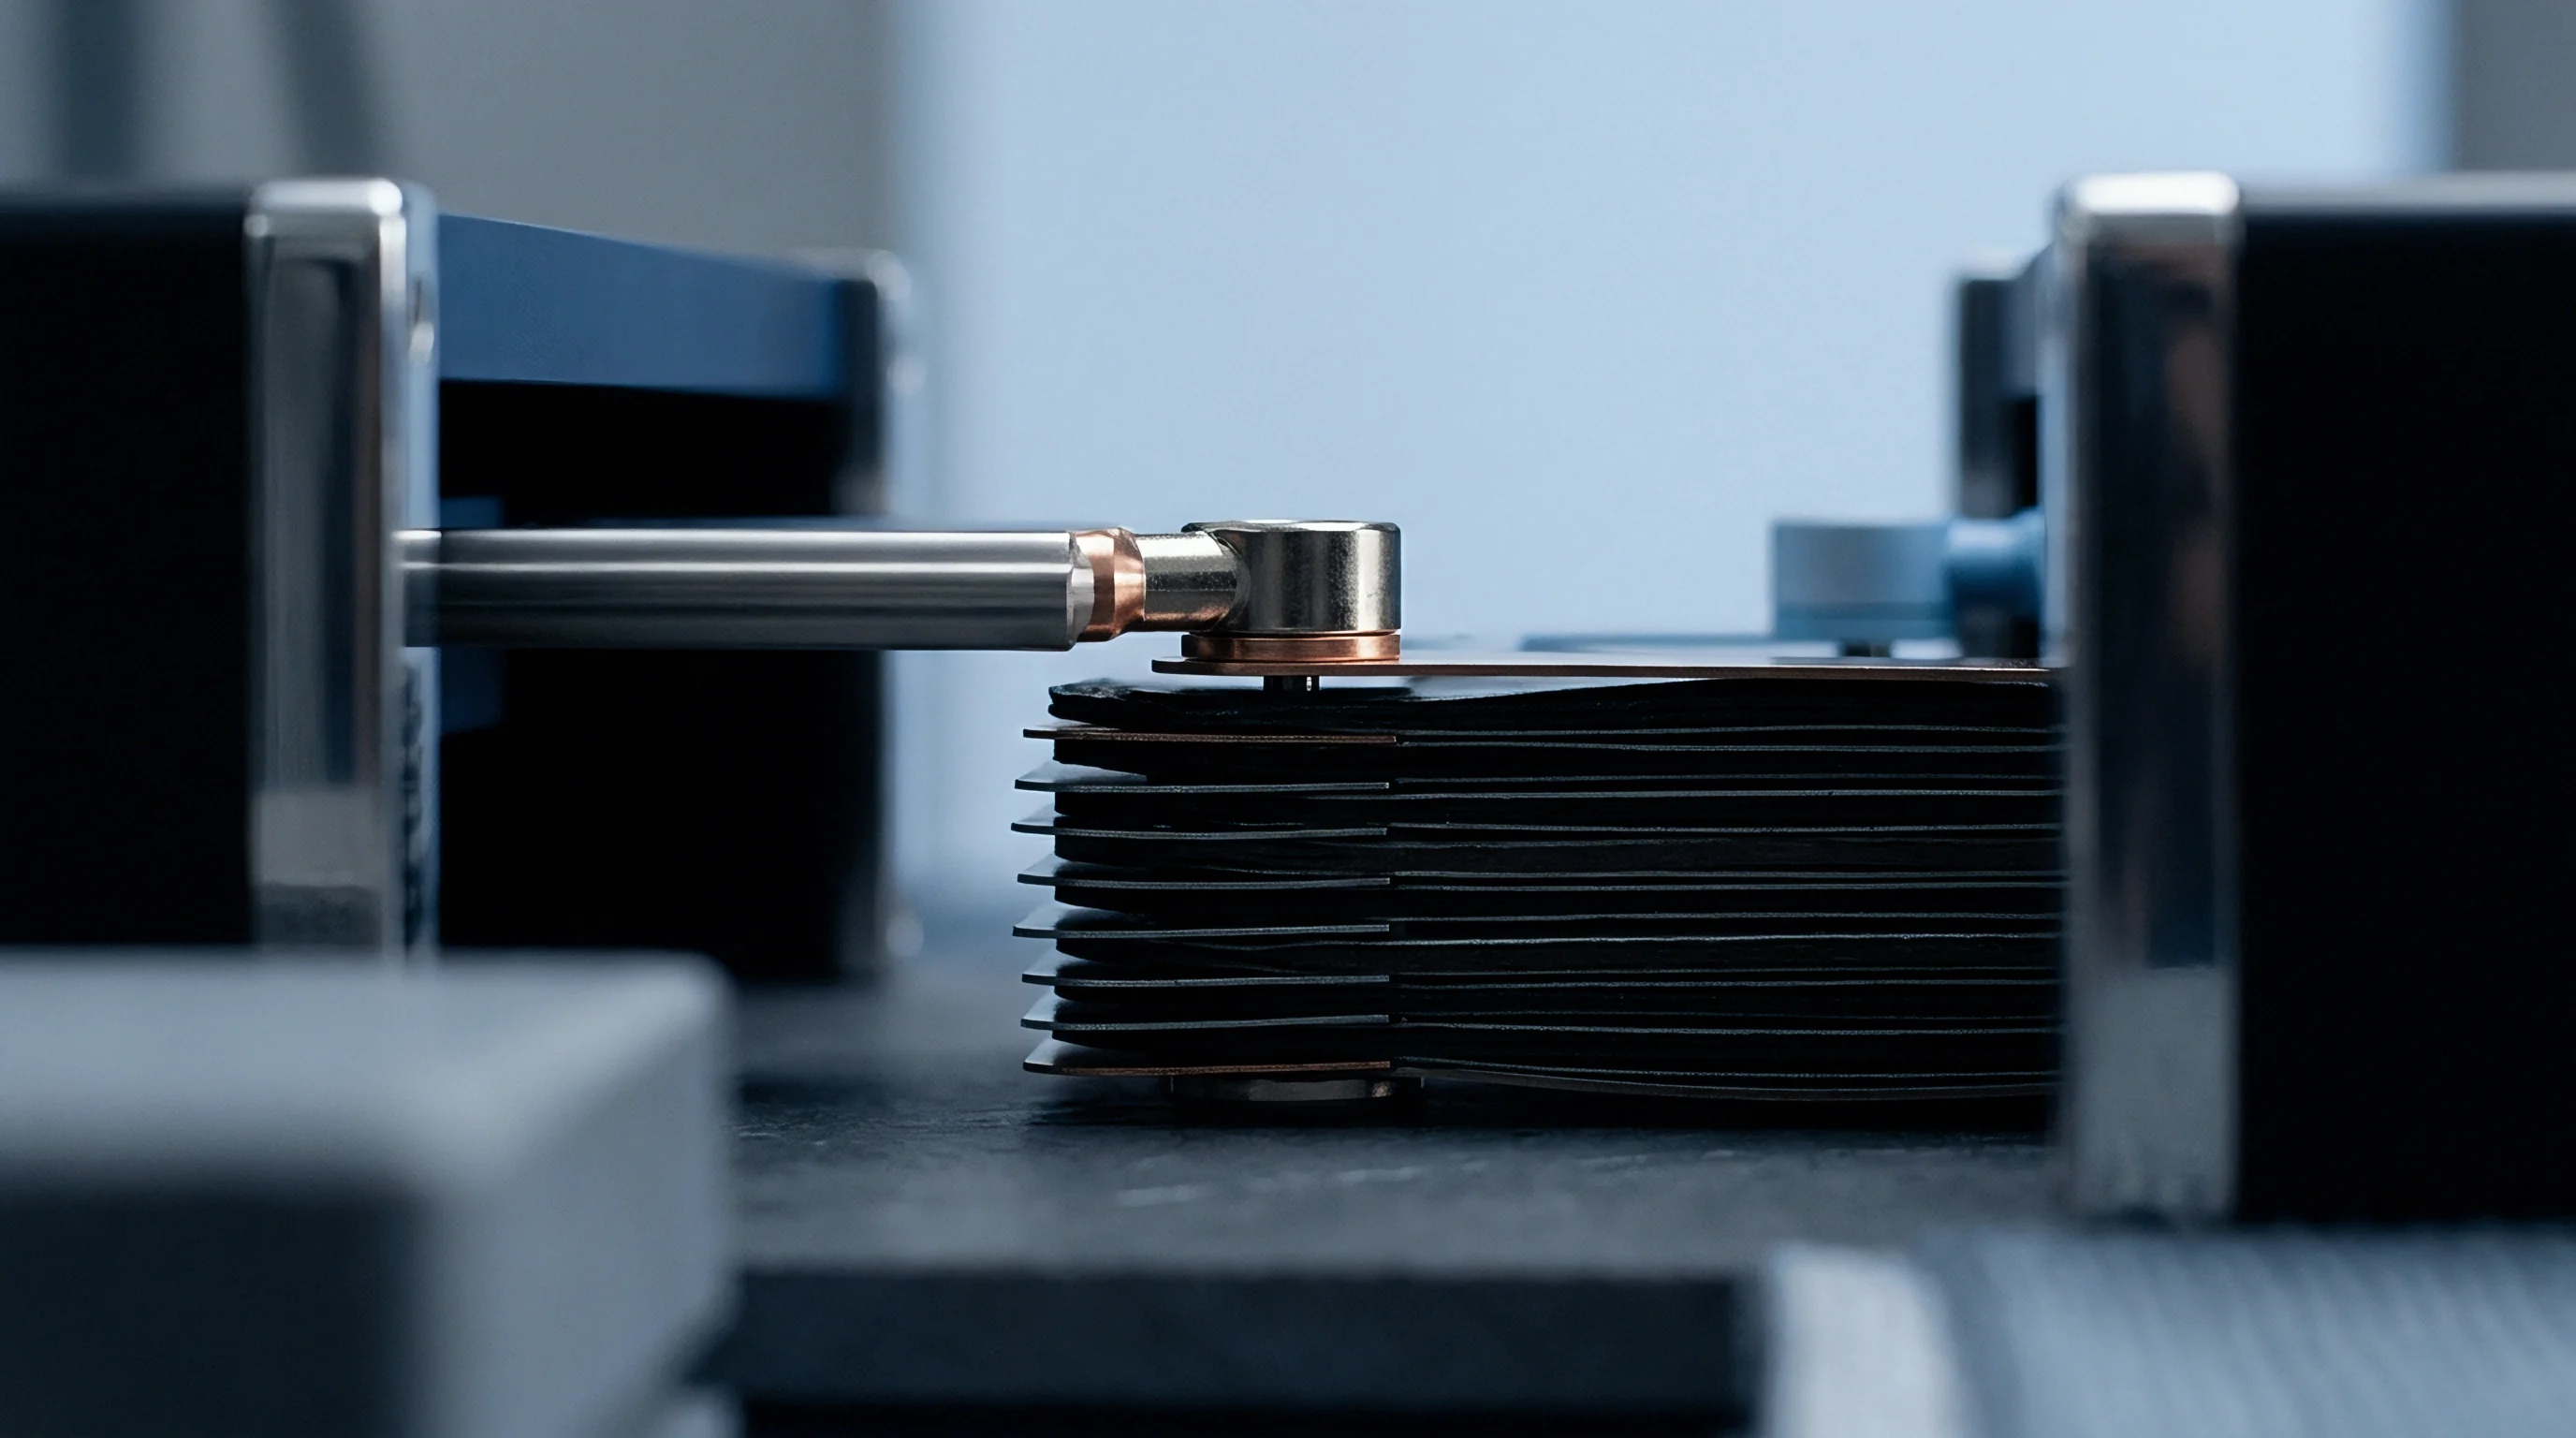
Filing a formal Defect Notice requires submitting complete testing evidence to the supplier within contractual claim windows, usually set between fourteen to thirty days from port arrival. The documentation package includes initial sampling manifests, bench calibration logs, process capability calculations, high-resolution photographs of physical damage, and CT scans revealing internal defects.
Quarantine Management and Return Material Authorization Protocols
Quarantine controls isolate non-compliant inventory both in the warehouse management software and on the floor. Automated systems apply hard allocation blocks across pallet barcodes associated with the failed production lot, keeping material handlers from moving suspect cells to pack lines. Caged holding zones with card-access gates secure the material under ongoing temperature monitoring while awaiting vendor review or freight pickup.
Requesting a Return Material Authorization (RMA) starts the financial settlement process. Once the supplier reviews confirmed test failures, they provide an RMA number permitting return shipment or on-site scrapping. Contracts define who pays for return ocean shipping, import tariffs, warehouse holding costs, and disposal fees.
Standard procurement terms place return shipping charges and tariff reimbursements directly on the seller.

Financial Recovery, Warranty Seams, and Landed Cost Arithmetic
Recovery channels track the payment structures laid out in the underlying supply agreement. Sourcing done through Irrevocable Letters of Credit allows buyers to include Quality Certificate Presentation terms. Under those provisions, the issuing bank cannot release payment until an accredited third-party inspector or designated quality manager signs off that incoming inspection passed the required AQL thresholds.
Under open account terms or direct wire transfers, landed cost adjustments clear through credit memos balanced against outstanding vendor invoices. Mandatory double-sampling on initial factory shipments cuts incoming batch variance by thirty-two percent. Comprehensive landed cost calculations account for scrap rates, inspection hours, test equipment depreciation, and import duty clawbacks alongside base unit prices.
A clearly defined warranty boundary protects pack integrators when failures surface months into field service. Sourcing contracts define precise seams separating manufacturing flaws from damage sustained during module integration. The cell manufacturer carries liability for latent production defects like internal contamination or micro-shorts, provided dock inspection data proves the cells arrived within specification and production logs show pack assembly stayed within validated thermal, welding, and BMS parameters.
Establishing clear responsibility boundaries ensures that quality disputes resolve through objective engineering data rather than prolonged commercial friction.