Vacuum Brazed Aluminum Thermal Plate Inspection and Joint Quality Testing
Vacuum brazed aluminum plate acceptance demands 100 percent inline ultrasonic C-scan inspection and helium leak validation below 10-6 mbar L/s to prevent field coolant leaks.
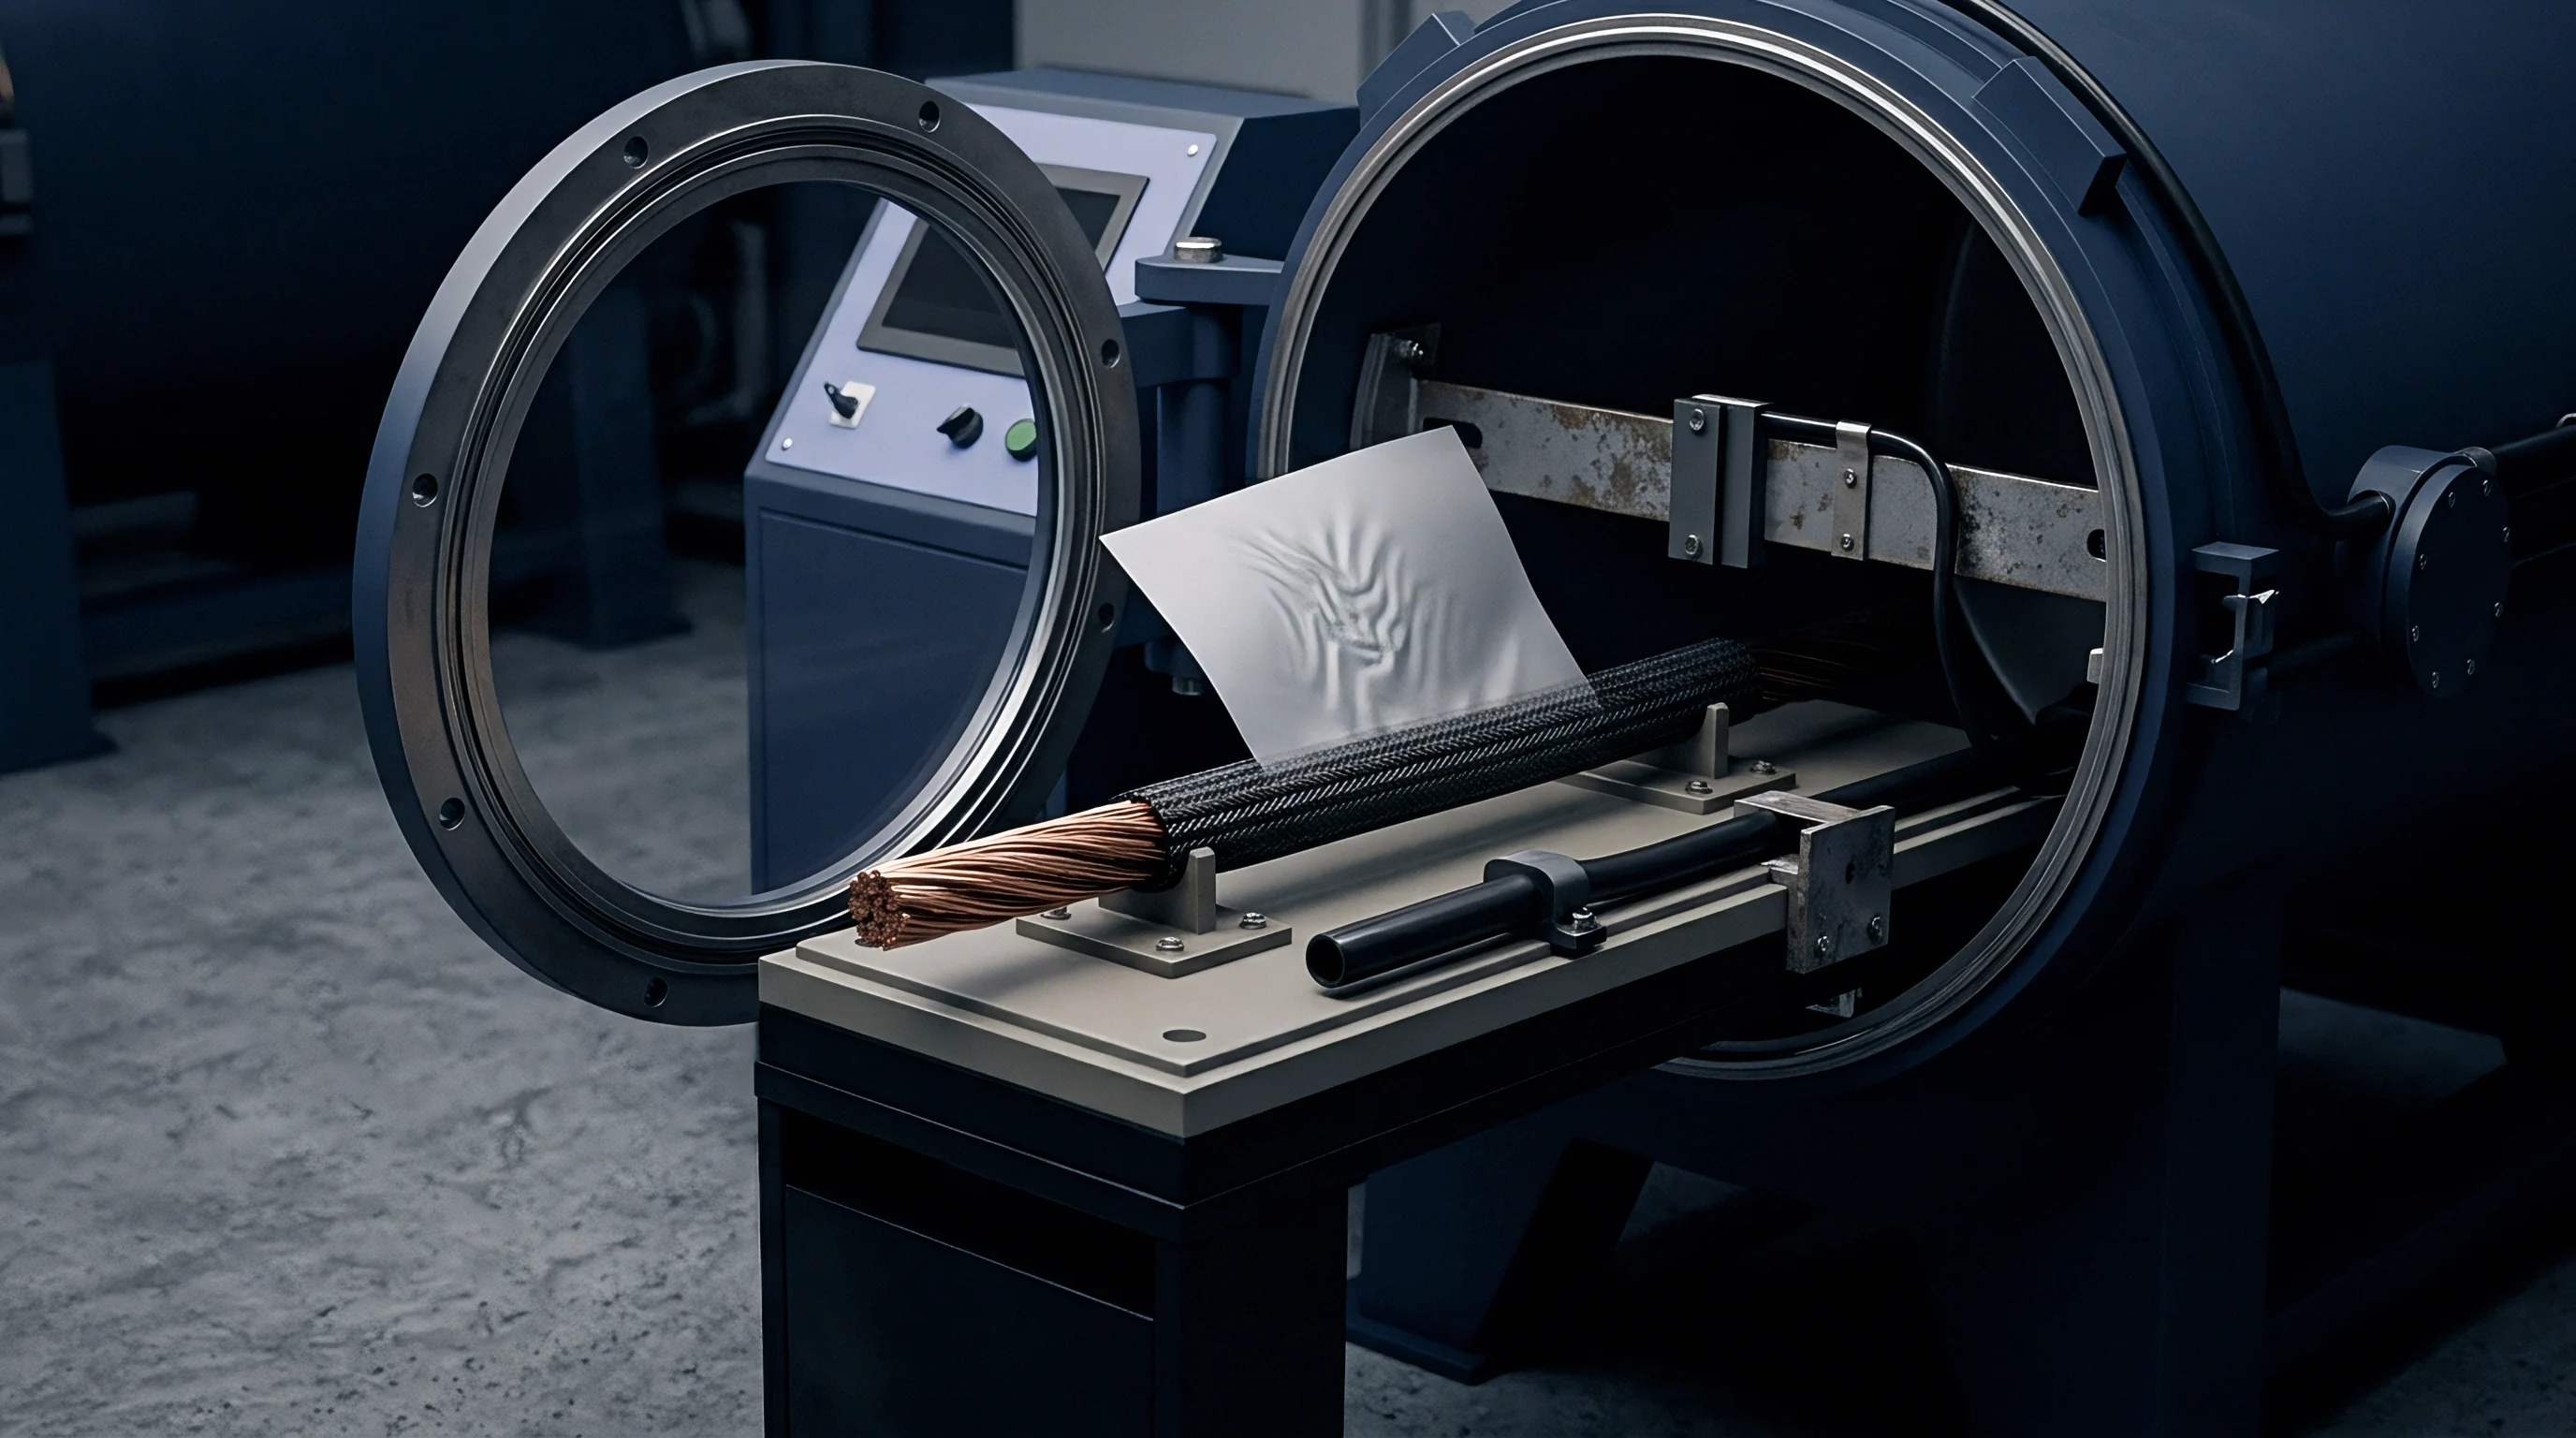

Void
Thermodynamic Mechanics of Vacuum Aluminum Brazing
Vacuum brazing aluminum thermal plates relies on precise temperature control to disrupt surface oxides without chemical fluxes. In electric vehicle battery packs and stationary storage modules, these plates maintain cell operating windows between 20 °C and 35 °C under high charge rates. Core sheet materials typically specify AA3003 or structural AA6061 alloys clad with an Al-Si filler alloy such as AA4343 or AA4004.
The clad layer, representing 5 percent to 10 percent of total plate thickness, melts between 577 °C and 600 °C. Magnesium additions within the filler alloy act as a getter, volatilizing at temperatures above 550 °C inside vacuum chambers operating at pressures below 10-4 mbar. This magnesium vapor reduces residual moisture and breaks down the protective aluminum oxide film covering the core plate channels, allowing liquid Al-Si eutectic alloy to flow into the joint gap through capillary action.
Process windows remain tight throughout the heating cycle. Ramping faster than 10 °C per minute introduces thermal gradients across large plates, skewing clearance gaps between internal channel ribs and the cover sheet. The optimal clearance gap ranges from 0.03 mm to 0.08 mm.
Gaps wider than 0.12 mm break capillary draw, causing liquid filler metal to slump into active fluid channels; gaps under 0.02 mm choke filler migration instead, trapping gas pockets into continuous linear unbrazed channels. Cleanliness is just as critical: organic residue from stamping oils or cleaning solvents decomposes during ramp-up, depositing amorphous carbon that halts eutectic wetting and leaves unbonded patches across contact zones.
Extended dwell times bring the risk of magnesium depletion. Holding peak temperatures above 595 °C too long drives excess magnesium evaporation, shifting filler metallurgy and raising its liquidus point. Liquid filler metal solidifies prematurely before completely filling internal seam geometries, leaving microscopic voids, incomplete fillets, and isolated bridging across fluid passages.
Cooling plates manufactured under these conditions show elevated thermal resistance across cell contact surfaces.
Peak vacuum chamber pressures above 5 × 10⁻⁴ mbar during clad melting cause immediate aluminum oxide re-formation, limiting wet area coverage below 85 percent of joint design specification.

Defect Typology in Internal Cooling Passages
Internal joint defects fall into distinct physical categories based on where they originate in the furnace cycle. Macro-voids ~ unbrazed areas larger than 1.0 mm in diameter ~ form primarily near channel bends or manifold transitions. Micro-voiding appears as spherical gas pockets between 0.05 mm and 0.30 mm, caused by hydrogen outgassing from core sheet stock.
During solidification, hydrogen solubility in liquid aluminum drops from 0.69 mL per 100 g to 0.04 mL per 100 g, driving gas phase separation at the advancing liquid-solid interface.
Channel intrusion happens when excess Al-Si clad metal bleeds out of the joint interface into coolant paths. Internal rib fillets require a radius between 0.2 mm and 0.4 mm to distribute mechanical stresses without restricting fluid volume. Excessive clad thickness or over-clamping during fixture compression forces liquid metal into coolant channels, creating flow blockages that alter pressure drops across parallel cooling circuits, reduce local coolant flow, and cause temperature spikes in adjacent battery cells.
Slow cooling permits intermetallic phase segregation along braze seam margins. At cooling rates below 5 °C per minute, coarse silicon particles agglomerate within the Al-Si eutectic matrix. These large silicon needles act as stress concentrators under cyclic hydraulic loading, where dynamic pressure changes from pump cycles induce micro-cracking along coarse silicon phases and lead to premature joint wall fatigue.
Unbrazed areas degrade both structural rigidity and heat transfer pathways. Non-contact areas block thermal conduction from cell baselines into fluid channels, creating localized hot spots. Structurally, non-bonded regions act as internal stress risers during pressure surges or mechanical shock testing, concentrating mechanical loads along fillet boundaries.
Structural integrity relies on balanced braze alloy distribution across all load-bearing internal ribs. Unbrazed spans longer than three channel widths allow the cover sheet to bulge when internal pressure reaches operating limits. Bulging alters mechanical stack pressure within battery modules, compressing cell separators unevenly and accelerating localized lithium plating.
Defect distributions follow clear thermal patterns across the assembly. Edge zones absorb higher radiant heat in vacuum furnaces, starting clad flow before interior channels reach target temperatures. Interior channels respond more slowly, producing incomplete joints if dwell times fail to equalize thermal mass across the assembly, while thorough cleanliness limits oxide formation throughout.
- Volatilized getter contamination occurs when vaporized magnesium deposits on cooler furnace tooling and drips back onto assembly surfaces, blocking uniform eutectic wetting along peripheral joints.
- Fixture clamping drift stems from thermal expansion mismatches between stainless steel compression fixtures and aluminum plates, dropping joint pressure at peak temperature.
- Core alloy grain growth occurs during extended soak times above 590 °C, lowering post-braze tensile strength in heat-affected zones adjacent to fluid channels.
- Hydrogen outgassing voids form along liquid filler margins when sheet stock contains dissolved gas levels exceeding 0.15 mL per 100 g of core metal.
Unbrazed edge sectors frequently stem from transient furnace atmosphere fluctuations during peak vacuum pumping phases.

Acoustics

Ultrasonic C-Scan Inspection Metrology
Non-destructive evaluation of internal braze joints relies primarily on high-frequency pulse-echo ultrasonic testing (UT). Automated C-scan imaging uses immersion testing protocols where water serves as an acoustic coupling medium between the transducer and the aluminum thermal plate. Acoustic waves pass through the upper plate skin and reflect off internal interfaces.
Aluminum exhibits an acoustic impedance of roughly 17.0 × 10⁶ kg/(m²·s), compared to 1.5 × 10⁶ kg/(m²·s) for water and near zero for air or vacuum voids. This mismatch at an unbrazed interface reflects nearly all incident sound energy back to the transducer.
Transducer selection sets the boundary between spatial resolution and penetration depth through aluminum cover sheets. Frequencies between 15 MHz and 50 MHz balance resolution requirements against acoustic attenuation in 3003-series alloys. Focus depth must align precisely with the internal braze interface depth, typically located 0.8 mm to 2.5 mm below the exterior contact surface.
Spherically focused transducers with focal lengths between 12.7 mm and 25.4 mm concentrate acoustic energy into tiny focal spots, enabling detection of micro-voids down to 0.10 mm in diameter. Signal processing gates evaluate peak amplitude returns within specific arrival time windows matching the braze joint depth.
Data acquisition rates dictate inspection throughput and spatial grid resolution. To satisfy Nyquist sampling criteria, raster scan step sizes cannot exceed half the focal spot diameter. A scan pitch of 0.05 mm using a 25 MHz focused transducer yields detailed C-scan images capable of mapping individual unbrazed regions across large cooling structures.
C-mode software translates signal amplitude returns into color-mapped representations, where high reflection amplitudes identify air-filled voids or non-bonded zones and low reflection amplitudes confirm sound metal-to-metal braze continuity.
Advanced setups employ phased array ultrasonic testing (PAUT) to improve speed and adapt to complex cooling plate geometries. Electronic beam steering allows phased array transducers to scan multi-level channel interfaces without mechanical Z-axis adjustments. Multi-element linear arrays synthesize focused beams across multiple depths simultaneously, capturing core sheet interfaces, rib fillets, and perimeter braze lines in a single pass, relying on acoustic impedance variations to reveal gaps.
Spatial calibration requires precision reference blocks fabricated from identical alloy compositions and skin thicknesses. Electro-discharge machined flat-bottom holes (FBH) placed in calibration blocks at depths corresponding to internal braze lines establish amplitude calibration curves. Signal-to-noise ratios must exceed 12 dB across the target inspection depth to maintain defect sizing accuracy under line inspection conditions.
| Transducer Frequency (MHz) | Focal Length (mm) | Focal Spot Size (mm) | Skin Thickness Range (mm) | Minimum Void Resolution (mm) |
|---|---|---|---|---|
| 15 | 25.4 | 0.32 | 1.5 to 3.0 | 0.25 |
| 25 | 19.0 | 0.18 | 0.8 to 1.8 | 0.12 |
| 35 | 12.7 | 0.11 | 0.5 to 1.2 | 0.08 |
| 50 | 6.35 | 0.07 | 0.3 to 0.8 | 0.05 |

Acoustic Signal Interpretation and Defect Mapping
Interpreting C-scan datasets requires distinguishing true unbrazed voids from geometry-induced reflection variations. Internal fluid channels generate structural reflections corresponding to wall transitions and rib radii. Time-of-flight (TOF) gating separates skin-to-channel reflections from skin-to-braze interface reflections.
When sound encounters a solid braze joint over an internal rib, energy passes through the joint into the rib core, returning a low-amplitude reflection. Over an unbrazed zone, acoustic energy cannot cross the air gap, creating a maximum-amplitude interface reflection equal to original skin surface echoes.
Signal processing software evaluates raw amplitude matrix data to calculate total percentage bond area across defined plate zones. Critical areas ~ such as surfaces directly underlying high-power battery cells ~ demand stringent bond area thresholds exceeding 95 percent overall contact, with zero individual unbrazed voids larger than 1.5 mm². Non-critical peripheral flanges permit relaxed coverage thresholds down to 85 percent total bonded area.
Automated defect recognition algorithms scan amplitude matrices, applying thresholding filters to isolate defect contours and compute individual defect surface areas.
Attenuation effects from surface roughness distort acoustic measurements. Cold-rolled aluminum sheet with surface roughness values (Ra) exceeding 1.6 µm causes scattering of high-frequency acoustic waves, attenuating the signal beam and generating false-positive defect indications. Surface preparation using light mechanical polishing or chemical etch passes lowers surface noise, ensuring acoustic energy enters the component uniformly.
Water cleanliness in the immersion tank is equally important: microscopic air bubbles suspended in un-degassed coupling water scatter sound waves, introducing random signal dropouts during automated scanning cycles.
According to ISO 17636 and ASTM E1032 inspection guidelines, NDT calibration procedures must verify signal-to-noise margins using flat-bottom hole references before every production shift to prevent defect sizing drift.
Defect depth profiling relies on precise time-of-flight measurements. Sound velocity in 3003 aluminum alloy averages 6,320 meters per second for longitudinal waves. By measuring the microsecond arrival time of reflection peaks relative to initial surface entry echoes, inspection systems calculate defect depth with accuracy better than ±0.03 mm.
This depth resolution allows engineers to distinguish skin-laminar defects within raw sheet stock from true braze interface un-bonds.
False indications inflate scrap rates by causing unnecessary plate rejections. These false positives frequently arise from localized variations in clad layer thickness. Thin clad regions generate altered reflection profiles that mimic unbrazed voids if evaluation software relies solely on single-amplitude gating without analyzing full RF waveform signals.
Separating shallow clad voids from deep channel non-bonds during automated line scanning requires evaluating full RF waveform signals rather than single amplitude gates.

Permeation

Leak Detection Mechanics and Tracing Protocols
Fluid circuit integrity in aluminum liquid cooling plates determines long-term protection against electrical short circuits in high-voltage battery systems. Cooling fluids containing water-glycol mixtures leak through microscopic braze defects under pressure. Leak testing verifies structural seam continuity before thermal plates enter module assembly.
Testing protocols rely on pressure decay methods and mass spectrometry tracing with helium gas to detect leak rates down to 10-8 mbar·L/s.
Pressure decay testing measures pressure drops across a sealed plate volume over time, serving as a rapid inline screening step. A plate fills with dry nitrogen or clean dry air to a target pressure between 2.0 bar and 6.0 bar. After a stabilization phase that allows gas compression heat to dissipate, pressure transducers monitor pressure loss over a set dwell time.
Differential pressure decay systems compare test plate pressure against a sealed reference volume, improving measurement sensitivity to 0.01 mbar pressure drops. Temperature control is critical during decay testing: an ambient temperature change of 1.0 °C induces a pressure shift of approximately 3.4 mbar inside a 3.0 bar sealed volume, masking true micro-leaks or indicating false rejections.
Helium mass spectrometry offers high sensitivity for micro-leak identification. Testing occurs inside vacuum chambers where the cooling plate interior connects to a helium charging manifold. The outer chamber evacuates to pressures below 10-1 mbar before charging internal plate channels with 100 percent helium gas at 1.5 bar to 3.0 bar pressure.
Spectrometers analyze chamber gases to detect helium atoms escaping through microscopic structural pathways. Vacuum accumulation testing measures total integrated leak rates across the entire plate assembly, isolating defects that escape differential pressure detection.
When vacuum accumulation flags a plate failure, sniffer testing provides localized leak identification. The plate pressurizes with a 20 percent helium and 80 percent nitrogen tracer mix at 3.0 bar. A robotic or manual sniffer probe moves along external braze lines at speeds below 10 mm per second, drawing air samples into a mass spectrometer.
Sniffer probes pinpoint exact micro-defect locations along complex manifold seams, guiding rework operations or scrap analysis.
Dynamic ranges vary widely across detection protocols. Pressure decay systems evaluate gross leaks down to 10-3 mbar·L/s, covering physical cracks or large unbrazed seams. Vacuum helium testing reaches resolution levels of 10-9 mbar·L/s, catching sub-micron pathways capable of leaking coolant under operating temperatures.
Battery pack specifications typically establish pass-fail thresholds at 10-6 mbar·L/s for water-glycol fluid loops.
| Inspection Method | Tracer Medium | Minimum Detectable Leak Rate (mbar·L/s) | Test Pressure Range (bar) | Typical Cycle Time (s) |
|---|---|---|---|---|
| Absolute Pressure Decay | Dry Air / N2 | 10-2 | 1.5 to 6.0 | 10 to 20 |
| Differential Pressure Decay | Dry Air / N2 | 10-4 | 1.5 to 6.0 | 15 to 30 |
| Helium Sniffer Mode | 5%-20% He in N2 | 10-5 | 2.0 to 5.0 | 45 to 90 |
| Vacuum Helium Accumulation | 100% He | 10-8 | 1.0 to 4.0 | 20 to 40 |

Hydraulic Proof and Burst Testing Protocols
Proof testing verifies structural integrity against short-term hydraulic pressure surges during pump start-up or fast-charging thermal management sequences. Testing protocols subject thermal plates to proof pressures equal to 1.5 to 2.0 times maximum working pressure, typically ranging between 4.0 bar and 8.0 bar. The plate fills with deionized water or low-viscosity testing fluid, bleeds residual air pockets, and holds peak pressure for 30 to 60 seconds.
High-accuracy linear variable differential transformers (LVDTs) measure elastic wall deformation during pressurization, ensuring wall deflections remain within design limits to prevent cell displacement within module frames.
Burst testing pushes plates past plastic deformation to catastrophic structural rupture, establishing safety margins over operating limits. Vacuum brazed aluminum cooling plates must achieve burst pressures between 12.0 bar and 25.0 bar depending on core wall thickness and internal rib spacing. Burst testing records pressure curves versus volume expansion to pinpoint failure mechanisms.
Failures initiating along internal rib braze lines indicate poor filler metal capillary flow or insufficient braze fillet coverage, while failure along parent core metal indicates sound joint design.
- Fill internal cooling channels with deionized water while venting trapped air through elevated exit ports.
- Increase fluid pressure at a controlled rate of 0.5 bar per second until reaching specified proof pressure.
- Maintain target proof pressure for 60 seconds while automated optical systems measure plate skin expansion.
- Depressurize component and verify permanent plastic deformation remains below 0.05 mm across cell seating areas.
- Ramp fluid pressure continuously at 1.0 bar per second until structural failure occurs, recording peak pressure and burst origin location.
Ultimately, measured leak rates dictate expected product field life under operational thermal cycles.

What Signal Threshold Distinguishes Permeation from Fine Leaks?
Distinguishing true structural micro-leaks from material permeation requires evaluating signal behavior during vacuum helium testing. Helium gas dissolves into organic seals, rubber hoses, and surface oil films, slowly desorbing into vacuum chambers during long testing cycles. This background desorption generates a rising baseline signal that mimics true micro-leaks through braze joints.
True micro-leaks produce immediate signal spikes when tracer gas enters physical leak paths, establishing steady-state signal plateaus within seconds. Permeation signals show slow exponential growth that persists after purging tracer gas from internal channels.
Testing parameters governed by EN 1779 require helium leak test systems to perform automatic background subtraction cycles every thirty minutes to ensure tracer gas absorption into test fixtures does not obscure true structural braze micro-leaks.
Mass spectrometers isolate helium ions using magnetic sector analyzers. The system measures current generated by ionized tracer gas hitting detector plates, converting current levels into calibrated leak rate values. Sensor calibration relies on certified capillary leak standards that release helium at known rates, such as 5 × 10⁻⁷ mbar·L/s, maintaining measurement accuracy within ±5 percent of true values.
Cleanliness within test chambers prevents signal distortion, as hydrocarbon lubricants generate background ion noise that obscures low-level helium signals and demands routine chamber baking and dry vacuum pump maintenance.
Moisture inside cooling plates impedes micro-leak detection. Capillary action draws water into narrow braze cracks smaller than 1.0 µm, blocking helium gas flow during vacuum testing. High-pressure dry nitrogen purging or vacuum oven drying prior to leak testing removes trapped liquid, clearing physical pathways for tracer gas detection.
Inside micro-leaks smaller than 0.1 µm, gas flow shifts from viscous continuum flow to Knudsen molecular flow, where gas molecules collide primarily with channel walls rather than other gas molecules. Molecular flow rates scale with the square root of gas molecular weight, making low-density helium the ideal tracer medium for fine leak verification.
Cooling plate surface temperature impacts test consistency. Elevated plate temperatures increase gas kinetic energy, accelerating helium flow through fine passages and distorting calibrated leak rate readings. Maintaining plate temperatures within 20 °C ± 2 °C during test cycles holds readings within reproducible standard ranges.
Gross leaks can bypass fine helium mass spectrometry detection entirely if test chambers evacuate too rapidly. Large braze gaps allow internal tracer gas to vent into vacuum pumping systems during preliminary chamber pump-down, leaving no residual helium inside the plate when fine detection gates open. Automated leak systems integrate gross pressure decay checks prior to chamber evacuation, verifying overall enclosure integrity before initiating high-vacuum mass spectrometry passes.
Plates passing gross leak and fine helium inspection enter mechanical verification stages.
Microstructure
Metallographic Evaluation and Intermetallic Characterization
Destructive metallographic sectioning validates non-destructive C-scan and leak test datasets, providing physical verification of braze joint structures. Precision diamond wafering saws cut sections through internal ribs, manifold transitions, and perimeter braze lines. Samples undergo mounting in epoxy resin, followed by sequential mechanical grinding using silicon carbide papers down to 1200 grit.
Final polishing uses diamond suspensions down to 1.0 µm and colloidal silica suspensions at 0.04 µm to reveal true grain boundaries, clad phase distribution, and intermetallic structures without altering soft aluminum matrix geometry.
Etching polished specimens with Keller’s reagent (95 mL H2O, 2.5 mL HNO3, 1.5 mL HCl, 1.0 mL HF) for 10 to 20 seconds exposes aluminum grain boundaries and differentiates core alloy microstructures from Al-Si eutectic braze zones. Optical microscopy and scanning electron microscopy (SEM) with energy-dispersive X-ray spectroscopy (EDS) analyze phase distributions within braze fillets. Sound vacuum braze joints display a continuous Al-Si eutectic structure consisting of fine, well-dispersed silicon particles within an alpha-aluminum solid solution matrix, avoiding coarse intermetallics that reduce joint ductility.
Excessive peak temperature or extended soak times drive silicon diffusion from the molten clad layer deep into core sheet grains. This grain boundary penetration weakens core alloy boundary networks, predisposing the material to intergranular corrosion and stress-corrosion cracking under humid field operating environments. Intermetallic compounds such as Fe3SiAl12 form when iron impurities in 3003 core sheet react with liquid silicon filler.
Large, brittle iron-rich intermetallic plates exceeding 5.0 µm in length act as cleavage sites, reducing fatigue resistance under repeated pressure cycling.
Fillet geometry dictates mechanical stress distribution across channel ribs. Optimum joint performance requires smooth, concave braze fillets with contact angles (thη) below 30 degrees relative to core sheet surfaces. Convex fillets or irregular wetting angles above 60 degrees signal insufficient vacuum quality, oxide contamination, or under-heating during furnace runs.
Joint gap fill must exceed 90 percent of original joint width, with residual micro-voiding restricted to isolated spherical gas pores under 50 µm in diameter.
| Quality Criterion | Class A (High Reliability) | Class B (Intermediate) | Class C (General Purpose) |
|---|---|---|---|
| Minimum Joint Fill Percentage | 85% Total Joint Area | 75% Total Joint Area | 60% Total Joint Area |
| Maximum Single Void Dimension | 20% of Joint Width | 30% of Joint Width | 40% of Joint Width |
| Maximum Edge Void Incursion | 10% of Lap Length | 15% of Lap Length | 25% of Lap Length |
| Permissible Fillet Imperfections | Pinholes | Pinholes | Pinholes |
Mechanical Tensile Shear and Fatigue Testing
Mechanical verification evaluates structural load capacity under static and dynamic loading regimes. Lap shear specimens harvested directly from brazed thermal plates undergo mechanical testing per AWS B2.2 standards. Tensile testing frames pull joint specimens to failure at crosshead speeds between 0.5 mm and 1.0 mm per minute, recording peak shear load and yield strength.
High-quality vacuum brazed joints between AA3003 core sheets typically achieve lap shear strength values between 50 MPa and 75 MPa, with structural failure occurring via core sheet necking outside the braze zone rather than joint interface shear.
Interface shear failure indicates poor metallurgical bonding, excessive intermetallic segregation, or micro-void density exceeding specification limits. Fracture surface analysis using SEM reveals fracture modes: dimpled ductile fracture surfaces confirm sound metallic bonding across alpha-aluminum phases, while cleavage fracture surfaces or smooth un-bonded plate areas reveal incomplete clad melting, surface oxide entrapment, or insufficient clamping force during furnace processing.
Fatigue testing simulates operational pressure pulsations induced by coolant pump cycles over vehicle lifespans. Test rigs cycle internal hydraulic pressure between 0.5 bar and 4.0 bar at frequencies between 1.0 Hz and 5.0 Hz, targeting minimum endurance thresholds of 100,000 cycles without structural leakage or plastic joint deformation. S-N fatigue curves generated from accelerated test regimes establish mechanical endurance limits, ensuring joint designs resist cyclic fatigue damage throughout target product operating lives.
AWS C3.7M Class A specification mandates that metallographic cross-sections of critical internal structural joints demonstrate zero un-bonded continuous paths exceeding 1.5 mm in length across active liquid channel boundaries.
Micro-hardness mapping across braze cross-sections identifies localized mechanical property shifts. Vickers micro-hardness (HV0.1) testing reveals hardness gradients across core sheet, heat-affected zones, and Al-Si joint centers. Un-brazed core sheet typically registers 35 HV to 40 HV in the fully annealed O-temper condition resulting from furnace braze thermal cycles.
Joint centers display higher hardness values between 55 HV and 75 HV due to fine silicon phase dispersion within eutectic matrices. Excessive hardness spikes above 90 HV signal dense iron-silicon intermetallic concentration, indicating localized embrittlement and heightened fracture risk.
Thermal shock cycling tests structural joints under rapid temperature swings matching extreme fast-charging conditions. Assemblies undergo thermal cycling between -40 °C and +85 °C with transfer times under 10 seconds, completing 500 to 1,000 continuous cycles. Coefficient of thermal expansion (CTE) mismatches between internal structural reinforcements and core skins induce shear stresses across braze fillets.
Post-test inspection using ultrasonic C-scan and helium leak detection verifies joint integrity remains intact without micro-crack initiation along fillet margins.
Structural qualification datasets complete the metallurgical dossier, moving component evaluation from lab validation to factory acceptance agreements.
Rejection

Commercial Acceptance Frameworks and Quality Agreements
Establishing commercial quality boundaries requires translating physical inspection metrics into contractually enforceable quality agreements. Automotive and energy storage supply contracts govern incoming inspection pass-fail criteria, lot tolerance percent defective (LTPD) limits, and non-destructive evaluation coverage levels. Sourcing specifications dictate whether inspection protocols execute as 100 percent inline production screening or statistical sampling plans governed by ISO 2859-1 standards.
Visual inspection standards open the line acceptance sequence. Plates undergo visual review under 1,000-lux illumination to detect physical skin damage, surface denting, clad flash, or perimeter braze overflow. Surface defects such as scratches deeper than 0.05 mm or skin dents exceeding 0.20 mm depth trigger automatic lot containment, as localized skin deformations disrupt contact pressure distributions against battery cells.
Surface flatness tolerances across cell seating zones typically specify non-coplanar variance under 0.3 mm per 1,000 mm of span length, preventing gap variations across interface thermal pads.
Non-destructive C-scan evaluation thresholds must define both global bond area percentages and local defect grouping limits. Quality clauses mandate 100 percent inline C-scan inspection for thermal plates assigned to high-voltage electric vehicle packs. Acceptance criteria reject any component exhibiting total bonded area below 92 percent of active channel surface.
Furthermore, agreements forbid un-bonded clusters where three or more micro-voids larger than 0.5 mm² reside within a 10 mm radius, as void clustering concentrates mechanical stresses and degrades localized heat transfer.
Helium mass spectrometry pass-fail boundaries fix allowable leak rates based on cooling loop volume and operational battery lifespan. Typical contract terms set fine leak limits at 1.0 × 10⁻⁶ mbar·L/s under 100% helium charge at 2.0 bar test pressure. Components exhibiting leak rates between 1.0 × 10⁻⁶ and 1.0 × 10⁻⁴ mbar·L/s enter quarantine for sniffer evaluation and potential perimeter rework, while components exceeding 1.0 × 10⁻⁴ mbar·L/s undergo immediate scrapping.
Rework limits restrict perimeter braze repair passes to a single re-bake cycle inside vacuum furnaces, preventing core grain growth and excessive clad depletion.
Quality agreements must clearly assign non-recurring engineering (NRE) costs and scrap liability allocations associated with inline inspection dropouts. Yield loss responsibilities shift based on verified defect root causes. Defects originating from core sheet metal laminations or clad thickness variations fall to raw material suppliers, while braze voiding, channel distortion, and fluxless furnace atmosphere failures belong to the plate manufacturing facility.
Incoming Inspection Protocols and Supply Chain Alignment
Receiving inspection at module assembly plants validates factory certificate of analysis (CoA) documentation against incoming lot samples. Receiving protocols execute secondary helium leak testing and surface flatness verification on an Acceptable Quality Limit (AQL) sample size of 0.65 Level II normal inspection. The buyer retains rights to return entire production lots if incoming sample testing identifies defective plates exceeding agreed LTPD thresholds, forcing supplier containment and root-cause corrective action responses within 14 business days.
Defect tracking frameworks rely on trace codes laser-etched onto every aluminum plate flange prior to vacuum brazing. Codes record core sheet heat numbers, clad coil lot identities, furnace chamber ID, vacuum run position, and inline test data. Traceability connects field performance failures back to specific production parameters, accelerating containment when field micro-leaks or thermal degradation indicate systematic lot defects.
Warranty seam boundaries delineate liability between cooling plate manufacturers, pack integrators, and cell vendors. Plate manufacturers warrant fluid containment and internal structural joint strength up to specified pressure and thermal limits. Pack integrators assume liability for external manifold connection torque, coolant fluid chemistry maintenance, and external mechanical damage during pack assembly operations.
Clear technical boundaries prevent cross-liability disputes when field cooling leaks occur.
Quality agreements require suppliers to archive raw ultrasonic C-scan matrix files and automated leak test pressure logs for a minimum of ten years. Retaining digital inspection records allows failure analysis teams to re-evaluate baseline joint quality if field units display late-life thermal degradation or fatigue cracking.
Purchasing specifications mandate that incoming lot rejection triggers immediate supplier containment procedures, locking all sister batches produced under identical furnace vacuum cycles until microstructural sectioning confirms joint integrity.
Neglecting to define localized void cluster density limits alongside total bond percentages in quality agreements allows structurally compromised plates with clustered micro-voids to pass inspection, leading to field fatigue failures under cyclic hydraulic loads.