In Line Phased Array Inspection of Encapsulated Battery Structural Adhesives
Inline phased array testing maps structural adhesive wet-out and void formation through metal pack enclosures in real time at production line speeds.

Velocity
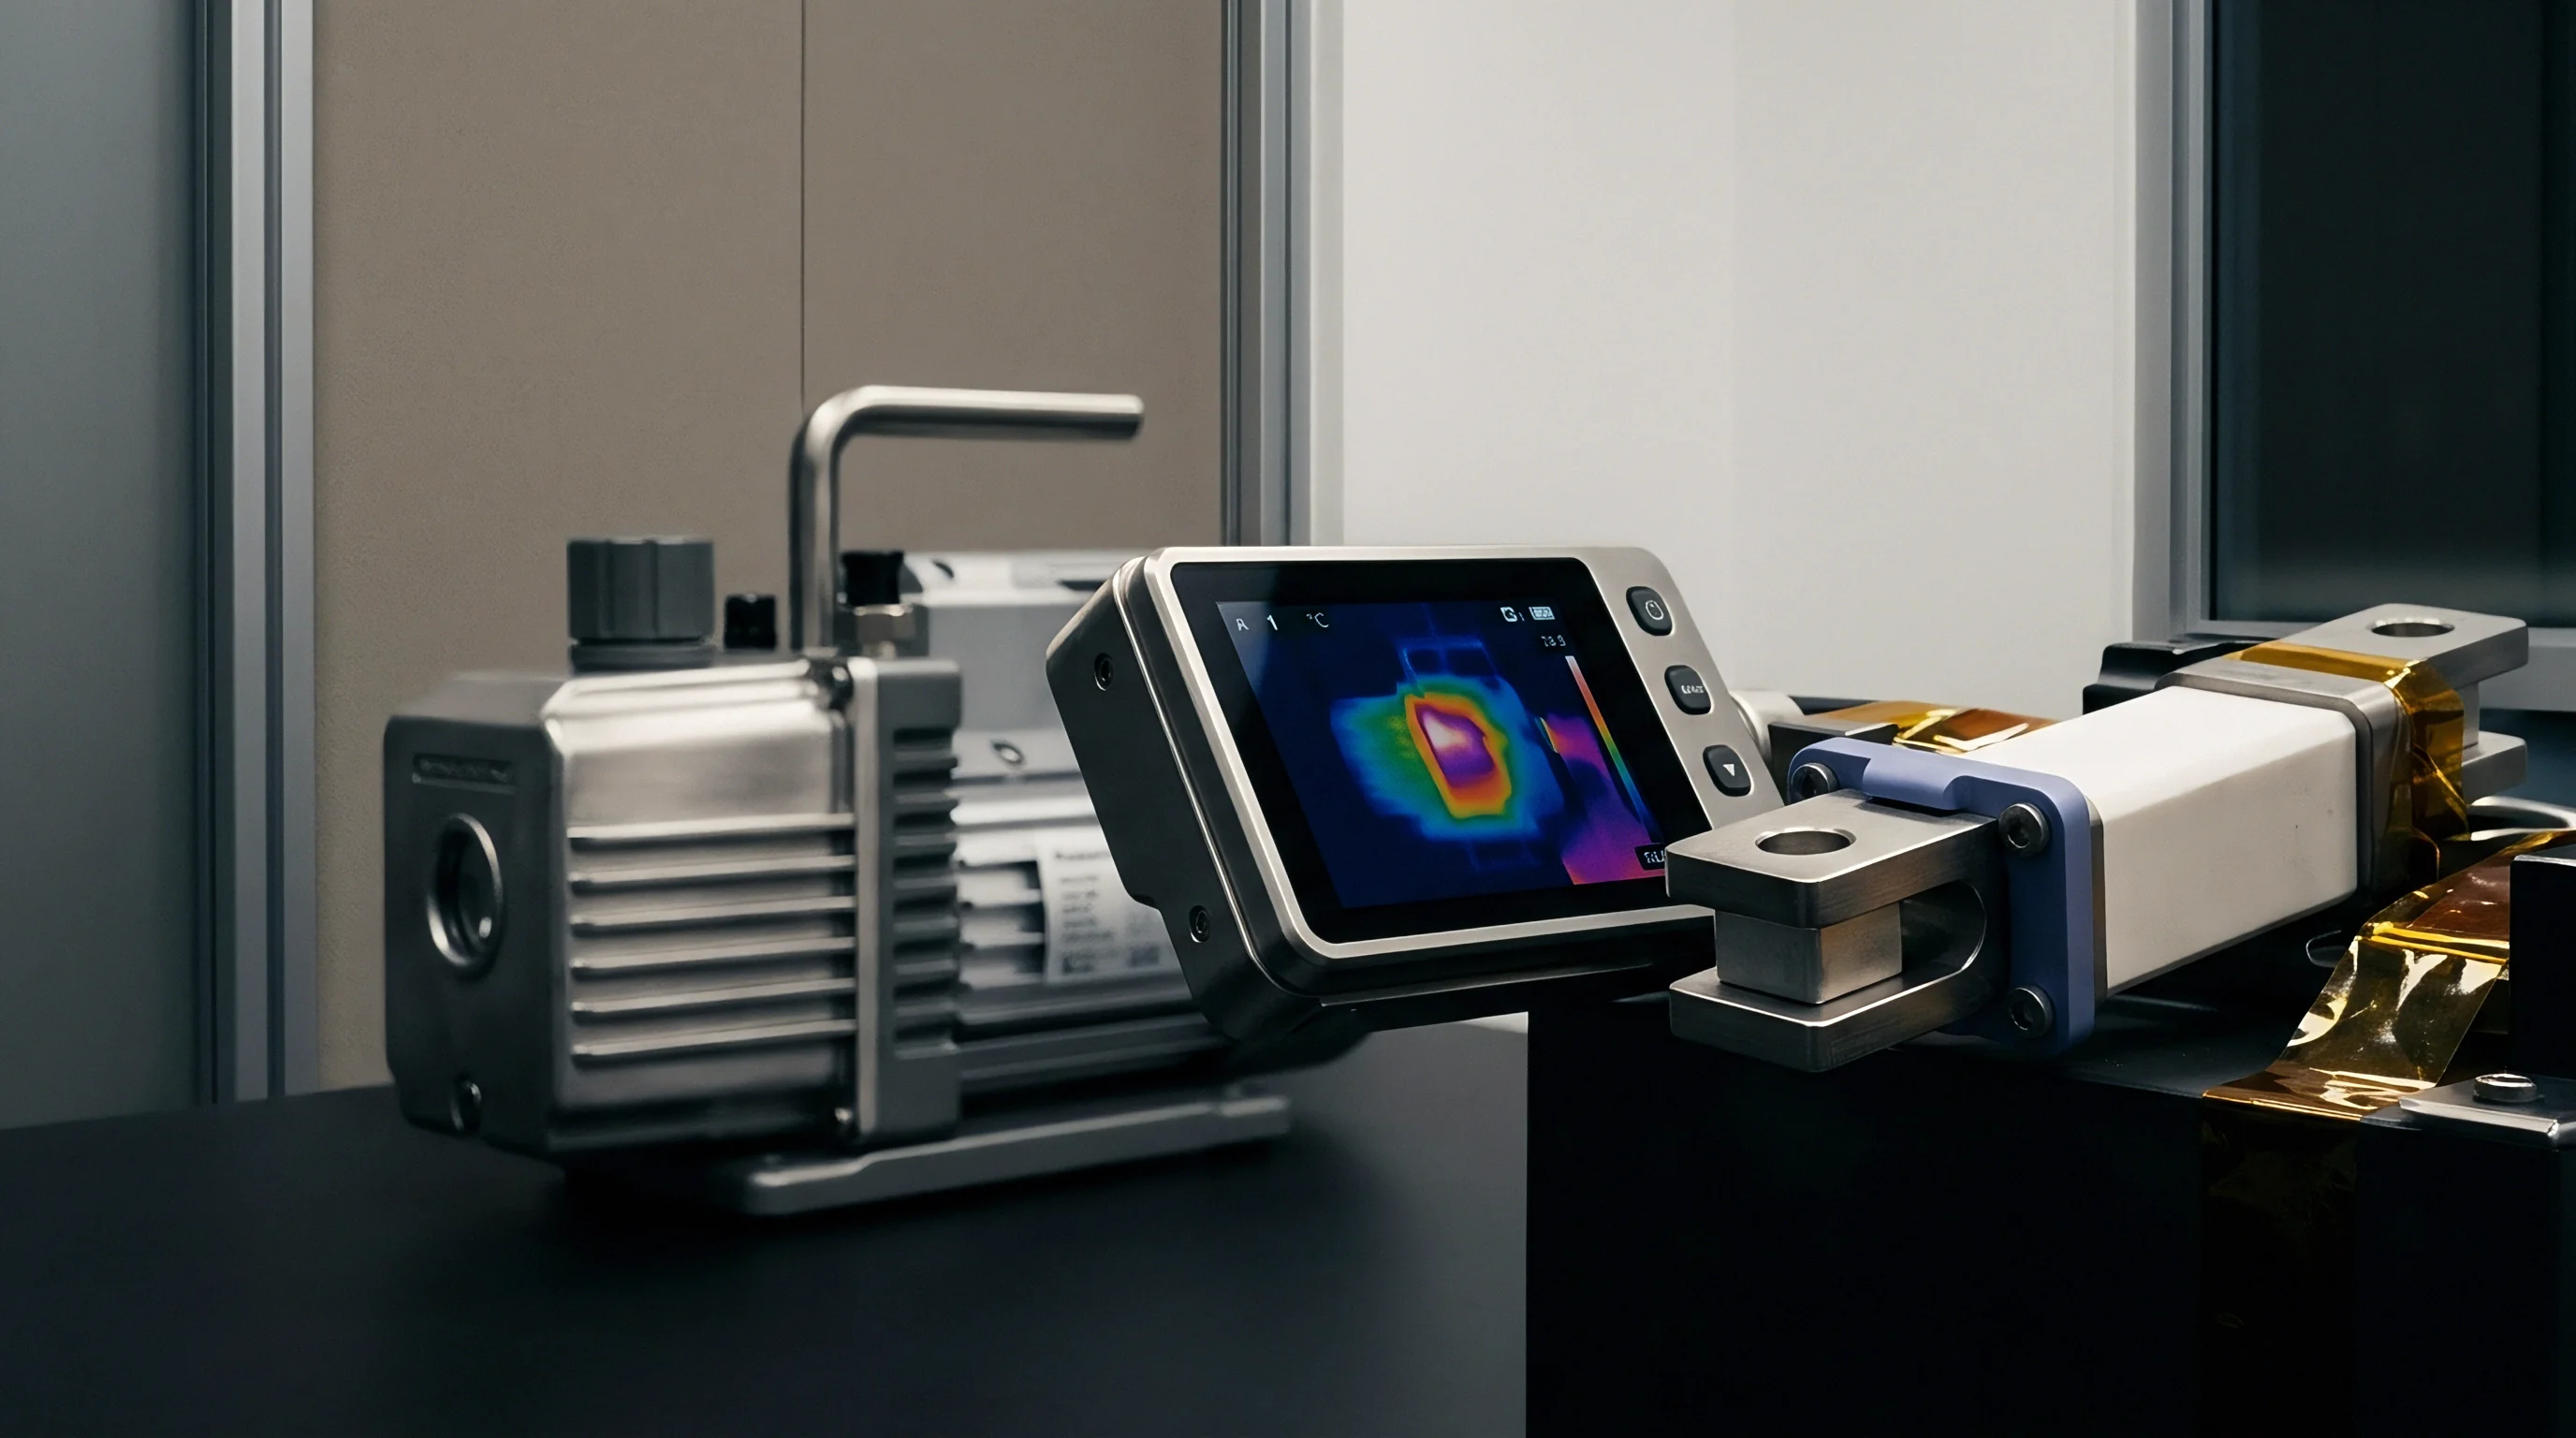
Acoustic propagation through structural polymers shifts dynamically during exothermic curing. In cell-to-pack and cell-to-module designs, polyurethane, epoxy, and silicone structural adhesives transfer mechanical loads between cell casings and the tray substrate while conducting heat toward cooling channels. Measuring wave speed and signal decay across these polymer layers reveals their structural integrity without physically disturbing the bond line.
When a high-frequency acoustic pulse traverses aluminum or steel enclosures into an encapsulated adhesive layer, wave speed reflects the degree of cross-linking, density, and elasticity within the resin matrix.
Longitudinal wave speeds in two-part polyurethanes range from 1420 meters per second in an uncured, liquid state to 2280 meters per second once fully cross-linked at room temperature. Thermally conductive fillers such as alumina trihydrate or boron nitride elevate overall bulk density while introducing acoustic scattering sites. As acoustic frequency rises above 5 MHz, signal attenuation inside filled epoxies increases sharply, scaling with the square of the frequency due to particle boundary scattering.
The acoustic impedance difference between a 6063-T6 aluminum enclosure wall and a dense epoxy layer dictates the sound energy transmitted across the physical interface.
Adhesive density variations exceeding five percent alter the ultrasonic reflection amplitude at the metal-polymer boundary by more than two decibels.
Acoustic impedance matches the product of material mass density and longitudinal wave speed. Aluminum exhibits an acoustic impedance of roughly 17.1 Megarayls, whereas cured epoxy typically measures between 2.8 and 3.5 Megarayls. Steel structures present an even steeper acoustic boundary at approximately 45.6 Megarayls.
These severe impedance mismatches cause a substantial fraction of the sound energy to reflect back to the transducer array at the outer enclosure wall, leaving a limited fraction of acoustic power to enter the bond line. Signal processing algorithms account for these interface reflections when evaluating the underlying polymer structure.
| Material Class | Density (kg/m3) | Longitudinal Speed (m/s) | Acoustic Impedance (MRayl) | Attenuation at 5 MHz (dB/mm) |
|---|---|---|---|---|
| 6063-T6 Aluminum Tray Substrate | 2700 | 6320 | 17.06 | 0.08 |
| 1008 Carbon Steel Enclosure | 7850 | 5890 | 46.24 | 0.18 |
| Uncured Two-Part Polyurethane Adhesive | 1150 | 1420 | 1.63 | 2.40 |
| Fully Cured Structural Epoxy (Filled) | 1600 | 2350 | 3.76 | 1.15 |
| Thermally Conductive Silicone Gel | 2100 | 1050 | 2.21 | 3.80 |
Polymerization alters the elastic moduli of the bond material over time. Early in the curing reaction, shear wave propagation remains virtually zero because liquid resin cannot sustain shear stress. As the gel point passes and polymer chains cross-link into a solid lattice, both shear wave speed and longitudinal wave speed ascend toward stable final plateaus.
Monitoring speed shifts across timed intervals tracks the cure state in real time, allowing quality systems to confirm adhesive strength development before a pack progresses to secondary mechanical assembly.
Whether inline acoustic velocity tracking can distinguish between a fully cured low-density adhesive matrix and an under-cured polymer containing elevated filler content remains unresolved across production lines.
Array
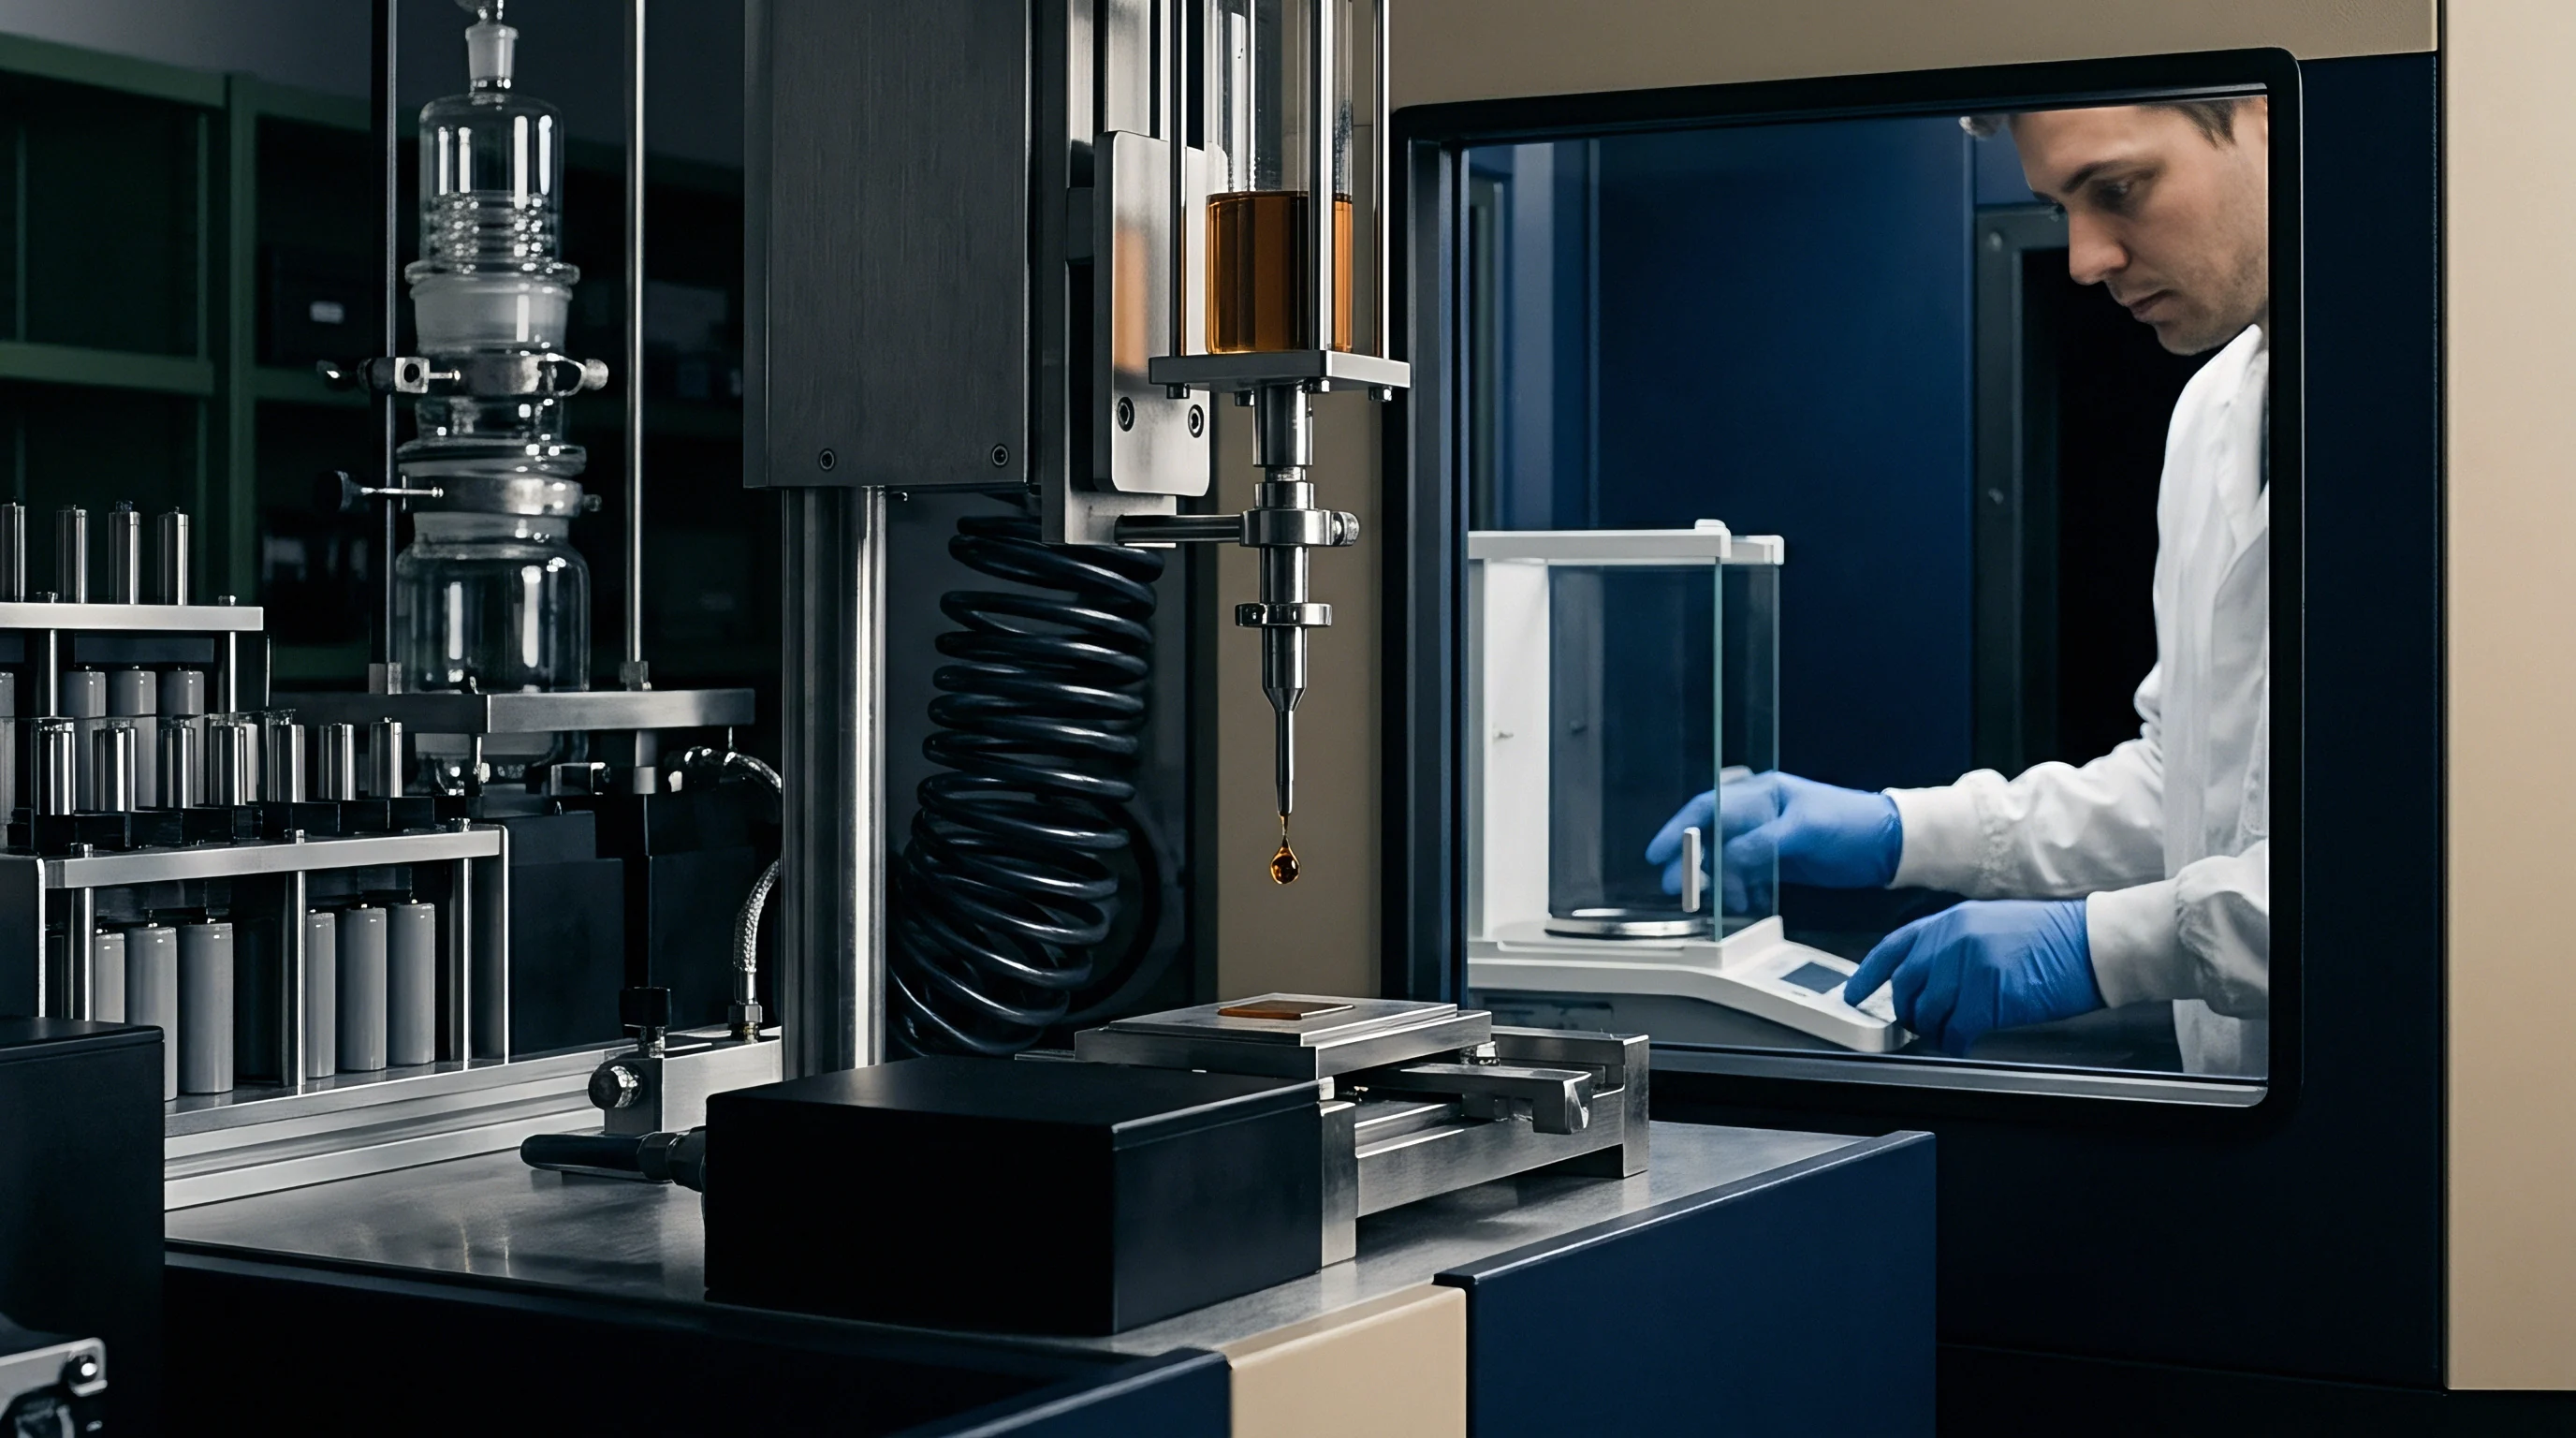
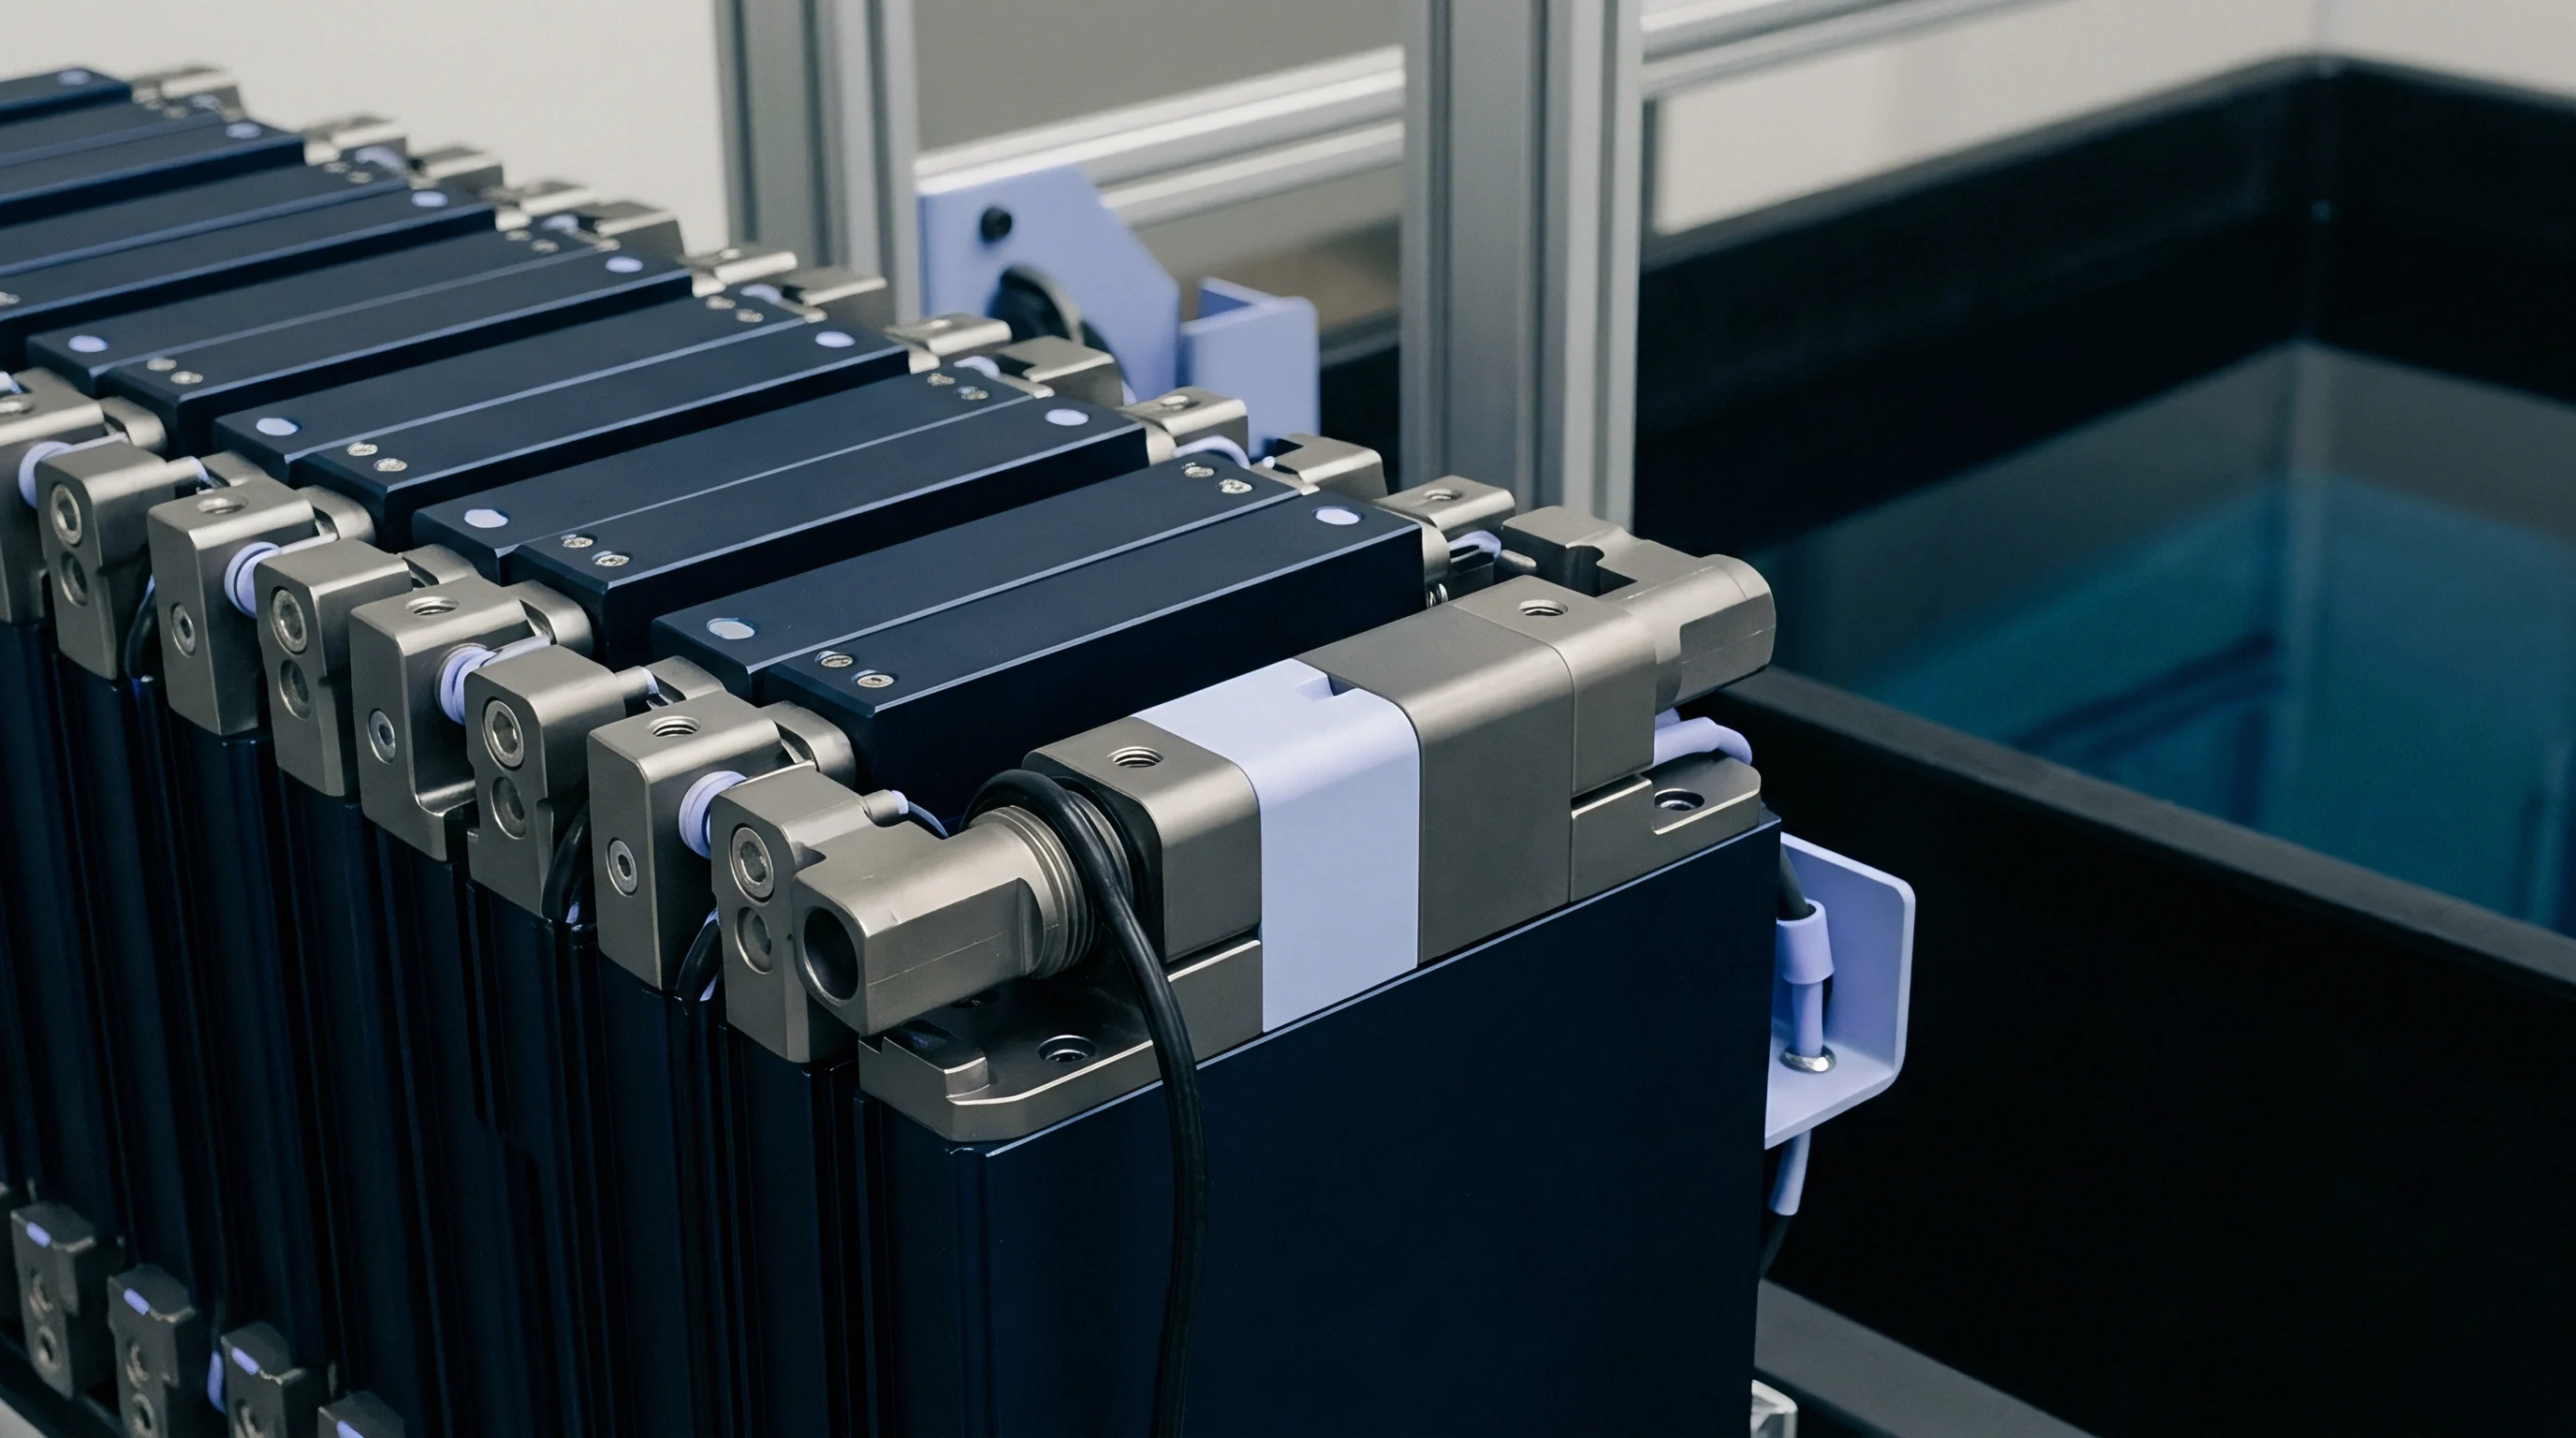
Ultrasonic probe selection directly controls spatial resolution and acoustic penetration depth during high-speed inline scans. Phased array transducers utilize multiple piezoelectric elements arranged in linear, matrix, or annular patterns. Electronically delaying the activation pulse across individual elements steers and focuses the sound beam through complex multi-layer pack geometries without moving the physical probe body.
Linear array transducers designed for cell-to-pack inspection typically feature between 32 and 128 elements operating at center frequencies from 2.25 MHz to 10 MHz.

Element Pitch and Beam Steering Characteristics
Element spacing governs grating lobe emergence and angular steering limits. Element pitch set below half the acoustic wavelength in the delay line medium suppresses secondary grating lobes that introduce spatial imaging artifacts. Array pitch values between 0.5 mm and 1.0 mm balance beam steering range against manufacturing complexity.
Higher element counts increase focal precision at the structural adhesive layer but demand expanded multi-channel hardware processing capacity. Flexible phased array membranes conform to minor surface contours on stamped battery trays, maintaining uniform acoustic contact without high clamping pressure.

Delay Lines and Coupling Mechanics
Acoustic delays prevent near-field surface ring-down noise from masking shallow bond-line flaws. High-density cross-linked elastomeric delay lines match the acoustic impedance of structural polymers, reducing interface reflections at the probe face. Water-squirter shoes or localized fluid immersion columns deliver reliable coupling on fast-moving production gantries without liquid cleanup, replacing full water submersion tanks that damage electrical contacts and open pouch cell tabs.
- Aperture Width Selection must balance lateral spatial resolution against physical clearance near structural tray ribs and cell cooling fins.
- Element Cross-Talk Isolation reduces acoustic cross-coupling between adjacent piezocomposite strips to maintain a clean acoustic signal.
- Delay Line Matching minimizes internal sound reflections within the probe assembly to preserve weak back-wall echoes from deep adhesive layers.
- Membrane Wear Resistance dictates tool life during continuous contact scanning against unpainted aluminum enclosure surfaces.
Impedance mismatches create distinct echoes, and aligning element pitch with substrate thickness prevents beam divergence inside thin-walled enclosure bases.
Probes mounted on flexible elastomeric tracks follow tray tolerances without mechanical recalibration.

Coupling
Structural adhesive joints within battery assemblies face process defects during high-speed dispensing and cell placement. Encapsulated adhesive layers sit hidden beneath thick prismatic cell rows or pouch module stacks, masking physical gaps from optical vision systems. Wet-on-wet dispensing over cooling plates frequently traps micro-voids during automated module insertion.
Skinning occurs when open times are exceeded prior to cell mating, creating a dry skin that prevents full chemical bonding despite mechanical pressure.
Standard ISO 10364 specifies test methods for adhesive pot life, but inline acoustic amplitude mapping captures real-time skinning failures before cure completion.
Acoustic shadowing occurs when internal battery structures block sound paths to the adhesive joint. Cell internal structures, such as layered jelly rolls, copper current collectors, and liquid electrolyte channels, attenuate sound waves passing through the battery body. Inspecting adhesive bond lines through the outer metallic tray casing avoids passing acoustic beams through the active cell chemistry entirely.
This inverted scanning geometry isolates the substrate-to-adhesive interface from internal battery variables.
Incomplete wet-out leaves air pockets at the tray interface, while unmixed resin pockets alter local velocity profiles and phase shifts reveal kiss bonds. Adhesive voids reduce structural stiffness, and thermal gap fillers subject to moisture absorption develop micro-porosity during thermal curing cycles. These structural flaws attenuate sound energy or alter signal arrival times, yielding precise defect signatures during ultrasonic evaluation.
| Defect Mechanism | Reflected Amplitude Shift | Phase Behavior | Time-of-Flight Shift |
|---|---|---|---|
| Air Entrapment / Voiding | Increases by 12 dB to 18 dB | 180 Degree Inversion | Shortened Arrival Time |
| Adhesive Skinning (Kiss Bond) | Minimal Shift (0 dB to 2 dB) | No Phase Change | Unchanged Arrival Time |
| Incomplete Wet-Out Zone | Increases by 8 dB to 14 dB | 180 Degree Inversion | Interface Echo Delay |
| Unmixed Hardener Pocket | Decreases by 3 dB to 6 dB | Complex Phase Shift | Delayed Arrival Time |
| Thickness Variation (+0.5mm) | Negligible Change | No Phase Change | Extended Arrival Time |
Failure modes in structural adhesive joints lower both mechanical shear capacity and pack thermal conductivity:
- Boundary Delamination separates the cured adhesive matrix from the metallic substrate, creating total reflection of acoustic energy at the unbonded interface.
- Volumetric Porosity scatters sound waves in multiple directions, creating a distinct signal drop-off in the back-wall echo amplitude map.
- Adhesive Thickness Drift alters thermal dissipation rates across cell rows, creating localized hotspots during fast-charging operations.
- Uncured Resin Pockets reduce structural stiffness, leading to mechanical bond degradation under vehicle vibration profiles.
Ignoring interface wet-out defects during pack assembly leads to premature thermal throttling under high current discharge and structural seam splitting under chassis torsion loads.
Scattering
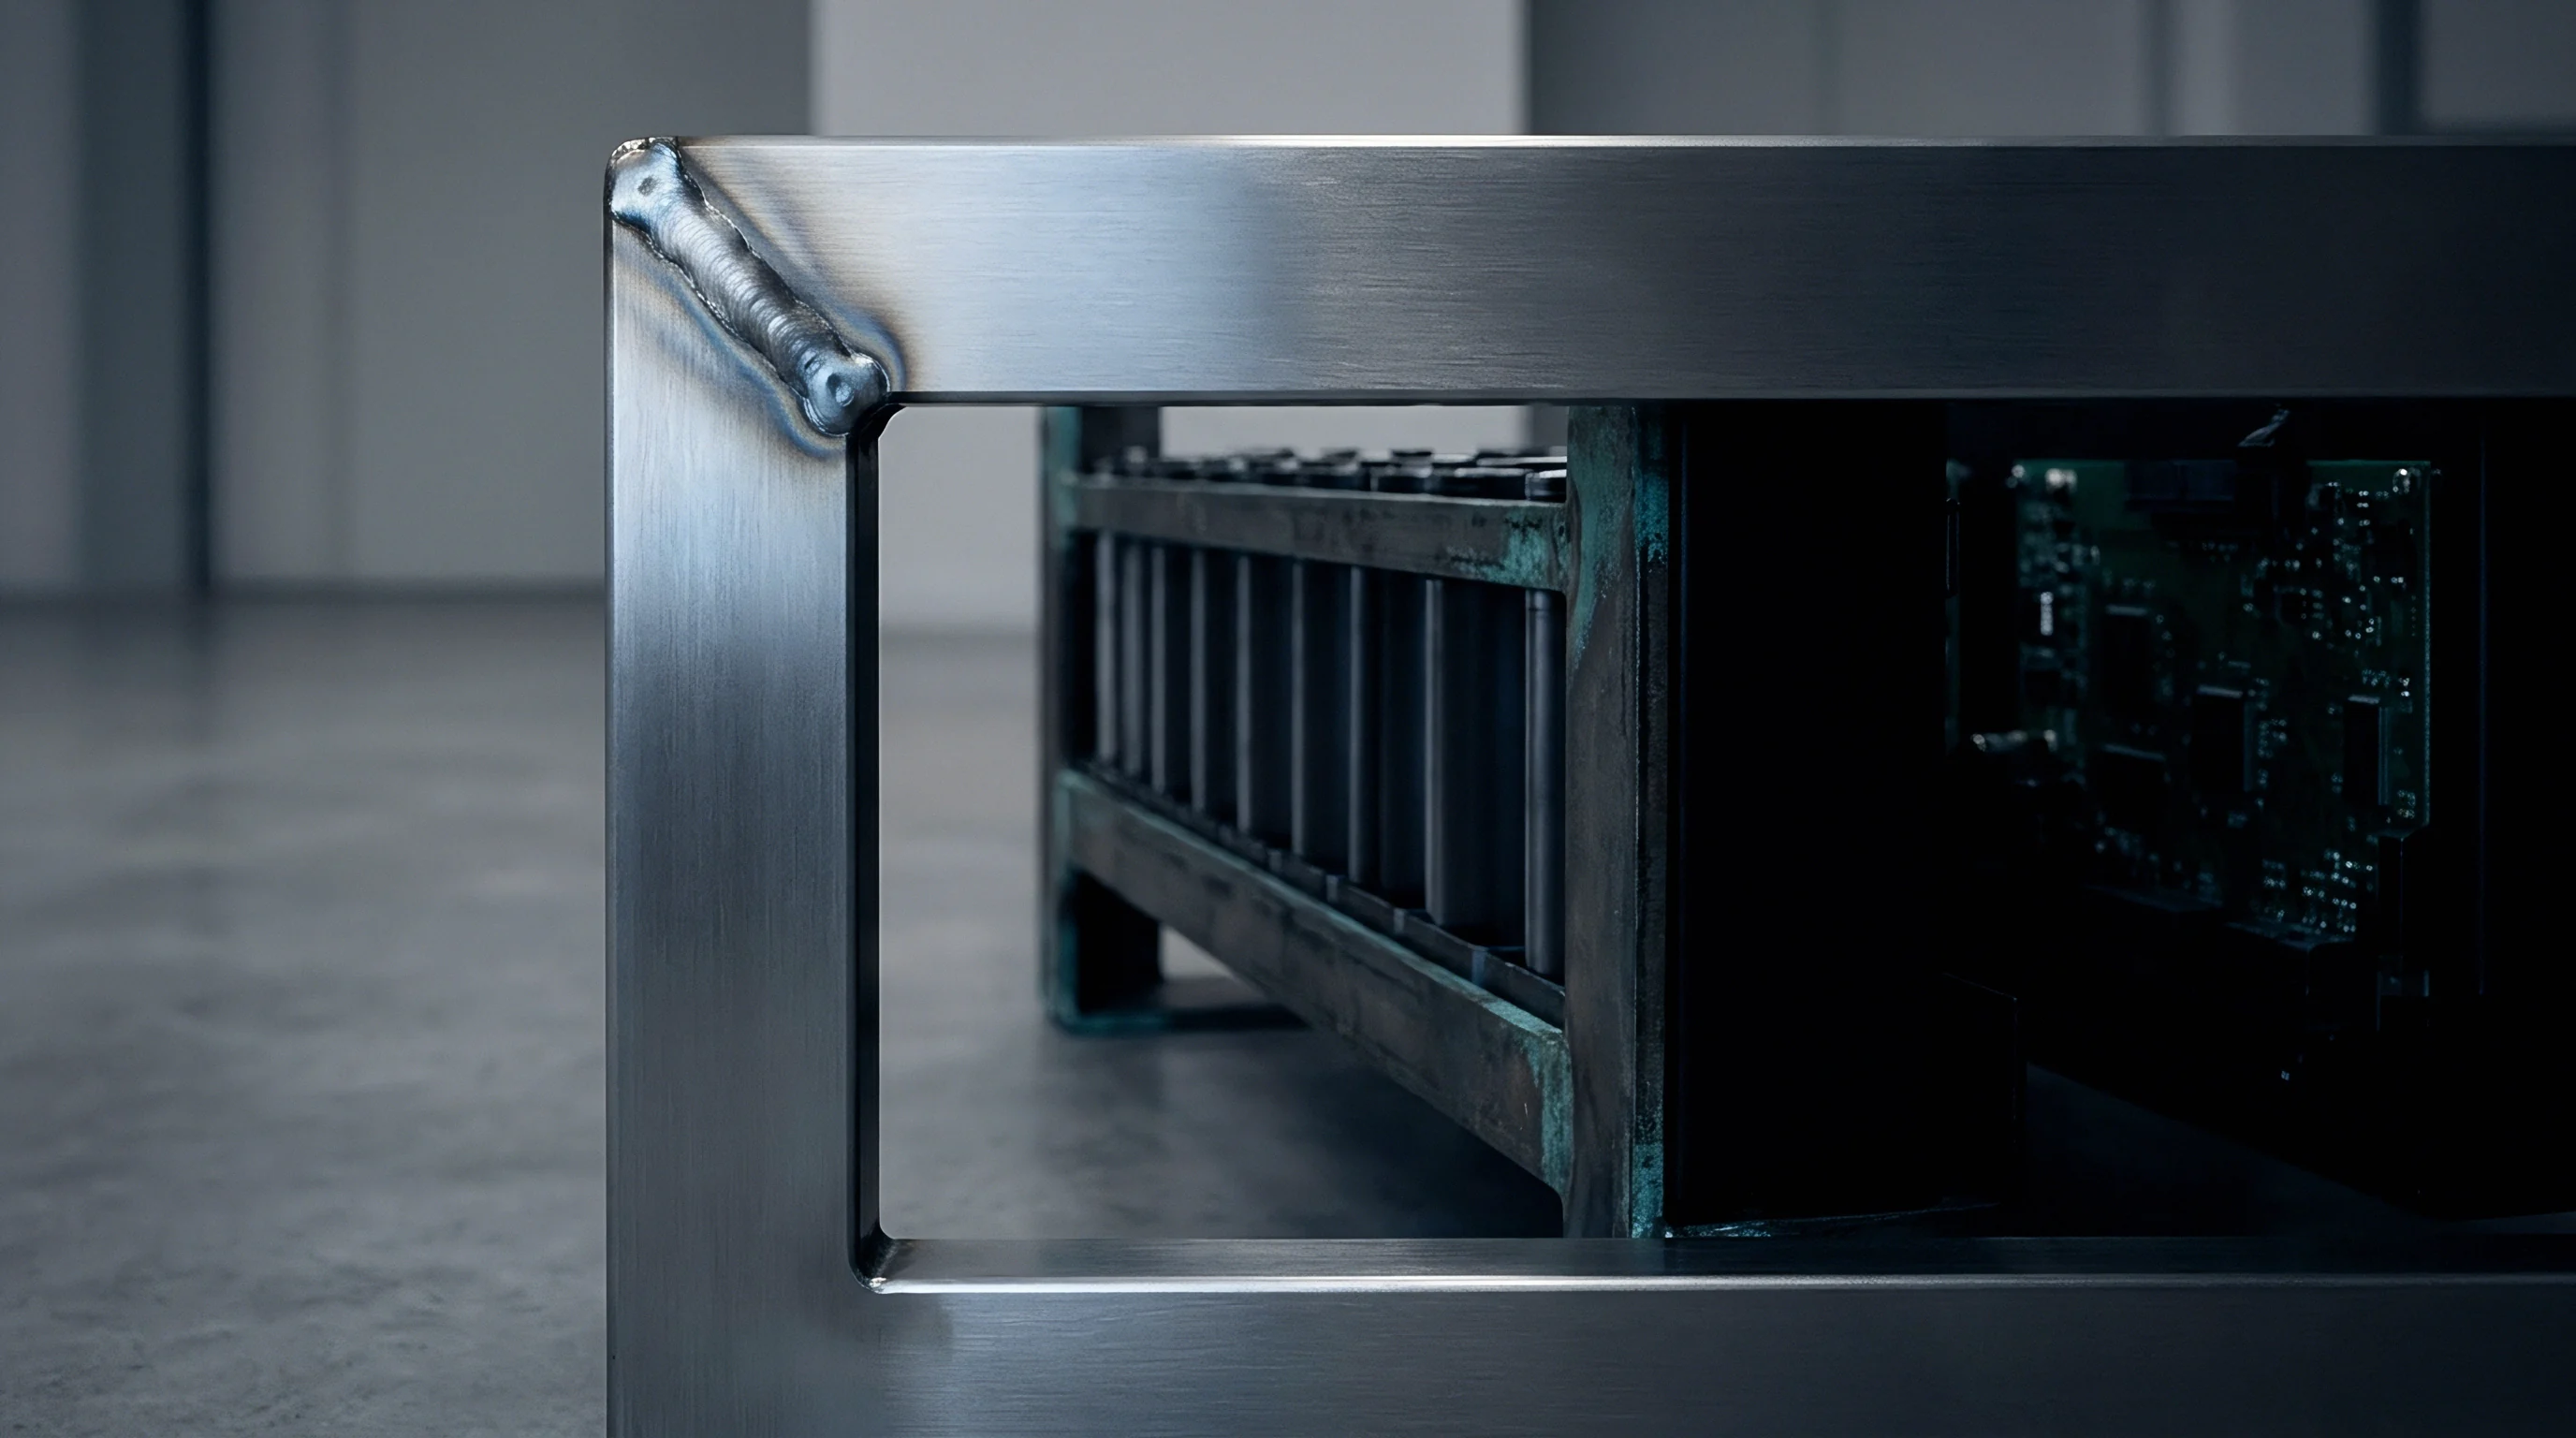
Defect identification relies on analyzing signal reflection amplitude, phase state, and flight time across targeted inspection gates. Sound waves encountering an interface between materials with differing acoustic impedances divide into reflected and transmitted components. The reflection coefficient determines the fraction of acoustic pressure returning to the array elements.
When a sound pulse hits an adhesive-to-void interface, the reflection coefficient approaches negative one, causing total reflection with a phase inversion.
Quantifying reflection characteristics requires evaluating the acoustic impedance contrast. Calculating the reflection coefficient follows a basic pressure ratio formula:
R = (Z2 – Z1) / (Z2 + Z1)
Assuming aluminum substrate impedance Z1 equals 17.06 MRayl and cured epoxy adhesive impedance Z2 equals 3.76 MRayl, the reflection coefficient at a sound, bonded interface equals -0.638. This yields a theoretical reflection amplitude ratio of roughly 64 percent of the incident pulse. If an air void forms at the interface, Z2 drops to 0.0004 MRayl, yielding a reflection coefficient of -0.999.
This absolute reflection returns maximum amplitude back to the probe while inverting the waveform phase. Signal processing units leverage this amplitude jump to mark unbonded locations.
The following calibration procedure establishes signal evaluation gates for automated inline scanning software:
- Position the array transducer over a flat, defect-free reference standard matching the exact tray thickness and material grade.
- Adjust systemic receiver gain to place the first substrate-adhesive boundary reflection at 80 percent full screen height.
- Position Time-of-Flight Gate A across the substrate-adhesive reflection peak to track bond line position variations.
- Position Amplitude Gate B past the substrate reflection to capture back-wall signals returning from the adhesive-cell interface.
- Set the defect decision threshold 6 decibels above the sound back-wall amplitude to trigger automated flaw flags.
Phase inversion combined with a six-decibel amplitude jump defines a total unbond condition at metallic substrate interfaces.
B-scan cross-sectional images visualize adhesive bead profile geometry along the scan axis. Amplitude-gated C-scan maps provide top-down views of total wet-out area, highlighting void locations, bead gaps, and edge recession. Flaw detection algorithms analyze these spatial maps to calculate total bond coverage percentages for every cell module bay.
Minor bond-line porosity can be compressed by mechanical clamping forces during module drop-in into micro-voids below acoustic detection limits.


Cadence
Automated high-speed production lines dictate fast inspection cycles. High-volume electric vehicle battery lines operate at overall cycle times between 30 and 60 seconds per pack. Sweeping a single-element ultrasonic probe manually over a multi-meter battery tray violates these production line speeds.
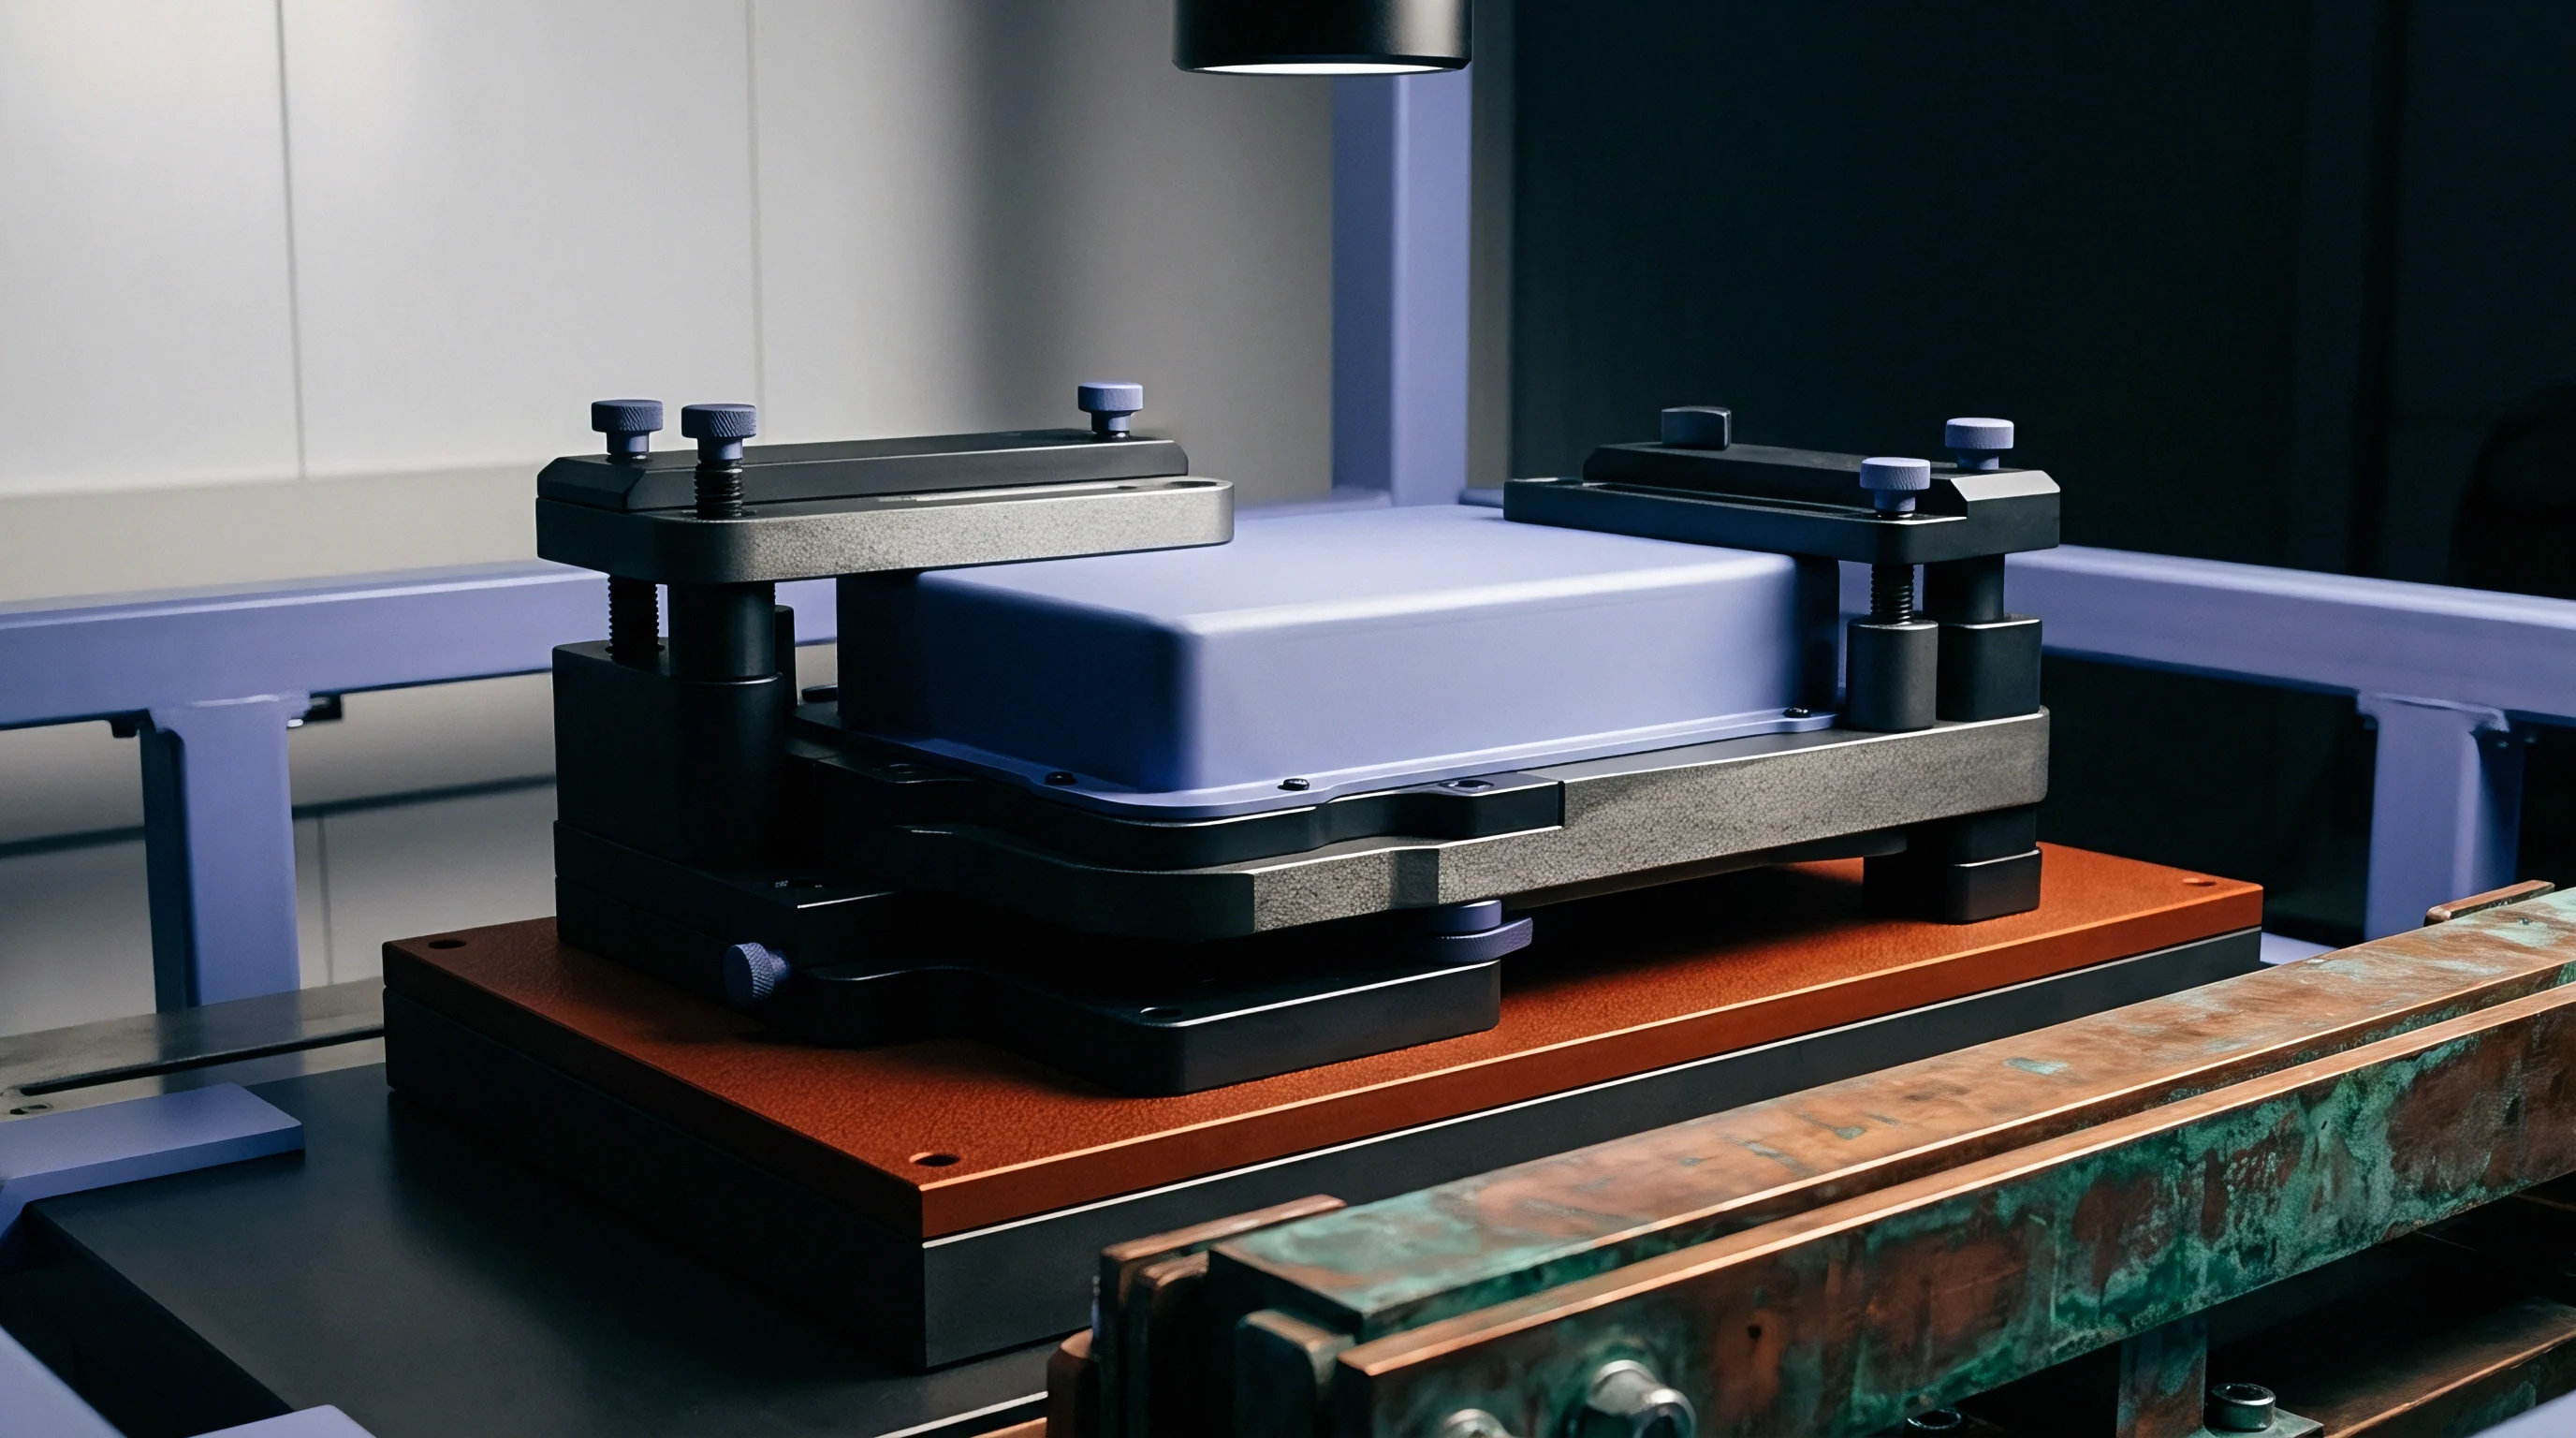
Inline phased array systems solve cycle time limits by combining multi-element linear probes with multi-axis gantry robots or industrial robotic arms.
Parallel Data Acquisition Architecture
Hardware architectures use parallel channel electronics to fire multiple element groups simultaneously, mitigating positional drift from gantry acceleration. Full Matrix Capture (FMC) combined with the Total Focusing Method (TFM) generates focused spatial images at every pixel location in the target zone. Real-time TFM algorithms running on dedicated graphics processing units process gigabytes of raw acoustic data per second, generating dense cross-sectional images without slowing the mechanical robot head.

Is Automated Phased Array Feasible at Sub-Minute Takt?
Inline feasibility depends directly on array width, robot motion speed, and parallel firing configurations. Multi-probe array heads spanning 300 mm in a single pass evaluate an entire module bay in under three seconds. Robot travel speeds reaching 250 mm per second deliver complete pack tray scans within 20 seconds, leaving adequate time for automated part loading and couplant clearing.
High-speed encoder triggering synchronizes acoustic pulse firing with precise spatial coordinates, eliminating image distortion caused by robot speed fluctuations.
| Gantry System Configuration | Active Array Span (mm) | Maximum Scan Speed (mm/s) | Data Processing Rate (MB/s) | Total Pack Tray Scan Time (s) |
|---|---|---|---|---|
| Single 64-Element Linear Probe | 50 | 100 | 120 | 145 |
| Dual 128-Element Matrix Array | 150 | 200 | 480 | 42 |
| Quad 128-Element Multi-Axis Bar | 300 | 250 | 960 | 18 |
| Custom Conformal Array Gantry | 600 | 150 | 1920 | 12 |
Automated Defect Recognition (ADR) software processes C-scan matrices instantly upon scan pass completion. ADR algorithms apply spatial image thresholding to isolate void clusters, calculate total unbond surface area, and compare defect dimensions against engineering limits. Quality management systems reject non-conforming packs automatically before they enter module drop-in cells.
Quality documentation for inline scanning software must specify the following items in the NPI data package:
- Raw Data Retention Standards defining full A-scan capture requirements for audited safety-critical joints.
- Algorithm Calibration Protocols establishing daily gain adjustment steps using certified flat-bottom hole calibration blocks.
- Spatial Resolution Bounds identifying the smallest detectable void size at maximum production line travel speed.
- False Reject Limits establishing statistical thresholds to prevent good battery trays from being routed to offline rework stations.
Standard EN 12668-1 governs ultrasonic instrument performance, requiring linear receiver response across the complete inline dynamic range.
Contractual delivery agreements incorporating standard ISO 22825 mandate that inline automated ultrasonic software retain uncompressed A-scan signal records for every structural bond line across ten years of pack production data.
Warranty
Defect acceptance limits define commercial liability boundaries between cell manufacturers, adhesive formulators, and pack integrators. Structural adhesives must maintain mechanical bond strength and thermal conductance across vehicle operating lifespans. Engineering drawings specify quantitative pass/fail criteria, such as minimum 85 percent total wet-out area across thermal transfer surfaces and a maximum single void dimension of 10 mm.
When an inline phased array system detects a non-conforming bond line, repair protocols dictate whether the tray undergoes manual adhesive scraping or complete part scrapping.
Amortizing non-recurring engineering costs for custom phased array gantries requires establishing clear quality boundaries early in the NPI process. Equipment installation contracts assign maintenance liability for sensor head wear, water couplant filtration, and calibration drift. Establishing clear responsibility seams prevents disputes over whether bond line failures originate from improper adhesive dispensing, incorrect robotic press timing, or faulty raw materials.
Engineering specifications translate ultrasonic amplitude thresholds into physical shear strength and thermal resistance guarantees. Integrating automated phased array inspection directly into high-volume assembly lines replaces destructive coupon testing with full production coverage, protecting warranty reserves through verified process control.