Audit Procedures for Detecting Laboratory Data Smoothing and Sensor Decoupling
Detect laboratory data smoothing and sensor decoupling by auditing raw ADC noise floors, checking residual autocorrelation, and parsing native cycler binary files.


Signal
Testing high-energy density battery cells generates continuous streams of high-frequency electrical and thermal data. Modern automated battery cyclers measure cell terminal voltage, charge current, surface temperature, and ambient environmental conditions at sampling rates ranging from ten hertz down to millihertz levels. Every electrochemical system exhibits intrinsic high-frequency noise originating from analog-to-digital converter quantization limits, pulse-width modulation ripple from power stages, and micro-scale concentration polarization variations within the electrode stack.
When test records present mathematically clean exponential curves or smooth polynomial fits lacking this physical noise floor, the laboratory has modified the output.
Data smoothing in cell qualification files usually serves to hide early indicators of electrochemical instability. Micro-thermal events, localized internal shorting through dendritic lithium initiation, structural phase transitions in high-nickel cathodes, and transient gas evolution manifest first as tiny voltage fluctuations or micro-kelvin thermal spikes. Laboratories under pressure to present clean cycle-life curves apply numerical filtering to suppress these transient anomalies.
Applying low-pass Butterworth filters, Savitzky-Golay windowing, or moving boxcar averages transforms erratic voltage oscillations into uniform degradation profiles. This manipulation misleads engineering teams into qualifying cells carrying severe thermal runaway risks during fast-charging or low-temperature operational windows.

Raw Noise Baselines in Galvanostatic Cycling
Auditing cell test logs begins with establishing the hardware-specific electrical noise baseline of the test equipment. Every cycler platform features a characteristic background noise signature determined by its current range shunts, voltage sensing amplifiers, and analog-to-digital converter resolution. A 16-bit analog-to-digital converter operating across a 5-volt range possesses a theoretical minimum quantization step of 76.2 microvolts.
Thermal noise, trace impedance fluctuations, and environmental electromagnetic interference elevate the actual observed noise floor to several hundred microvolts peak-to-peak under constant-current discharge conditions.
Eliminating these intrinsic fluctuations requires active software post-processing. When continuous galvanostatic cycling records exhibit voltage variance smaller than the hardware analog-to-digital converter quantization step over thousands of data points, software smoothing has occurred. Real electrochemical systems under heavy current loads experience active ion transport across electrode interfaces, phase changes within active intercalation materials, and gas micro-bubble dynamics within liquid electrolyte matrices.
These underlying transport phenomena create irregular, non-periodic voltage perturbations. The absence of these micro-perturbations signals that raw measurements passed through digital low-pass algorithms before output file generation.
| Measurement Parameter | Hardware ADC Baseline (16-bit Shunt) | Savitzky-Golay Filter Output | Moving Boxcar Average (20-Point Window) | Physical Detection Indicator |
|---|---|---|---|---|
| Terminal Voltage (V) | ±150 to ±300 µV transient ripple | Zero variance across 50 ms window | Stepwise staircase decay artifacts | Elimination of current-switch inductive spikes |
| Charge Current (A) | ±0.02% full-scale switching noise | Perfect flatline during constant current | Attenuated pulse-charge rise times | Absence of pulse-width modulation switching noise |
| Surface Temperature (°C) | ±0.05 °C thermocouple thermal drift | Monotonic single-slope increase | Symmetrical artificial bell curves | Loss of localized internal micro-shorting spikes |
| Differential Capacity (dQ/dV) | High-frequency differential noise peaks | Ultra-smooth single-peak curves | Truncated phase-transition peaks | Artificial broadening of lithium intercalation peaks |
Mathematical Artifacts of Digital Smoothing Algorithms
Digital filtering algorithms leave deterministic mathematical footprints within time-series datasets. The Savitzky-Golay filter fits successive sub-sets of adjacent data points with a low-degree polynomial by the method of linear least squares. While effective at preserving higher moments of spectral peaks, it alters the underlying residual variance distribution.
Unfiltered measurement noise follows a Gaussian or slightly skewed normal distribution centered on the true mean value. Running a windowed polynomial filter forces adjacent residuals into strong positive autocorrelation structures.
Data logs passing through a 15-point Savitzky-Golay smoothing filter show a 94 percent reduction in high-frequency spectral power above 2 Hertz under constant-current discharge conditions.
Checking for residual autocorrelation exposes applied digital smoothing. Subtracting a high-order polynomial trendline from raw data isolates the high-frequency residual component. Calculating the Durbin-Watson statistic or evaluating the autocorrelation function of these residuals reveals the manipulation.
Unfiltered physical measurement data yields a Durbin-Watson statistic near 2.0, indicating uncorrelated noise. Mathematically smoothed data produces Durbin-Watson values approaching zero, proving strong positive autocorrelation between consecutive data points.
Boxcar filtering and moving averages introduce distinct step-like discretization artifacts when applied to continuous analog variables. A moving average filter calculates the arithmetic mean of a sliding window containing a fixed number of samples. When an abrupt physical change occurs—such as a sudden voltage drop induced by internal micro-shorting—the moving average redistributes the voltage loss equally across all points within the filter window.
This windowing effect turns sharp step-changes into artificially smooth linear ramps. Analyzing the first derivative of terminal voltage with respect to time (dV/dt) isolates these unnatural slope shifts, exposing smoothed transient events that would otherwise trigger safety abort thresholds on production lines.
Gaussian kernel smoothing introduces artificial spatial symmetry into asymmetric physical processes. Thermal dissipation in cylindrical cell packs follows non-linear convective and conductive paths, producing rapid temperature rises followed by exponential cooling tails. Applying symmetric Gaussian filters forces the thermal decay curve into a symmetrical bell shape, distorting the actual cooling time constant of the cell assembly.
Reconstructing true cell heat generation rates from smoothed temperature data leads to severe underestimation of cell peak operating temperatures during fast-discharge qualification cycles.
Over-reliance on visual plot inspections allows smoothed laboratory logs to pass routine qualification reviews. Technical auditors must evaluate raw time-series data using computational scripts that compute residual autocorrelation, power spectral density slopes, and derivative continuity metrics. Identifying missing noise floors before signing off on UN 38.3 or IEC 62133 safety files prevents unsafe cell designs from entering high-volume manufacturing pipelines.
Verification of raw cycler data files relies on measuring physical electrical noise rather than accepting visually clean graphical plots.

Displacement
Sensor decoupling occurs when physical thermal sensors, voltage taps, or current shunts are offset from their designated measurement zones or mathematically decoupled in software. Physical decoupling typically involves positioning thermocouples away from active electrochemical zones, inserting high-thermal-resistance damping materials, or attaching thermal sensors to external casing locations influenced by secondary air cooling. Soft decoupling relies on firmware calibration offsets, artificial scaling factors, or delayed signal routing within software channels to mask transient excursions during stress testing.
Thermal management evaluation during UN 38.3 overcharge and UL 1973 thermal abuse tests depends heavily on true sensor placement. A cell experiencing internal shorting generates rapid localized heat at the internal jelly-roll defect site. If the laboratory attaches the external surface thermocouple to a structural tab corner or introduces a silicone isolation shim under the probe tip, the measured temperature remains nominal while the internal cell core exceeds critical runaway thresholds.
This physical sensor decoupling creates a false record of thermal stability, concealing severe safety hazards.

Physical Decoupling of Thermal Sensors
Detecting physical sensor decoupling requires comparing measured surface thermal responses against fundamental conductive heat transfer models. The thermal time constant of a lithium-ion cell defines the physical latency between internal heat generation and external surface temperature rise. This constant depends directly on the cell mass, specific heat capacity, radial thermal conductivity, and external surface area.
When a cell undergoes high-rate discharge or forced overcharge, external thermal response curves must obey Fourier thermal conduction laws.
Inserting thermal shims or moving sensors away from active zones increases the measured thermal time constant. The observed temperature rise demonstrates a delayed response onset combined with an artificially low peak amplitude. Auditors calculate the theoretical thermal response time of the cell format under test.
A 21700 cylindrical cell with a radial thermal conductivity of approximately 1 watt per meter-kelvin demonstrates a surface thermal latency under two seconds during high-current pulsing. Observed latencies exceeding ten seconds indicate physical decoupling through insulation pads, air gap gaps, or displaced thermocouple mounting locations.
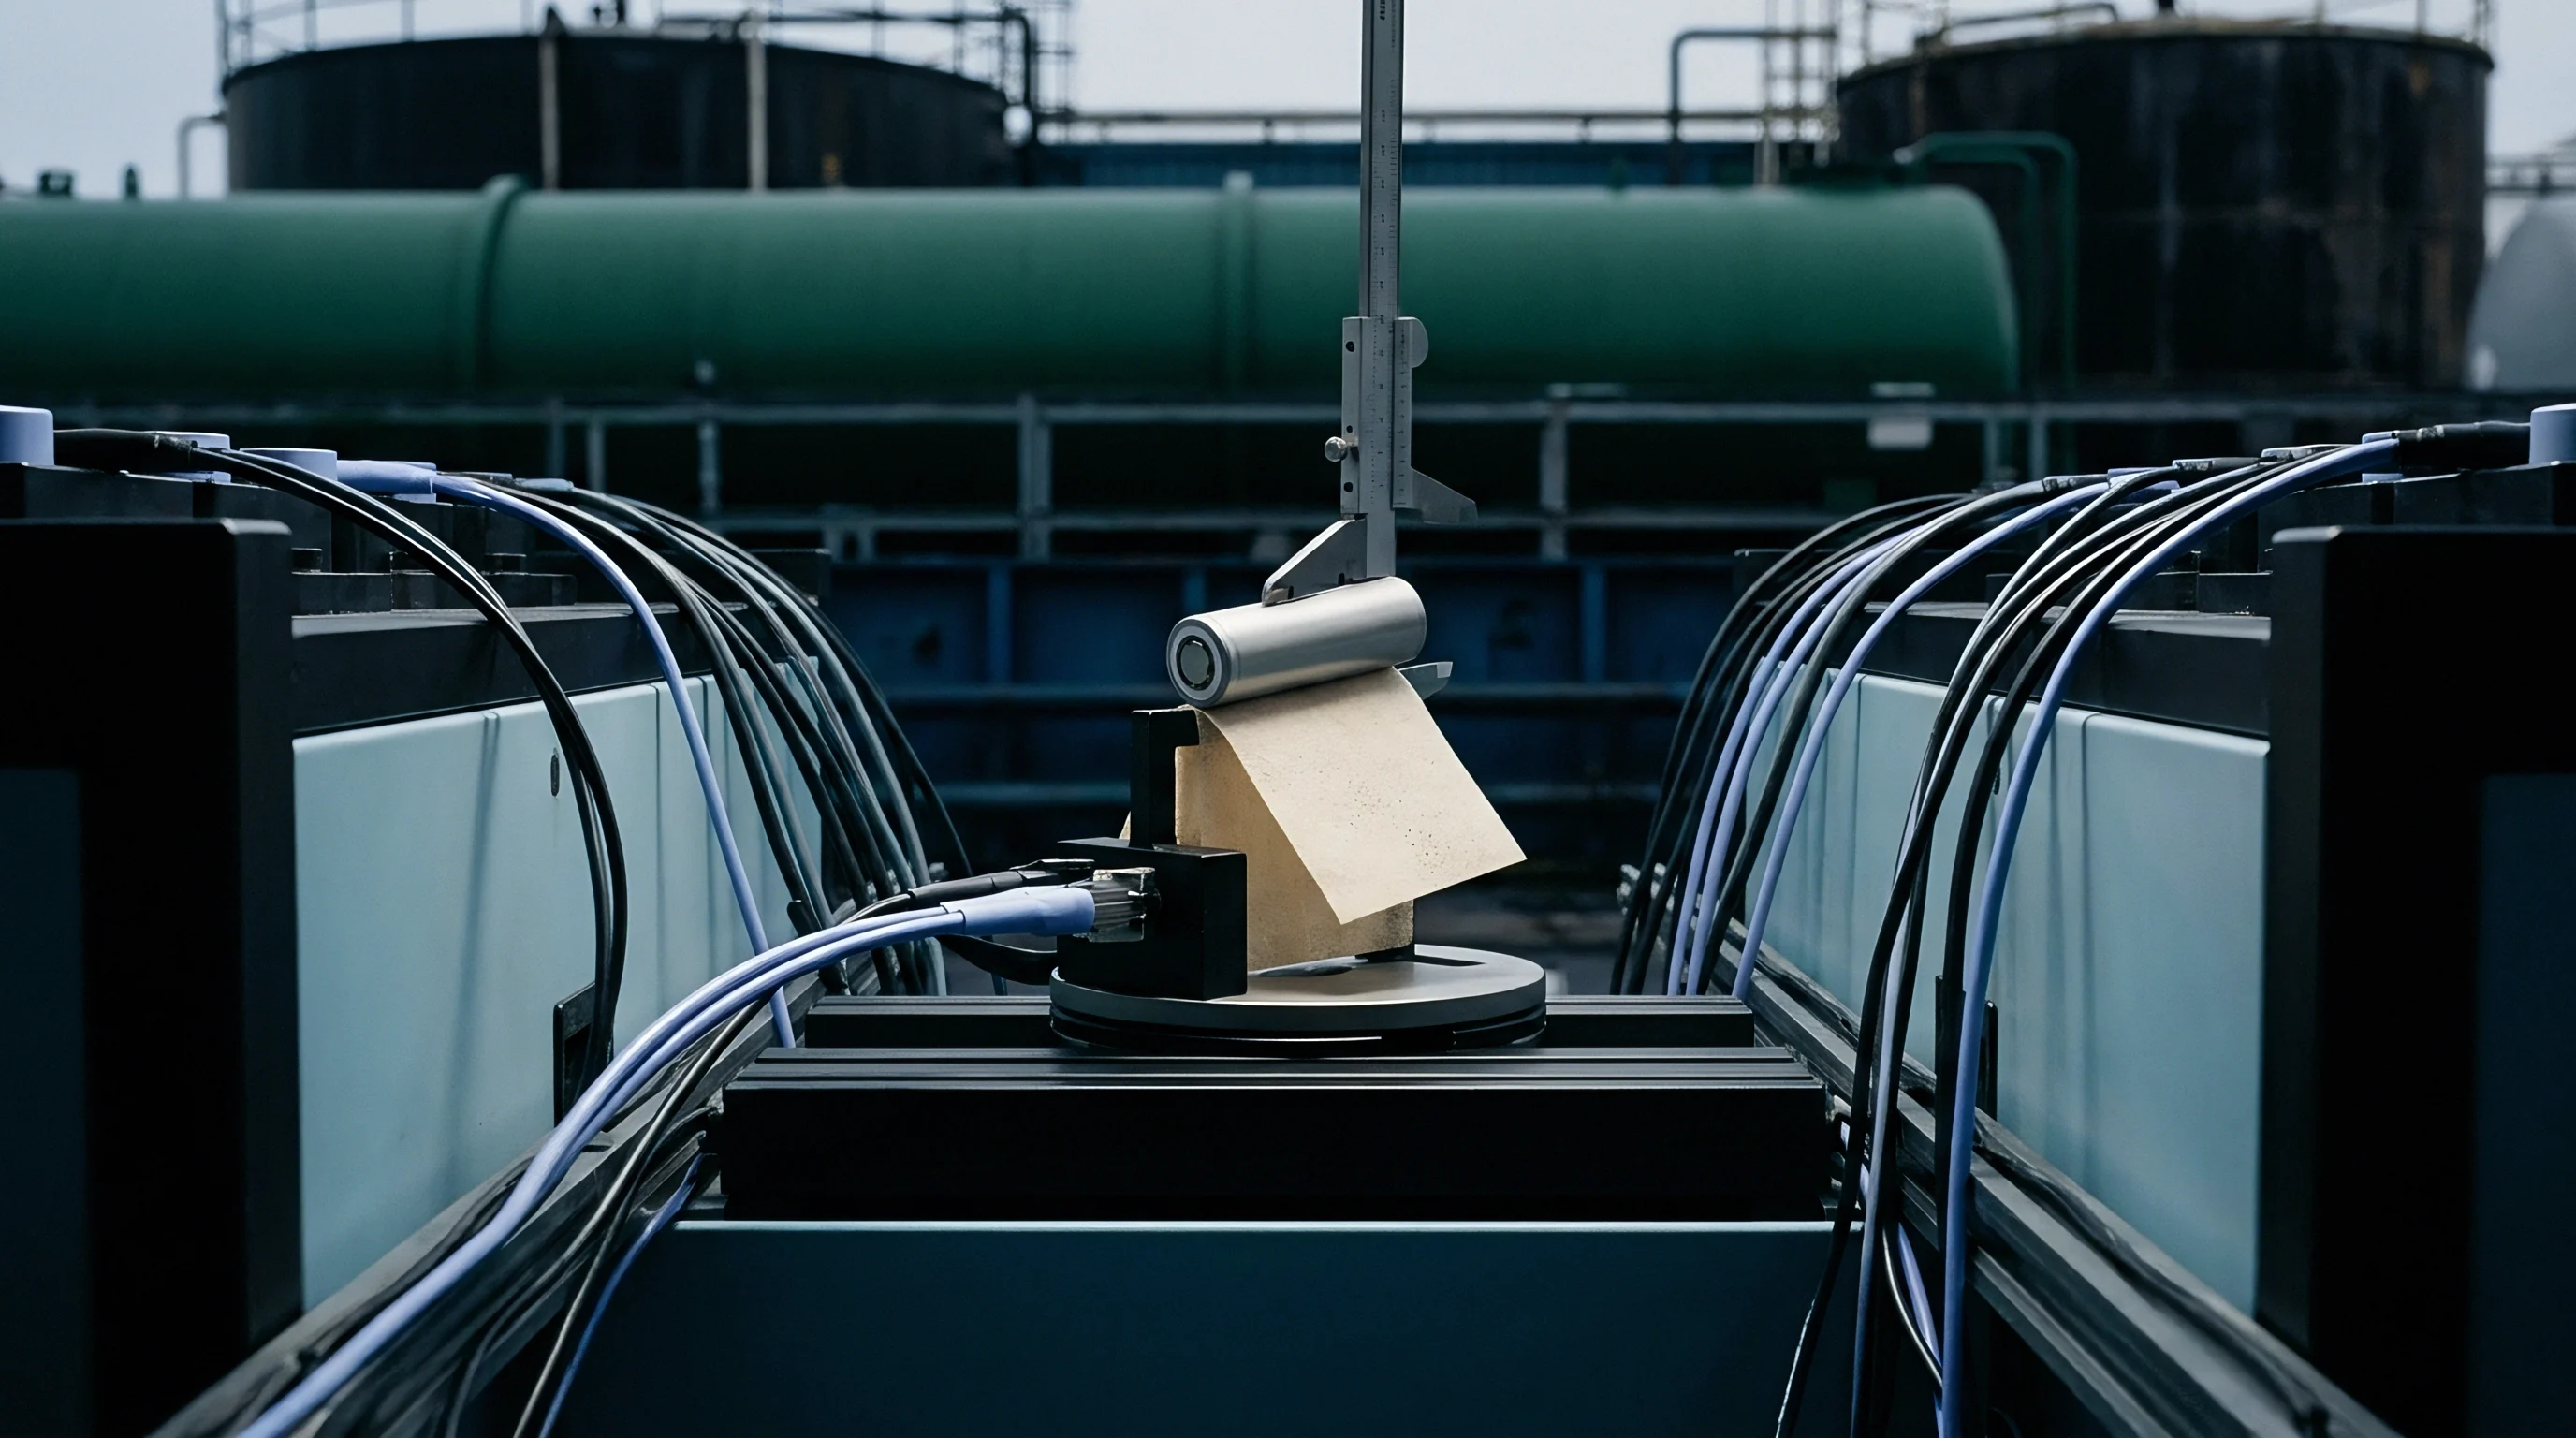
Physical inspections of laboratory test setups frequently uncover surface thermocouples secured with low-temperature kapton tape without thermal conductive paste, resting partially in ambient airflow, or mounted to insulating structural frames instead of direct cell casing metals. These physical setups systematically drop measured surface temperatures by 15 to 40 degrees Celsius during peak thermal stress events.

Software Channel Latency and Synthetic Lead Offset
Software-level decoupling relies on manipulating signal mapping within the cycler data acquisition system. Advanced cyclers route raw sensor readings through internal calibration tables, firmware filtering routines, and channel assignment matrices before writing data to disk. Laboratories alter software channel configuration files to insert artificial time delays, apply fixed temperature suppression offsets, or map secondary ambient channels into primary cell temperature logs.
Inserting artificial delay buffers between voltage and current channels obscures dynamic internal resistance measurements. Under high-rate pulse testing (such as hybrid pulse power characterization protocols), the immediate voltage drop (IR drop) divided by applied current pulse amplitude determines the ohmic resistance of the cell. Offsetting the current step channel by two sampling frames relative to the voltage sensing channel masks the immediate inductive and ohmic drop.
This delay causes the software to calculate cell internal resistance from a later point on the polarization curve, understating true internal resistance by up to 30 percent.
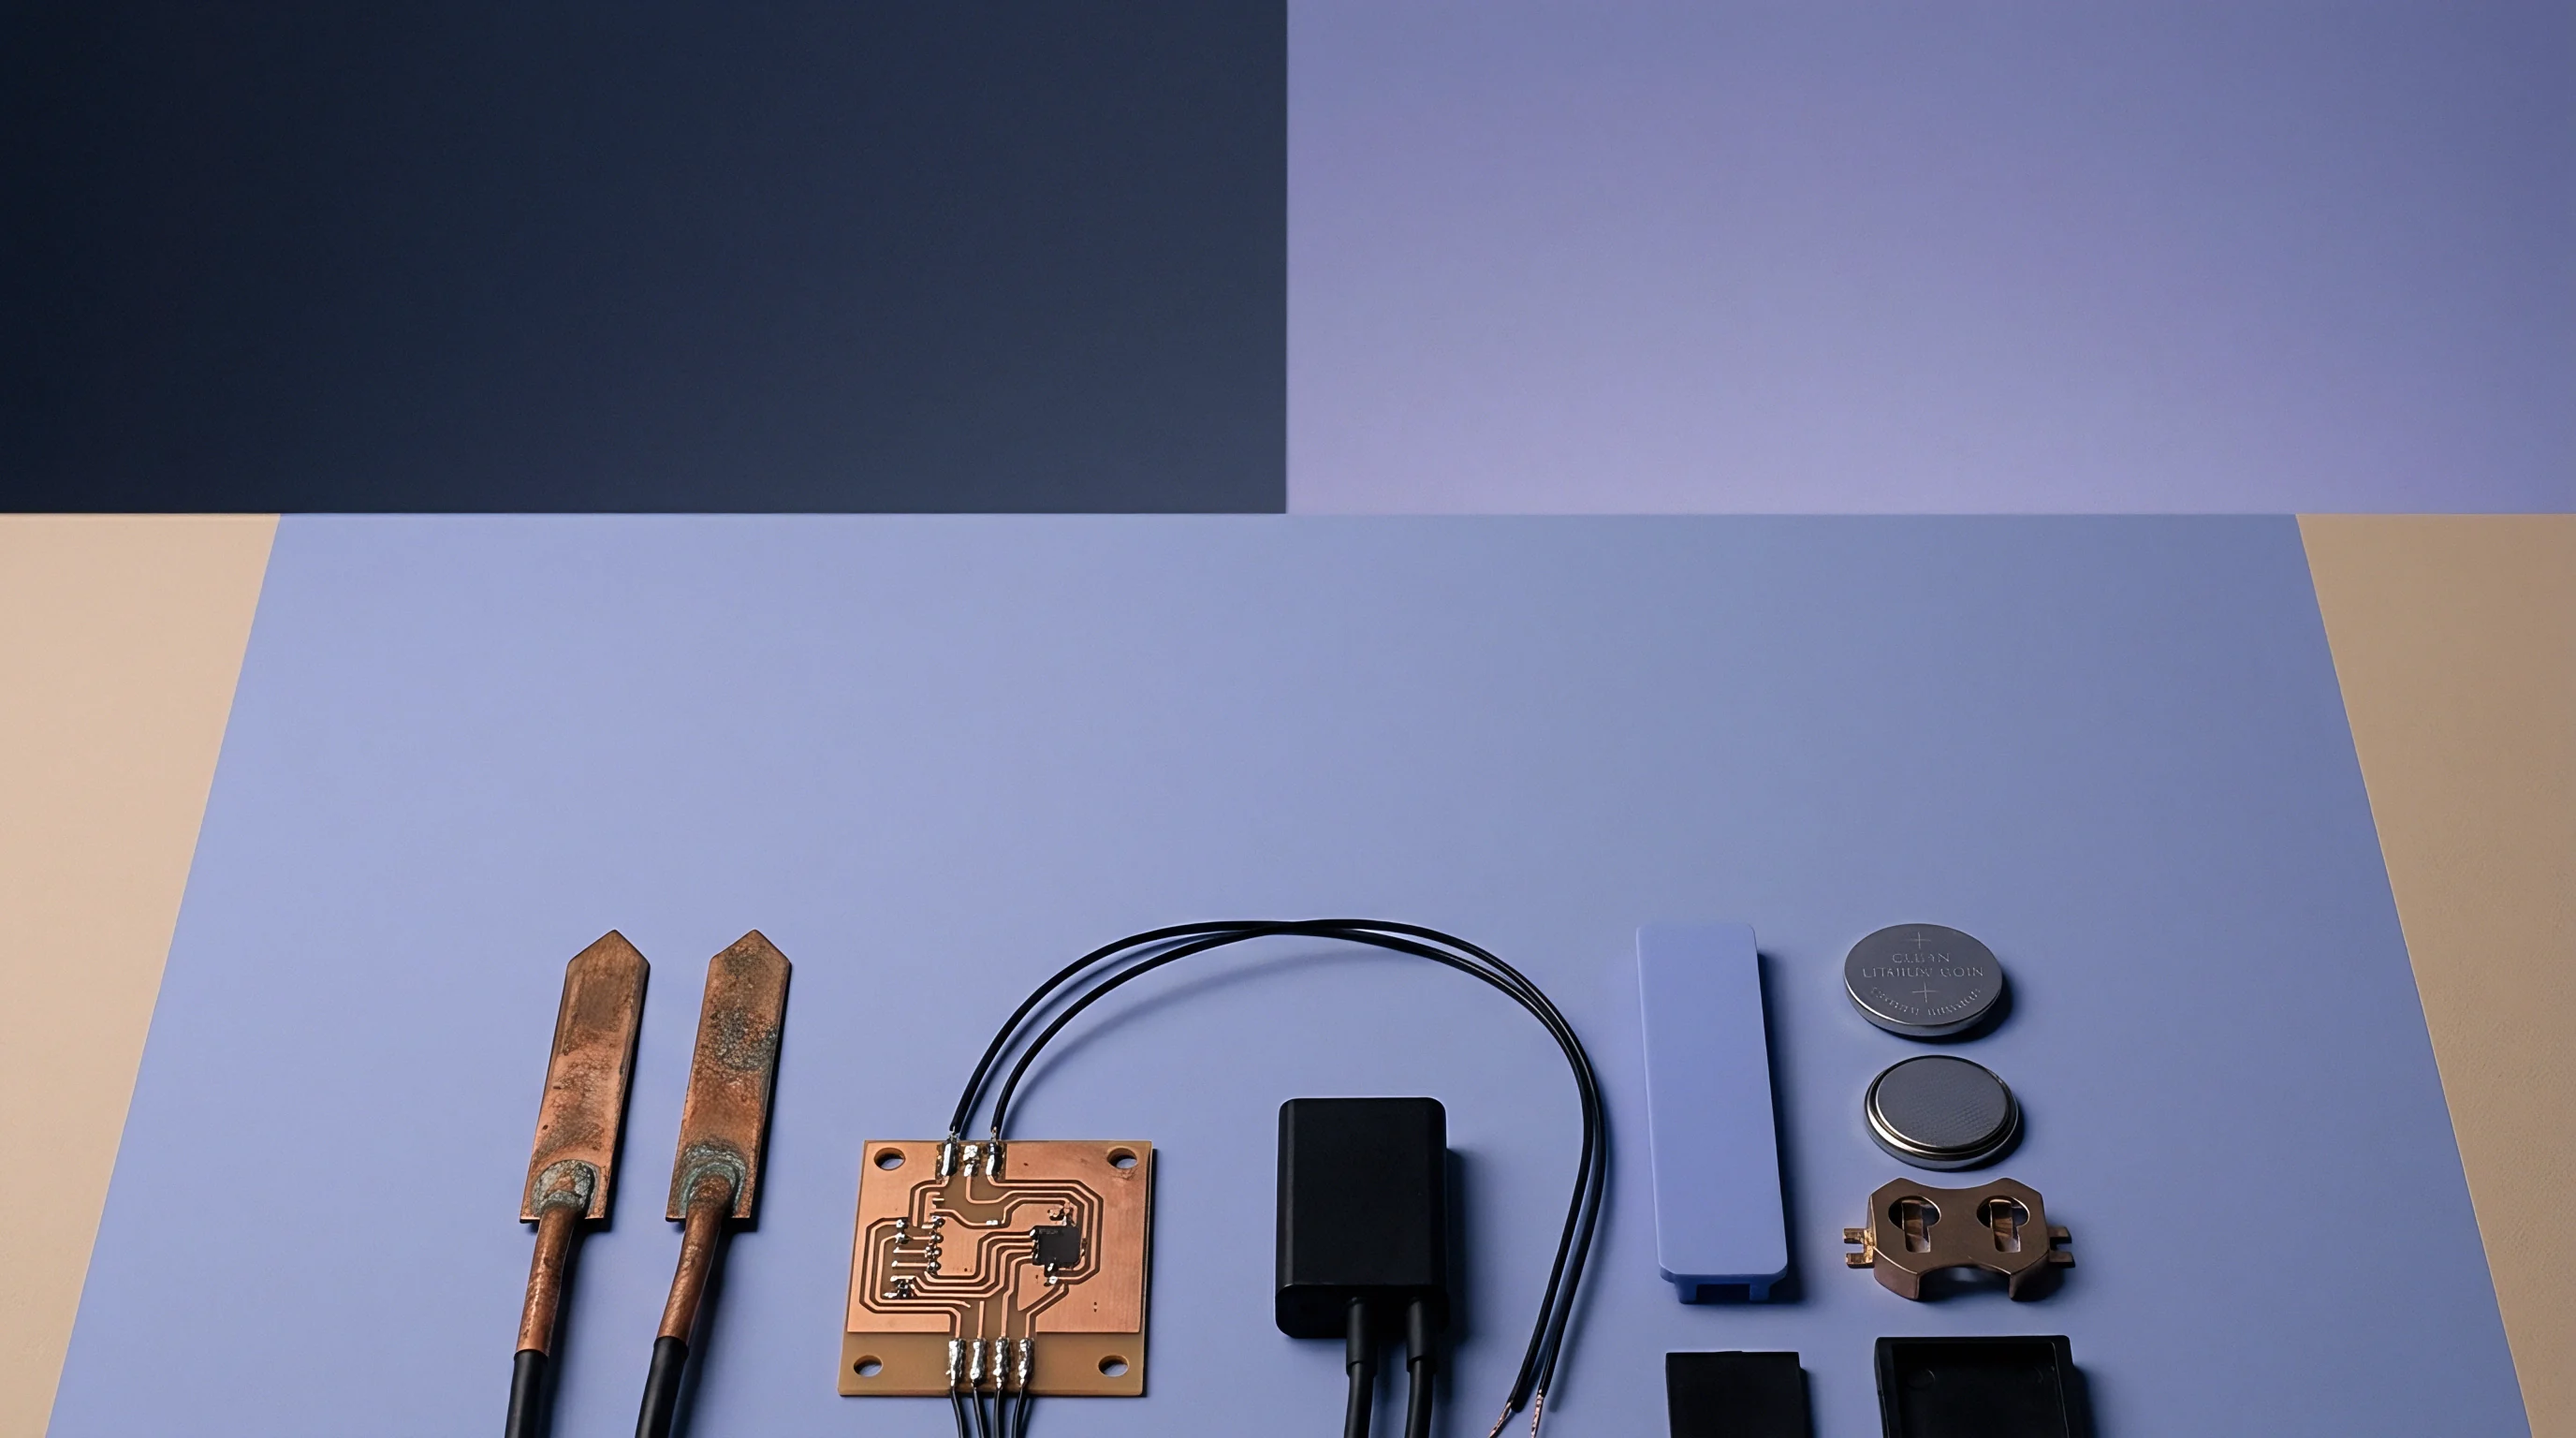
- Verify physical contact between thermocouple junction tips and cell casing using high-temperature aluminum tape and conductive thermal paste reaching at least 2.5 Watts per meter-kelvin.
- Check sensor wiring channels to confirm that temperature input port numbers physically map to target cell identifiers without intermediate software scaling nodes.
- Conduct zero-point cross-calibration by submerging connected thermal probes into an isothermal bath to confirm accuracy within ±0.1 degrees Celsius.
- Apply a short electrical current pulse to establish the true inductive step response, comparing timestamp synchronization between current and voltage channels.
- Review test hardware calibration logs to confirm that zero-offset adjustments and gain correction matrices match certified factory parameters.
Reviewing software configuration parameters requires inspecting raw cycler setup files before test execution. Field audits reveal that laboratories occasionally route primary cell surface channels to secondary dummy thermistors placed in temperature-controlled calibration blocks. The software records a perfectly flat, nominal thermal profile while the active cell undergoes severe degradation or thermal stress on the test bench.
Comparing ambient temperature log variations against active cell thermal response logs exposes these synthetic mapping setups.
Decoupled voltage sensing leads present another major vulnerability during high-current abuse testing. When voltage sense wires are attached to current-carrying power cables rather than directly to cell terminal posts, voltage drop across contact resistance corrupts cell voltage readings. Laboratories exploit this line-drop effect to mask overvoltage conditions during charging or to trigger artificial low-voltage cutoffs during discharge.
Comparing auxiliary terminal voltage sense logs against primary load cable voltage logs identifies uncompensated lead resistance errors.
Discrepancies in surface temperature spikes during high-rate fast-charge qualification often diverge from physical cell behavior through probe displacement under fan cooling.

Forensics
Auditing cell test logs relies on forensic statistical analysis to verify data integrity without requiring physical access to laboratory test benches. Applying mathematical techniques derived from signal processing, statistical mechanics, and forensic accounting uncovers subtle data manipulation, synthetic noise injection, and sensor decoupling artifacts hidden inside large CSV or binary data files.
Falsified datasets often look visually plausible on standard cycling plots. Human operators modifying test results routinely insert synthetic random noise or manually trim non-compliant data peaks to pass qualification criteria. Computer algorithms struggle to replicate the true mathematical properties of natural physical measurement noise.
Applying quantitative forensic statistical checks isolates these human and algorithmic interventions quickly.

First-Digit Distribution and Benford Law Application
Benford’s Law defines the statistical frequency distribution of leading digits in naturally occurring numerical datasets. In unmanipulated physical time-series data covering several orders of magnitude—such as high-frequency current, differential capacity, or dynamic relaxation resistance measurements—the number 1 appears as the leading digit approximately 30.1 percent of the time, while the number 9 appears as the leading digit only 4.6 percent of the time. Applied to raw microvolt variations or dynamic current step changes, Benford’s Law provides an effective initial screening test for data authenticity.
Data modified using synthetic noise generators or uniform linear interpolation violates Benford distribution parameters. When laboratory personnel add uniform or Gaussian random numbers to smoothed datasets to recreate natural noise floors, the leading digits of the variance terms shift toward a uniform distribution where each digit carries a 11.1 percent probability. Computing the Chi-square goodness-of-fit statistic between the observed leading-digit distribution of raw data residuals and theoretical Benford values isolates synthetic noise generation.
| Forensic Statistical Metric | Unmanipulated Physical Data Value | Smoothed / Filtered Data Value | Synthetic Noise Injected Data Value | Data Integrity Conclusion |
|---|---|---|---|---|
| Durbin-Watson Residual Statistic | 1.85 to 2.15 (Uncorrelated noise) | 0.05 to 0.45 (Strong positive autocorrelation) | 1.95 to 2.05 (Artificially perfect normal) | Values below 1.5 indicate low-pass software filtering |
| Benford Leading-Digit Chi-Square | χ² < 15.5 (Matches Benford curve) | χ² > 45.2 (Severe deviation) | χ² > 85.8 (Uniform random injection) | High Chi-square proves non-physical data generation |
| Spectral Power Slope (1/f^α) | α = 1.2 to 1.8 (Pink/Brown noise spectrum) | α > 3.5 (Abrupt high-frequency roll-off) | α ≈ 0.0 (Flat white noise floor) | Alpha above 3.0 proves high-frequency signal suppression |
| High-Order Derivative Jump Continuity | Smooth continuous variations (C² continuous) | Step discontinuities at window edges | Random phase jumps in high derivatives | Discontinuities prove windowed polynomial splicing |

Spectral Power Density and High-Frequency Loss
Analyzing datasets in the frequency domain using Fast Fourier Transforms (FFT) provides definitive proof of digital data smoothing. Natural electrical and thermal measurements exhibit a characteristic power spectral density (PSD) profile that decays according to a power-law relationship (1/f^alpha) as frequency increases. Pink noise (alpha near 1.0) and Brown noise (alpha near 2.0) dominate real electrochemical systems due to thermal diffusion dynamics, ionic transport relaxation, and structural resistance variations.
Applying digital smoothing filters creates an unnatural sharp drop in spectral power above the filter cutoff frequency. Plotting the logarithm of spectral power against the logarithm of frequency for raw voltage or temperature time-series logs yields a linear slope for genuine physical data. Filtered data displays a sudden steepening of this slope—often dropping by more than 40 decibels per decade—at frequencies corresponding to the inverse of the filter window size.
Section 8.3 of international test standard IEC 62619 dictates that continuous voltage and thermal log files must retain raw sensor sampling rates without post-processing compression during safety qualification cycles.
- Spectral attenuation slope calculated via Fast Fourier Transformation reveals unnatural high-frequency power cutoffs indicating active low-pass digital filtering.
- Autocorrelation decay length measures how long previous noise states influence current readings, exposing artificial windowed averaging algorithms.
- Quantization step alignment checks whether small variations align with physical analog-to-digital converter step boundaries or display continuous synthetic floating-point values.
- Timestamp spacing variance highlights skipped logging frames during critical thermal events, signaling selective data removal by operators.
- Residual skewness and kurtosis evaluate higher-order statistical moments of baseline noise, detecting non-Gaussian synthetic noise injection.
A commercial cell pouch qualification program incurred half a million dollars in losses when a laboratory masked localized swelling by smoothing pressure transducer data. The smoothed pressure log showed steady, linear force accumulation during cycle-life testing. Statistical analysis performed post-failure revealed that high-frequency pressure fluctuations corresponding to gas phase separation were completely absent from the laboratory logs.
The raw binary database, recovered months later, showed severe pressure spikes that should have triggered immediate qualification failure.
Evaluating high-order derivatives of voltage time-series logs provides another tool for detecting data manipulation. The second derivative of voltage with respect to time (d²V/dt²) highlights micro-jump discontinuities caused by windowed algorithm edges. Real electrochemical processes produce smooth, continuous variation in high-order derivatives.
Numerical smoothing filters using sliding windows leave localized derivative jumps at window boundaries. Detecting periodic derivative spikes matching standard window lengths (such as 5, 10, or 20 sampling points) confirms that post-processing software was applied to raw cell logs prior to export.
Engineering operations absorbed a seventy-thousand-dollar re-testing expense after relying on third-party test logs that had been smoothed using hidden polynomial filters.

Firmware
Battery cycler hardware controllers rely on embedded firmware to execute current profiles, measure terminal responses, and log operational parameters to disk. Laboratories alter firmware configuration files or deploy automated scripts within cycler management software to manipulate data recording streams in real time. These hardware-level practices prove difficult to detect because the resulting export files appear to originate directly from native hardware logging engines.
Exploiting automated downsampling settings allows test facilities to suppress non-compliant thermal or electrical spikes. Modern battery testing software platforms feature dynamic data logging rules designed to save hard drive space. These rules reduce logging frequency during steady-state conditions and increase sampling rates when voltage or temperature rates of change exceed set thresholds.
Manipulating these dynamic logging rules forces the system to drop high-frequency data precisely when micro-thermal events or voltage instability occur.

Automated Downsampling and Data Reduction Exploits
Downsampling exploits operate by setting extremely high threshold values for dynamic log triggers. Under standard operation, a cycler logs data every 100 milliseconds during fast charging. If a surface temperature rise rate threshold (dT/dt) is set artificially high (e.g.
5.0 °C per second), the cycler ignores thermal events that rise at 2.0 °C per second, continuing to log data at a sparse background rate of once every 60 seconds.
Sparse sampling understates transient peak values. A rapid thermal spike reaching 75 °C for three seconds drops out of a dataset logged at 60-second intervals. The resulting time-series log records only steady-state baseline temperatures of 32 °C, completely omitting the dangerous thermal excursion.
Auditing data logs requires checking the continuity of timestamp intervals. Variable timestamp spacing during high-rate charge or discharge steps indicates active logging suppression designed to bypass abort thresholds.
Dynamic downsampling protocols that reduce logging frequency during dynamic load steps hide critical phase-transition voltage spikes and thermal runaway precursor signals.
Firmware calibration registers can also be programmed with artificial gain factors and zero-point offset matrices. In typical operations, voltage sensor channels undergo calibration using precision reference sources to eliminate shunt resistor measurement drift. Laboratory operators introduce modified calibration matrices into firmware memory, scaling voltage measurements downward by a fixed percentage (such as 2.5 percent) during high-current charging steps.
This offset prevents high-nickel cathode cells from reaching software overvoltage abort limits, allowing cells to accept excessive charge without triggering safety shutdowns on the cycler.
Interpolation Truncation during Thermal Excursions
Firmware-level linear interpolation algorithms present another path for data manipulation. When cycler hardware experiences communication latency or dropped packets between sensor measurement boards and primary storage servers, firmware algorithms interpolate missing values between the last valid recorded point and the next incoming reading. Laboratories deliberately induce network delay on sensor channels or configure cycler firmware to operate in permanent interpolation mode.
Interpolation truncation smooths physical temperature spikes into straight-line trends. If a thermocouple probe loses communication for ten seconds during an intense exothermic reaction, the firmware draws a linear bridge between the 35 °C pre-event temperature and the 42 °C post-event recovery temperature. The actual physical thermal peak of 88 °C that occurred during the communication outage is completely erased from the operational file.
Continuous clock drift observed across multiple cycler channels during facility audits confirms deliberate network throttling of auxiliary temperature sensor boards.
Reconstructing dropped data points requires checking hardware status registers and communication log files generated by the cycler host computer. Native hardware status logs record transmission errors, buffer overflow events, and packet re-transmissions. Cross-referencing these status records against primary data logs reveals whether linear data gaps align with deliberate network interrupts or hardware communication failures.
Advanced cycler management software includes automated script execution modules. Operators write custom Python or VBA scripts that run automatically upon completion of a test step, scanning output datasets for non-compliant data points—such as minor voltage overshoot or temperature spikes—and replacing them with mathematically interpolated values before the final data file is written to non-volatile storage. Finding these script executions requires auditing cycler job execution files, software macro libraries, and file modification metadata timestamps on host laboratory servers.
Sourcing teams must verify whether hardware firmware calibration files were altered prior to running long-term cycle-life tests without relying on unannounced physical teardowns of host cycler controllers.

Extraction
Recovering unmanipulated raw test data requires bypassing laboratory export layers and extracting binary data files directly from cycler host storage drives. Standard export formats such as CSV, XLSX, or formatted text files pass through intermediate software filtering, downsampling, and custom presentation layers where data smoothing and channel suppression typically occur. Accessing raw, proprietary binary databases preserves the original measurement records, hardware calibration tables, and raw sensor timestamp streams.
Proprietary cycler data formats write binary data structures directly to disk to maintain high-throughput logging across hundreds of independent test channels. These binary files incorporate proprietary headers, raw analog-to-digital converter step counts, fixed-point integer representations of voltage and current, and hardware-level error flag registers. Extracting raw records requires specialized binary parsing utilities or native database reader applications operating outside the standard laboratory report generation pipeline.
Parsing Proprietary Cycler Data Formats
Binary extraction begins with identifying the native storage architecture used by the specific cycler platform. Major battery cycler platforms store raw test data inside proprietary relational or flat binary structures. These files preserve raw integer counts directly from analog-to-digital converter chips before software scale factors, gain corrections, or post-processing filters apply.
Parsing these binary files exposes structural discrepancies between raw internal database contents and finalized export files provided to buyers. In typical audit scenarios, raw binary logs reveal micro-volt transient noise, short-duration current spikes, and sub-second thermal fluctuations that were systematically stripped out during laboratory CSV export generation. Extraction procedures compel technical auditors to demand native binary files (.res, nda, mpr, or.s4p depending on hardware vendor) directly from laboratory data servers as a mandatory condition for safety file qualification.
| Hardware System Format | Native File Extension | Binary Storage Architecture | Raw Sensor Artifact Location | Direct Extraction Recovery Procedure |
|---|---|---|---|---|
| Maccor Cycler Platform | .RES /.REC | Fixed-length binary record blocks with custom file headers | Byte offset 0x0180 holds uncalibrated 24-bit ADC counts | Parse binary file using custom C/Python structure unpack scripts |
| Neware Testing System | .NDA /.NDC | Encrypted binary records containing dynamic sampling blocks | Sub-block records contain high-frequency micro-step logs | Decrypt raw binary stream using verified vendor DLL libraries |
| BioLogic Electrochemistry | .MPR /.MPT | Binary field-mapped structure with embedded hardware metadata | Header blocks store real-time hardware error flags | Extract uncompressed data points using open EC-Lab header parsers |
| Arbin Instruments | .S4P /.RESX | SQL-based database containers (MS Access / SQL Server) | Raw data tables retain full-rate step change data | Query SQL backend tables directly, bypassing application export filters |

Timestamp Drift and Hardware Clock Auditing
Auditing raw extraction files requires validating hardware clock synchronization across test channels. Every data record written to disk carries a timestamp generated either by the local channel controller board or by the host operating system clock. Hardware clock drift occurs naturally over months of continuous galvanostatic testing due to crystal oscillator frequency variations under shifting laboratory room temperatures.
Unnatural discontinuities in timestamp sequences expose manual file editing or data splicing. When laboratory technicians trim out non-compliant test segments—such as thermal excursions or temporary power outages—and manually splice remaining sections together, timestamp values jump unexpectedly. Calculating the delta-time between consecutive data points reveals discrete time skips, negative time jumps, or perfectly uniform timestamp intervals lacking natural microsecond jitter.
Raw binary database structures retain uncalibrated analog-to-digital integer counts that remain unaffected by secondary software filtering or calibration table manipulation.
- Binary header verification checks file creation dates, hardware serial numbers, and firmware build identifiers against physical equipment logs.
- Raw ADC integer extraction reads native bit values directly from memory storage, bypassing software scaling parameters.
- Time-delta continuity mapping calculates microsecond intervals between consecutive logs to detect erased or spliced dataset sections.
- Hardware error register parsing decodes internal cycler flag registers to locate hidden overvoltage, overtemperature, or current limit abort signals.
- Database transaction log auditing inspects database commit histories to verify whether raw data rows were altered post-test execution.
Direct binary log extraction provides absolute proof of data integrity, eliminating ambiguity surrounding laboratory post-processing.
The procurement team rejected the entire lot after raw binary extraction revealed suppressed thermal spikes that were completely absent from the laboratory’s certified PDF test summary. The supplier’s export reports presented a stable 38 °C maximum surface temperature during 3C fast-charging qualification. Extracting the raw binary.RES file directly from the Maccor server drive uncovered twenty-four separate thermal events exceeding 68 °C that had been manually scrubbed from the final export CSV files using an automated post-processing script.
Establishing raw binary data custody demands strict file transfer protocols. Technical teams must require test facilities to generate cryptographic hash digests (SHA-256) of native binary database files immediately upon test completion. Verifying hash digests prior to accepting data files guarantees that test records have not been opened, edited, or re-exported through third-party data manipulation utilities.
Standard quality clause 4.2 in modern cell supply agreements mandates that suppliers provide unredacted, native binary database files alongside cryptographic SHA-256 hash receipts within twenty-four hours of test step completion.
Remedy
Mitigating the risks of data smoothing and sensor decoupling requires enforcing rigorous commercial, contractual, and technical controls across all battery qualification operations. Relying solely on third-party test certificates or supplier-provided data summaries leaves engineering organizations vulnerable to catastrophic field failures, safety recalls, and customs enforcement actions. Buyers must establish direct control over data collection protocols, mandate raw file access rights, and execute independent verification audits on high-stakes cell procurement contracts.
Contractual provisions form the primary defense against laboratory falsification. Cell supply agreements and independent test statements must explicitly define data integrity requirements, specifying unacceptable post-processing techniques and establishing clear financial penalties for non-compliance. Integrating enforceable audit rights into procurement contracts empowers buyers to inspect laboratory facilities, audit firmware configurations, and extract raw binary logs without advance notice.
Data Integrity Mandates in Cell Qualification Contracts
Data governance contracts must explicitly forbid post-processing data modification, digital low-pass filtering, and windowed smoothing algorithms on all qualification test streams. Specifications must define acceptable sampling parameters, hardware calibration cycles, and sensor mounting standards. Mandating that laboratories deliver unredacted, native binary cycler files (.RES, NDA, S4P) alongside standard export files ensures that engineering teams can conduct full forensic audits on raw measurement data.
Contracts must establish clear protocols for physical sensor placement during safety and performance testing. Specifications should state that thermocouples must be secured directly to active casing metals using thermal conductive adhesives with certified thermal conductivity ratings. The agreement should explicitly prohibit the use of intermediate isolation shims, non-conductive mounting tapes, or offset sensor positioning unless authorized by the buyer’s technical leads.
- Raw binary custody obligations require laboratories to retain native cycler database files in unaltered state for a minimum of seven years.
- Cryptographic hash generation mandates the creation of SHA-256 hash files immediately following test execution to establish data chain of custody.
- Unannounced audit access grants buyer engineering teams full access to laboratory test benches, host cycler servers, and software setup files.
- Sensor mounting protocols define exact physical attachment criteria, thermal interface materials, and allowable sensor location tolerances.
- Financial indemnity terms assign full liability for re-testing costs, pack recall expenses, and legal damages to laboratories caught falsifying data.
Enforcing financial penalties deters data manipulation. Sourcing contracts should include liquidated damages clauses that trigger immediately upon detection of deliberate data smoothing, sensor decoupling, or log falsification. Penalties should cover the full cost of cell qualification runs, material losses, engineering labor, and independent third-party audit fees required to validate compromised production batches.
Unannounced Laboratory Verification Routines
Physical facility audits complement contractual safeguards by verifying laboratory compliance on the ground. Auditors must inspect active test channels during live qualification runs, checking physical thermocouple attachments, software channel configurations, and cycler firmware settings. Unannounced audits prevent laboratories from restructuring non-compliant test setups prior to inspection.
Auditors must verify hardware calibration status by reviewing certified calibration certificates for current shunts, voltage amplifiers, and temperature data acquisition boards. Testing equipment must undergo traceably calibrated verification at least annually. Checking hardware calibration logs stored inside cycler firmware confirms that equipment operates within specified accuracy windows without artificial software gain offsets.
Independent verification testing provides the final validation layer for cell qualification. Buyers should route a random sample of production cells (e.g. 5 to 10 units per manufacturing lot) to an independent, accredited reference laboratory for parallel verification testing.
Running identical test protocols on independent hardware isolates discrepancies between supplier laboratory reports and true physical cell performance, identifying data smoothing or sensor decoupling practices before cells integrate into high-voltage battery packs.
Deploying automated data verification scripts within internal engineering workflows accelerates audit procedures. Technical teams should process all incoming laboratory datasets through automated analytical pipelines that evaluate residual noise autocorrelation, calculate spectral power slopes, check Benford’s Law compliance, and verify timestamp continuity. Identifying statistical anomalies automatically flags suspicious datasets for deep forensic review, protecting sourcing practices from accepting compromised cell designs.
Technical teams establishing qualification frameworks integrate automated binary parsing routines into incoming quality control systems, ensuring every data file undergoes rigorous forensic evaluation before cell models advance to volume procurement.