Polymer Permeation versus Knudsen Channel Flow in Solid-State Electrolyte Battery Headspace Outgassing Metrology
Polymer permeation scales with temperature while Knudsen flow tracks gas molecular weight, enabling helium argon ratios to isolate structural leak channels.


Pore
Outgassing in sealed solid-state cells follows two main paths: localized defects or uniform transport through polymer membranes. Removing volatile liquid solvents lowers volatile content, but gas still forms through interfacial side reactions, residual processing solvents, lattice oxygen release at high-voltage oxide cathodes, and moisture reaching sulfide conductors. Measuring this gas requires metrology that can tell transport mechanisms apart; a leak across a polyolefin heat seal follows different physical laws than Knudsen flow through a cracked ceramic separator or glass feedthrough.
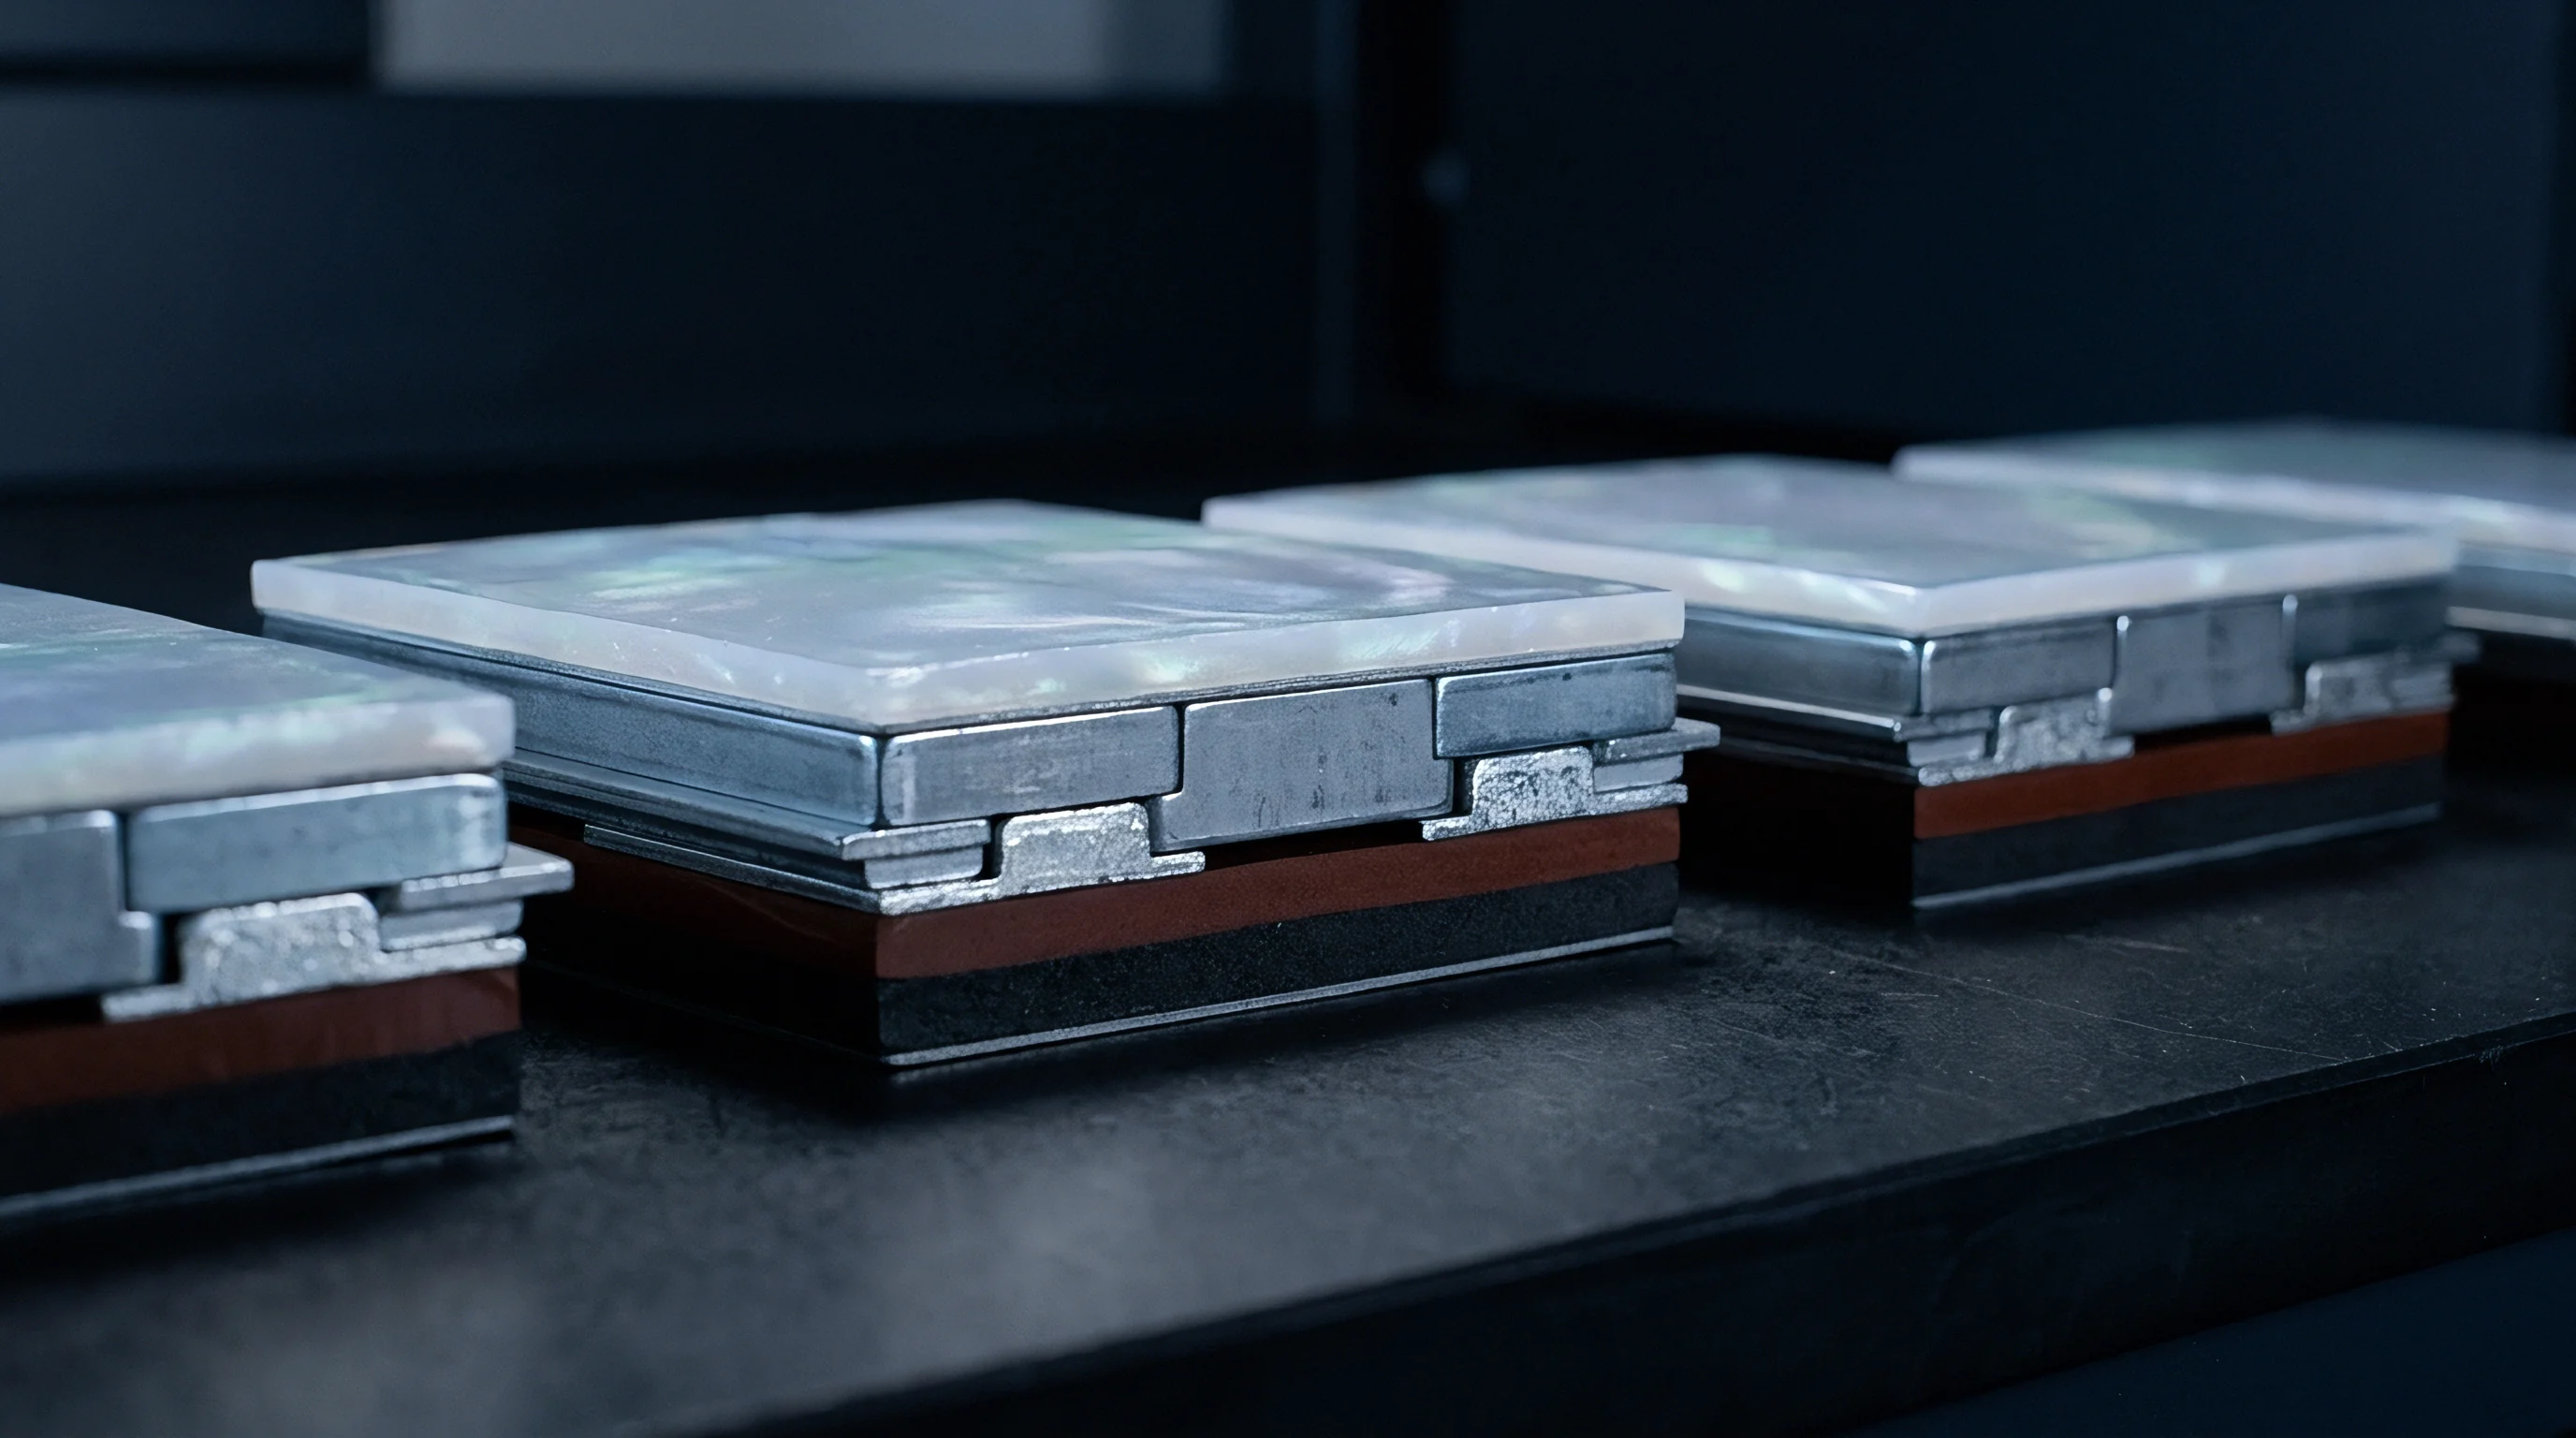
Solid-state packaging generally uses multi-layer polymer-aluminum pouch laminates or rigid metal cans with glass-to-metal seals. In pouch designs, gas transport happens mostly by solution-diffusion through the polyolefin inner sealant layer along the heat seal perimeter. Molecules dissolve into the polymer, diffuse down the concentration gradient, and desorb into the external environment or cell headspace ~ a steady, uniform flux across the whole seal area.
Physical defects change this behavior entirely. Sintering voids in inorganic electrolytes, micro-cracks from chemo-mechanical volume changes during cycling, heat-seal pinholes, and micro-fissures in glass-to-metal feedthroughs form narrow passages. When channel diameters match or drop below the mean free path of the gas molecules, transport shifts to Knudsen diffusion.
Microstructural Origins of Packaging Failure Mechanics
Ceramic separators and composite interlayers encounter severe chemo-mechanical stress during cycling. Garnet-type oxide electrolytes like lithium lanthanum zirconium oxide offer high ionic conductivity, but localized current focusing and dendrite growth trigger grain boundary micro-cracking. These fractures create continuous void networks between anode and cathode compartments.
Sulfide electrolytes, such as lithium phosphorus sulfur chloride glass-ceramics, have lower shear moduli and form micro-voids under cyclic stack pressure.
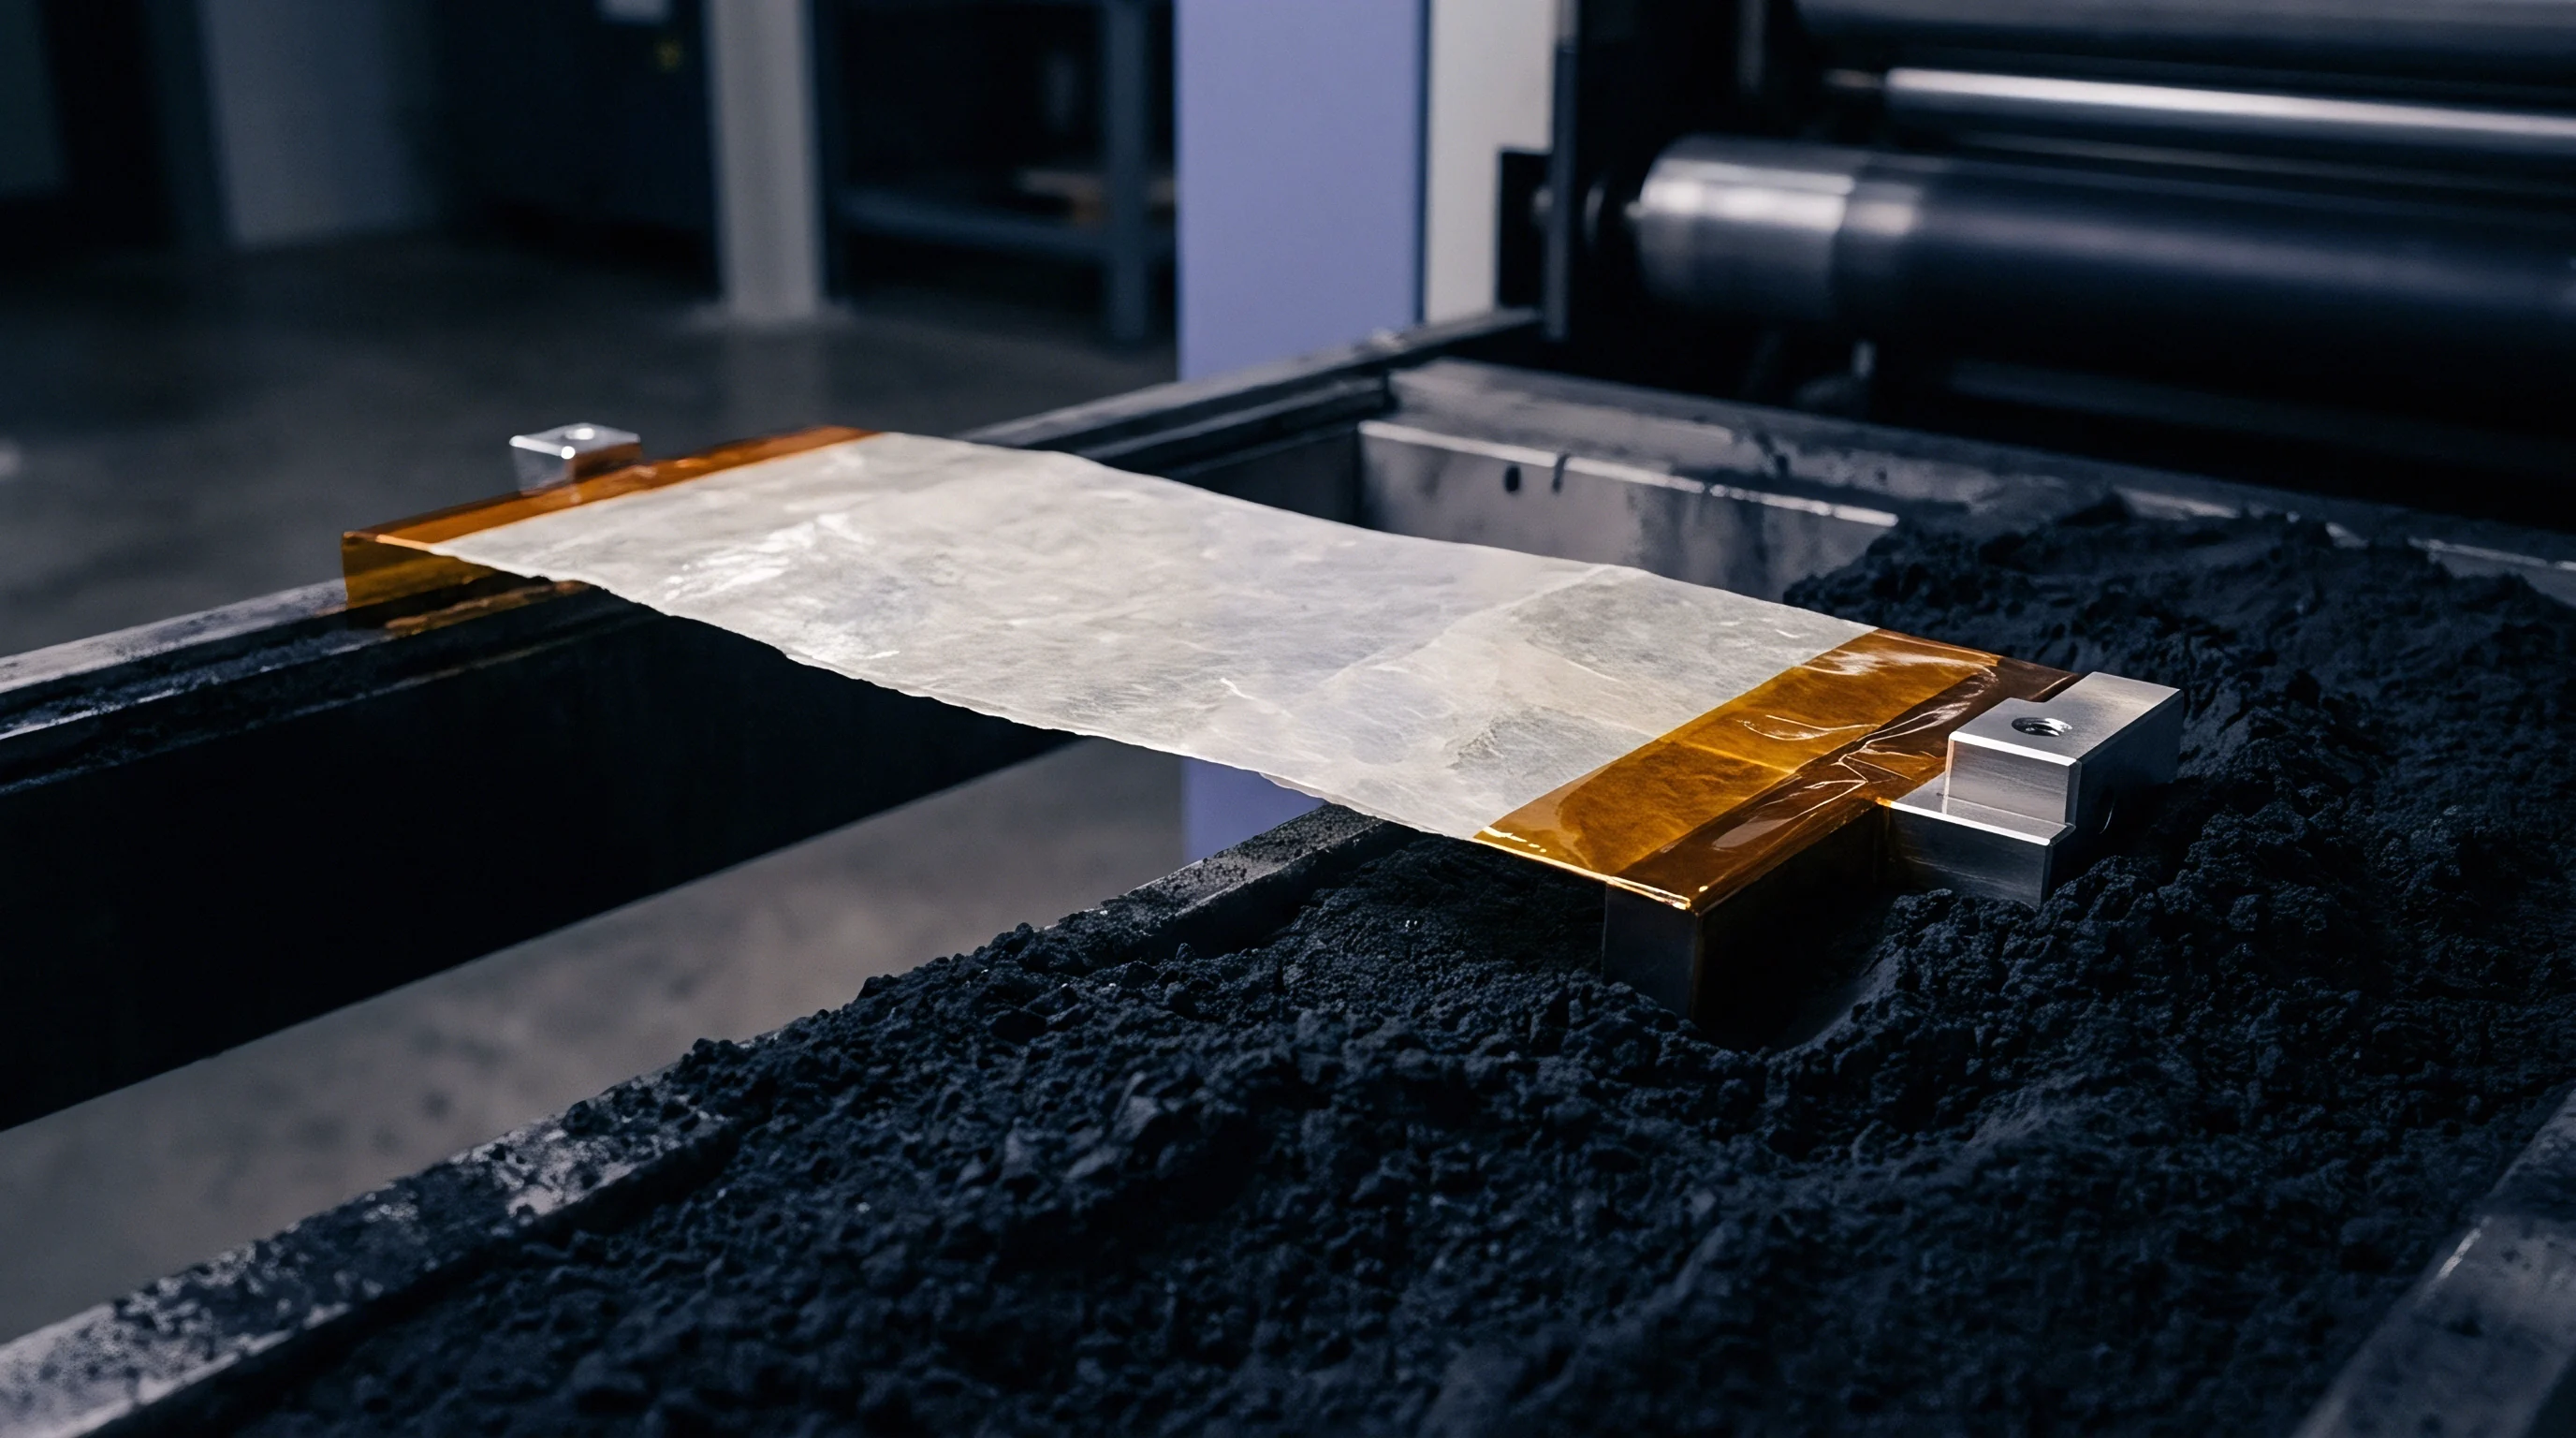
Peripheral heat seals create additional failure points. Heat sealing leaves thermal stresses, thins the polymer locally, and can trap ceramic particles from slurry coating. When an inorganic particle bridges the polyolefin sealant, a high-aspect-ratio channel forms along the particle-binder interface.
This gap acts as a capillary, shifting gas movement from solution-diffusion to Knudsen or transition flow.

Chemical Profiles of Solid Electrolyte Headspace Gases
Interfacial reactions at the lithium anode and cathode generate volatile species tied directly to electrolyte chemistry. Sulfide-based systems produce toxic hydrogen sulfide gas whenever moisture enters through package defects. Even in ultra-dry dryrooms, residual hydrogen impurities in precursor raw materials react during high-voltage holds, generating hydrogen sulfide, organosulfur volatiles, and trace hydrogen gas.
Garnet oxide electrolytes react with atmospheric moisture and carbon dioxide during handling, building up surface layers of lithium carbonate and lithium hydroxide. On initial formation above four volts relative to metallic lithium, these species decompose and offgas carbon dioxide and oxygen into the headspace. Hybrid polymer-ceramic electrolytes with poly(ethylene oxide) or polyvinylidene fluoride matrices release fluorinated hydrocarbons and hydrogen fluoride during thermal spikes or overcharge.
Differentiating atmospheric air ingress from internal degradation outgassing requires mass-selective headspace metrology with species-specific detection limits.
Solid-state electrolyte cell hermeticity testing relies on continuous mass spectrometry baseline correction to separate seal permeation from intergranular micro-channel venting.
Structural hermeticity characterization must differentiate between diffusive loss through intact packaging materials and convective or Knudsen leakage through structural flaws. Packaging that passes a standard bubble or pressure decay test can easily conceal Knudsen micro-channels capable of degrading sulfide electrolytes over several years. Manufacturers often attribute elevated helium signals during vacuum testing to harmless desorption off external pouch films, masking physical defects across the electrolyte barrier.
Kinetics
Evaluating transport physics across cell enclosures requires contrasting gas movement through bulk materials with flow through narrow micro-passages. Transport through dense polymer membranes follows Fickian solution-diffusion: permeability is the product of thermodynamic solubility and the gas diffusion coefficient in the matrix. Gas flux scales linearly with partial pressure differential across the film and shows an exponential Arrhenius temperature dependence.
Channel flow through physical flaws follows different scaling laws dictated by the Knudsen number ~ the ratio of molecular mean free path to channel diameter. When the Knudsen number exceeds ten, wall collisions dominate over intermolecular collisions. In this Knudsen regime, molar flux scales inversely with the square root of molecular weight and absolute temperature.
When channel diameters widen and Knudsen numbers fall below 0.01, gas-gas collisions take over, driving transport into viscous continuum flow described by Poiseuille kinetics, where flux varies inversely with dynamic viscosity and scales with average total pressure squared.
Evaluating the helium-to-argon permeability ratio across suspect cell packaging seams reveals the dominant transport mode. In a Knudsen flow defect, the ratio of helium molar flux to argon molar flux equals the square root of the inverse molecular mass ratio, yielding a fixed value of approximately 3.16. In dense polymer permeation, helium permeating through a polyolefin or fluoroelastomer matrix exhibits a selectivity ratio relative to argon that typically ranges between 15 and 200, driven by the vast difference in kinetic diameter and rubbery polymer matrix free-volume interaction.
Measuring a helium-to-argon transport ratio near 3.16 confirms the presence of physical Knudsen channel defects regardless of absolute flow magnitude.
Mathematical Formulation of Polymer Solution-Diffusion Transport
Permeation through dense polyolefin, fluoroelastomer, or aluminum-laminate pouch films follows a multi-step thermodynamic process. The total steady-state volumetric gas flux through a polymer film of area and thickness under a partial pressure difference obeys the direct relation:
J_sol = frac{P_{perm} cdot A cdot Delta P}{x}
The permeability coefficient decomposes into the thermodynamic solubility coefficient and the kinetic diffusion coefficient:
P_{perm} = S cdot D
The diffusion coefficient varies exponentially with temperature according to an Arrhenius relationship containing the activation energy of diffusion:
D(T) = D_0 cdot expleft(-frac{E_d}{R cdot T}right)
Activation energies for gas diffusion in semi-crystalline pouch polymers range between 20 kilojoules per mole and 55 kilojoules per mole. Warming a cell from 25 degrees Celsius to 60 degrees Celsius increases polymer permeation flux by 300 percent to 800 percent. Gas selectivity in polymers depends on penetrant kinetic diameter and condensability ~ small non-polar molecules like helium and hydrogen diffuse orders of magnitude faster than atmospheric nitrogen, oxygen, or argon.

Knudsen Hydrodynamics in Nanometer Intergranular Channels
Gas molecules traversing narrow cracks or un-sintered grain boundaries collide primarily with internal channel walls when the physical aperture dimensions drop below the mean free path. The molecular mean free path depends on gas dynamic viscosity, absolute temperature, total pressure, and molar mass:
lambda = frac{k_B cdot T}{sqrt{2} cdot pi cdot d_m^2 cdot P}
For nitrogen at atmospheric pressure and 298 Kelvin, the mean free path is approximately 67 nanometers. When a crack or void channel radius drops below 30 nanometers, transport sits firmly in the Knudsen regime. The Knudsen molar flux through a cylindrical capillary of radius and length under a pressure differential is expressed by:
J_{Knudsen} = frac{8}{3} cdot r cdot sqrt{frac{1}{2 pi cdot M cdot R cdot T}} cdot frac{Delta P}{L}
Temperature dependence in Knudsen flow follows an inverse square root relation, contrasting with the positive exponential Arrhenius kinetics of polymer permeation. Heating a cell with a Knudsen defect from 25 degrees Celsius to 60 degrees Celsius reduces Knudsen molar flux by roughly 5.4 percent because thermal agitation lowers net forward molecular velocity. This opposing thermal response provides an explicit diagnostic handle to separate material permeation from physical structural leaks.
| Transport Mechanism | Governing Equation | Molar Mass Selectivity | Temperature Scaling | Pressure Differential Scaling | Diagnostic Indicator |
|---|---|---|---|---|---|
| Polymer Permeation | Flux = (S D A dP) / x | Specific to solubility and diameter matrix | Positive exponential (Arrhenius Exp(-Ed/RT)) | Linear with partial pressure difference (dP) | He/Ar ratio > 15; steep exponential flux rise with temperature |
| Knudsen Channel Flow | Flux = (8/3) r sqrt(1/(2 pi M R T)) (dP/L) | Inverse square root of molar mass (1 / sqrt(M)) | Inverse square root (1 / sqrt(T)) | Linear with pressure difference (dP) | He/Ar ratio equals 3.16; slight flux reduction with heating |
| Viscous Continuum Flow | Flux = (pi r^4 P_avg dP) / (8 eta L R T) | Inverse with dynamic gas viscosity (1 / eta) | Inverse viscosity shift (T^0.5 to T^0.8) | Quadratic with pressure (P_avg dP) | He/Ar ratio near 1.08; strong pressure squared dependence |
| Surface Adsorption Desorption | Flux = d(Theta)/dt = k_des Theta | Dependent on adsorption enthalpy | Negative exponential desorption decay | Independent of external dP | Transient decay curve over time under constant vacuum |
Identifying which mass transport regime dominates an observed leak signature dictates the corrective action required on the cell assembly line. Structural flaws require mechanical process recalibration, whereas high permeation rates demand alternate polymer chemical formulations or metallic barrier coatings.
- Intergranular Grain Boundary Cracking occurs in sintered ceramic separators when excessive mechanical stack pressure drives dendrite growth, establishing Knudsen channels across the separator thickness.
- Pouch Laminate Polyolefin Pinholes arise from local thermal scorching during seal bar closure, producing localized voids that transition transport from solution-diffusion to viscous flow.
- Feedthrough Glass Seal Micro-fissures stem from mismatch in thermal expansion coefficients between glass preforms and metallic terminal tabs, generating sub-micron channels operating in Knudsen flow.
- Polymer Matrix Free-Volume Swelling results from organic vapor absorption during formation cycling, increasing diffusion coefficients and elevating broad-surface permeation rates.
- Thermal Expansion Interfacial Delamination emerges at the junction between inorganic solid electrolytes and polymer edge gaskets, opening high-aspect-ratio planar channels along the boundary.
At 25 degrees Celsius and 1 bar differential pressure, helium Knudsen flow through a 15 nanometer intergranular channel yields an argon selectivity ratio of exactly 3.16.
Differential pressure tracking and binary carrier gas ratios isolate transport mechanics across sealed seams. A cell packaging lot exceeding helium leak limits cannot be rejected solely on absolute flow rate without determining if the path is broad polymer diffusion or a pinpoint Knudsen flaw. Whether space-charge layers at solid electrolyte interfaces alter polar gas adsorption dwell times in sub-nanometer channels enough to shift ideal Knudsen scaling remains an open question.

Metrology
Quantifying gas evolution from solid-state cells requires instruments operating from atmospheric ambient down to high-vacuum mass spectrometry. Metrology strategies divide into total pressure accumulation and species-specific mass spectrometry. Pressure decay or vacuum rise methods give quick pass-fail screening on production lines, but cannot tell outgassed hydrogen sulfide or carbon dioxide from atmospheric nitrogen and water vapor drawn through test chamber leaks.
Residual Gas Analysis via quadrupole mass spectrometry resolves individual atomic mass units, tracking specific species in real time under controlled temperatures and pressures.
Mass spectrometry setups use high-vacuum sampling chambers backed by turbomolecular pumps that hold background pressures below 10^-8 mbar. Cells sit inside temperature-controlled stainless steel vacuum chambers with continuous capillary inlets. Quadrupole analyzers ionize gas molecules by electron impact and separate ions by mass-to-charge ratio.
This enables concurrent tracking of atomic mass unit 2 for hydrogen, 4 for helium, 18 for water vapor, 28 for carbon monoxide or nitrogen, 32 for oxygen, 34 for hydrogen sulfide, and 44 for carbon dioxide.
Establishing baseline chamber vacuum levels for at least two hours prior to cell insertion eliminates adsorbed atmospheric moisture from chamber walls. Failure to establish background baseline current produces false positive detections for hydrogen sulfide, as residual water vapor in the analyzer chamber reacts with trace sulfur deposits on the quadrupole ion source filament. Absolute quantitative calibration requires introducing certified gas standards through a micro-metering leak valve at operating pressure to establish sensitivity factors in amperes per mbar for each target gas species.

Differential Pressure Decay Methodologies versus Spectrometric Isolation
Total pressure monitoring tracks cumulative gas accumulation without identifying species. In differential pressure decay tests, a cell is placed in a reference-volume chamber pressurized or evacuated against a secondary reference cell while transducers record minute pressure shifts. Though sensitive to overall enclosure leaks, this method cannot separate internal electrolyte outgassing from external chamber seal relaxation, nor can it distinguish polymer permeation from Knudsen channel flow without species selectivity.
Spectrometric headspace isolation combines vacuum accumulation with gas chromatography or quadrupole mass spectrometry to track partial pressure accumulation. By introducing helium tracer gas into the cell jacket or testing under vacuum, mass spectrometry isolates target ion currents. Using a 50-50 helium-argon carrier gas mixture lets operators record both mass peaks simultaneously; applying instrumental sensitivity corrections to the ion current ratio gives the selectivity value needed to identify Knudsen defects versus polymer permeation.

Where Can Gas Chromatography Mass Spectrometry Fail in Headspace Analysis?
Thermally sensitive volatiles break down inside heated GC separation columns before reaching the detector. Sulfide solid electrolyte degradation forms reactive species like hydrogen sulfide, phosphorus pentasulfide, and organosulfur intermediates. Passing these compounds through columns above 150 degrees Celsius causes active breakdown, column phase stripping, and secondary decomposition ~ yielding chromatograms with phantom peaks absent from the ambient cell headspace.
Cold-trap sampling and direct capillary inlet quadrupole mass spectrometry avoid elevated column temperatures, preserving reactive headspace species for accurate quantification. Direct inlet systems employ pressure-reducing quartz orifices or heated inert metal capillaries operating under molecular flow conditions to transfer sample gas from ambient pressure enclosures directly into the high-vacuum analyzer without altering gas composition or inducing moisture condensation.
| Analytical Technology | Measurable Gas Species | Detection Limit (mbar L/s) | Pressure Range (mbar) | Primary Transport Mechanism Identified |
|---|---|---|---|---|
| Quadrupole Mass Spectrometry (QMS) | All species from 1 to 200 amu (H2, He, H2S, CO2) | 1 x 10^-12 | 1 x 10^-11 to 1 x 10^-4 | Knudsen flow, solution-diffusion, desorption kinetics |
| Differential Pressure Decay | Total pressure change only (non-specific) | 1 x 10^-5 | 1 x 10^-3 to 2 x 10^3 | Gross continuum leaks and large viscous channels |
| Helium Sniffer Mass Spectrometry | Helium tracer gas specifically (4 amu) | 1 x 10^-7 | 1 x 10^-1 to 1 x 10^3 | Localized pinhole defects and physical seam leaks |
| FTIR Headspace Spectroscopy | Heteronuclear polar molecules (CO2, H2S, HF, organics) | 1 x 10^-6 | 10 to 1 x 10^3 | Chemical outgassing species identification |
| Methods Note: Detection limits established at 298 Kelvin using standard 100 cubic centimeter accumulation volumes with 600-second accumulation times. | ||||
Metrology selection dictates whether an engineering team uncovers root-cause transport mechanics or merely collects uncalibrated pressure drift data. Implementing species-specific mass spectrometry ensures full visibility into packaging barrier degradation.
- Quadrupole Mass Spectrometer Resolution must achieve unit mass separation across the 1 to 100 amu scale to resolve toxic hydrogen sulfide at 34 amu from elemental sulfur fragments and siloxane background peaks.
- Chamber Background Degassing Rate must remain below 1 x 10^-10 mbar L s^-1 after extended bake-out to prevent chamber wall water desorption from obscuring low-level cell permeation.
- Accumulation Volume Calibration Precision requires certified reference volumes verified to within 0.1 percent uncertainty to allow conversion of ion current rise rates into absolute molar outgassing flux.
- Carrier Gas Purity Specifications demand research-grade 99.9999 percent pure helium and argon to prevent trace atmospheric contamination from corrupting gas selectivity ratios.
When outgassing rate scales inversely with the square root of gas molecular weight, channel flow dominates dense polymer solution diffusion.
Analyzing partial pressure accumulation isolates volatile decomposition products from ambient background gases. When measured helium flux stays flat during thermal ramping while gas selectivity tracks molecular mass ratios, structural channel defects ~ not polymer permeation ~ govern enclosure leak behavior.

Calculus
Determining whether a measured leak rate poses an operational hazard requires modeling transport dynamics under actual service conditions. Take a 10 Ah pouch solid-state battery with a sulfide electrolyte (lithium phosphorus sulfur chloride, Li6PS5Cl). The cell sits inside a hermetic module housing with 250 cubic centimeters of free volume filled with dry nitrogen at 1.0 bar and 298.15 Kelvin.
Safety rules require that toxic hydrogen sulfide from electrolyte breakdown or water ingress stays below 10 parts per million by volume (a partial pressure limit of 1.0 x 10^-2 mbar) over a 10-year operating life to prevent terminal corrosion and exposure risks.
Two distinct leakage scenarios apply to this module. Scenario A evaluates a cell packaging seam failure involving a 50 nanometer diameter cylindrical crack traversing a 1.0 millimeter thick glass-to-metal feedthrough header. Scenario B evaluates uniform polymer solution-diffusion permeation across a polyolefin edge seal with an effective area of 12 square centimeters and a seal path length of 5.0 millimeters under ambient atmospheric moisture exposure (50 percent relative humidity at 25 degrees Celsius, corresponding to a water vapor partial pressure of 15.8 mbar).
Derivation of Environmental Leak Limits for Sulfide Pouch Cells
A ten ampere-hour solid-state cell employing lithium phosphorus sulfur chloride electrolyte contains sufficient volatile sulfur species to generate toxic gas upon atmospheric moisture contact. In Scenario A, establishing the transport regime inside the 50 nanometer crack begins by calculating the molecular mean free path of hydrogen sulfide at 298.15 Kelvin and 1.0 bar total pressure. Using a kinetic diameter of 0.36 nanometers for hydrogen sulfide:
lambda = frac{(1.3806 times 10^{-23} text{ J/K}) cdot (298.15 text{ K})}{sqrt{2} cdot pi cdot (0.36 times 10^{-9} text{ m})^2 cdot (1.01325 times 10^5 text{ Pa})} approx 7.15 times 10^{-8} text{ m} = 71.5 text{ nm}
The Knudsen number equals the mean free path divided by the channel diameter:
Kn = frac{71.5 text{ nm}}{50 text{ nm}} = 1.43
Because the Knudsen number exceeds 1.0, gas transport operates within the Knudsen flow regime. The molar flux of hydrogen sulfide outgassing through this single micro-channel under a differential partial pressure of 1.0 bar (1.0 x 10^5 Pa) is calculated using the Knudsen capillary equation with a molar mass of 0.03408 kilograms per mole for hydrogen sulfide:
J_{Kn} = frac{8}{3} cdot (25 times 10^{-9} text{ m}) cdot sqrt{frac{1}{2 pi cdot (0.03408 text{ kg/mol}) cdot (8.314 text{ J/mol K}) cdot (298.15 text{ K})}} cdot frac{1.0 times 10^5 text{ Pa}}{1.0 times 10^{-3} text{ m}}
Calculating the square root factor yields:
sqrt{frac{1}{2 pi cdot 0.03408 cdot 8.314 cdot 298.15}} = sqrt{frac{1}{530.15}} = 0.04343 text{ mol sec/kg m}
Substituting into the Knudsen flux expression gives a molar flux per unit channel area of 2.895 x 10^-4 moles per square meter per second. Multiplying by the cross-sectional area of the 50 nanometer channel (1.963 x 10^-15 square meters) yields the absolute molar leak rate:
n_{Kn} = (2.895 times 10^{-4} text{ mol/m}^2 text{s}) cdot (1.963 times 10^{-15} text{ m}^2) = 5.68 times 10^{-19} text{ mol/s}
Expressed in volumetric leak rate units at standard temperature and pressure (mbar L s^-1), this single 50 nanometer channel yields a hydrogen sulfide leak rate of 1.41 x 10^-14 mbar L s^-1. However, if micro-cracking during assembly produces an array of 10,000 such intergranular parallel channels across the ceramic seal interface, the cumulative leak rate scales to 1.41 x 10^-10 mbar L s^-1.
In Scenario B, the water vapor permeation rate through the polyolefin heat seal governs influx into the cell. Polyolefin inner sealants exhibit a water vapor permeability coefficient of approximately 1.5 x 10^-13 cm^3 (STP) cm / (cm^2 s cmHg). Under an ambient water vapor partial pressure of 15.8 mbar (1.185 cmHg), a seal area of 12 square centimeters, and a path length of 0.5 centimeters, the steady-state water ingress flux equals:
Q_{H2O} = frac{(1.5 times 10^{-13}) cdot (12 text{ cm}^2) cdot (1.185 text{ cmHg})}{0.5 text{ cm}} = 4.266 times 10^{-13} text{ cm}^3 text{(STP)/s} = 4.266 times 10^{-13} text{ mbar L s}^{-1}
Each mole of water entering the cell reacts rapidly with the sulfide solid electrolyte to generate one mole of hydrogen sulfide gas. Comparing Scenario A (10,000 Knudsen micro-channels) against Scenario B (polymer seal water permeation):
Accumulation of hydrogen sulfide gas over a 10-year service lifespan (3.1536 x 10^8 seconds) in the 250 cubic centimeter module headspace proceeds as follows:
For Scenario A (Knudsen channel array at 1.41 x 10^-10 mbar L s^-1): Total accumulated gas volume equals 0.0444 mbar L. Dividing by the headspace volume of 0.250 liters yields a partial pressure of hydrogen sulfide of 0.177 mbar (177 ppm by volume). This exceeds the 10 ppm safety threshold by a factor of 17.7, reaching the unsafe threshold in just 20.6 months of operation.
For Scenario B (Polymer seal permeation at 4.266 x 10^-13 mbar L s^-1): Total accumulated gas volume equals 1.345 x 10^-4 mbar L. Dividing by 0.250 liters yields a partial pressure of 5.38 x 10^-4 mbar (0.538 ppm by volume). This remains comfortably below the 10 ppm safety threshold over the full 10-year operating lifetime.
| Mass Transport Mode | Channel / Seal Dimension | Leak Rate (mbar L/s) | 1-Year Accumulation (mbar) | Time to 10 ppm Threshold (Hours) | Primary Hazard Mode |
|---|---|---|---|---|---|
| Single Knudsen Crack (50 nm) | Radius 25 nm, Length 1 mm | 1.41 x 10^-14 | 1.78 x 10^-5 | 4,930,000 | Negligible localized outgassing |
| Knudsen Crack Array (10,000 cracks) | Radius 25 nm, Length 1 mm | 1.41 x 10^-10 | 0.178 | 493 | Rapid toxic H2S buildup, connector corrosion |
| Viscous Defect Channel (5 micron) | Radius 2.5 micron, Length 1 mm | 8.85 x 10^-5 | 111.7 | 0.78 | Immediate atmospheric moisture reaction vent |
| Polyolefin Heat Seal Permeation | Area 12 cm^2, Thickness 5 mm | 4.27 x 10^-13 | 5.38 x 10^-4 | 163,000 | Slow baseline electrolyte degradation |
Standard differential pressure checks miss low-level Knudsen defect arrays that cause severe gas accumulation over extended storage periods.

Lifetime Pressure Accumulation in Sealed Enclosure Modules
Multi-cell battery packs housed within hermetic IP67 or IP69K aluminum enclosures collect all offgassed volatile products over decade-long operation. The operational lifespan of the pack depends on preventing cumulative internal pressure from exceeding structural enclosure deformation limits while maintaining toxic species concentrations below regulatory safety ceilings. Calibrating quadrupole mass spectrometry baseline sweeps requires a strict procedural sequence to ensure measured outgassing rates reflect true cell performance rather than instrument background drift.
- Evacuate the stainless steel accumulation chamber to a base pressure below 10^-8 mbar using a turbomolecular pumping station.
- Bake out the chamber walls at 150 degrees Celsius for 12 hours to desorb surface-bound water and atmospheric hydrocarbons.
- Isolate the chamber from vacuum pumps and monitor total pressure rise for 4 hours to verify system background outgassing remains below 5 x 10^-11 mbar L s^-1.
- Introduce pure helium gas at 1 bar differential pressure into the cell enclosure jacket while recording quadrupole mass spectrometer ion currents at atomic mass units 2, 4, 18, 28, 32, and 34.
- Derive the quantitative leak rate by multiplying the measured mass peak ion current by the pre-calibrated sensitivity factor obtained from a certified helium reference leak standard.
UN 38.3 test summaries lacking explicit differential pressure gas composition data expose freight forwarders to strict liability under ICAO Technical Instructions.
Failing to differentiate Knudsen channel flow from polymer permeation during cell qualification leads integrators to select improper enclosure ventilation schemes, resulting in unexpected toxic gas accumulation during long-term ocean transit and catastrophic customs port impoundment.

Clause
Cell procurement contracts and international shipping rules turn physical outgassing metrics into explicit legal duties. Solid-state cells containing residual solvents or reactive sulfides fall under UN 3480 (Lithium ion batteries) or UN 3536 (Lithium batteries in cargo transport units) classifications. Regulated under the UN Manual of Tests and Criteria, Part III, subsection 38.3, these frameworks apply severe mechanical, thermal, and physical stresses to evaluate packaging hermeticity in transit.
UN 38.3 Test T.1 (Altitude Simulation) holds charged cells at 11.6 kPa or less for six hours at ambient temperature, producing a differential pressure over 0.89 bar across the package. If micro-channels exist, this pressure gradient accelerates offgassing into the cargo hold. Any cell losing over 0.1 percent mass during Test T.1 fails certification, barring air transport under ICAO Technical Instructions and IATA Packing Instruction PI 965.
The EU Battery Regulation (Regulation EU 2023/1542) expands compliance duties, requiring manufacturers and importers to assemble technical dossiers covering safety, performance, and durability before selling cells in Europe. Article 6 requires documentation showing gas evolution stays within certified limits during normal use and abuse conditions for stationary storage and industrial batteries. Importers of record must retain files with species-specific outgassing profiles and mass spectrometry certificates for ten years.
International Dangerous Goods Shipping Rules and Thermal Offgassing Limits
UN 38.3 safety testing subjects battery packages to altitude simulation, thermal cycling, vibration, and short-circuit testing. Test T.2 (Thermal Test) holds cells at 72 degrees Celsius for 12 hours, then -40 degrees Celsius for 12 hours, across 10 continuous cycles. In cells with hybrid polymer-ceramic seals, this temperature swing induces differential thermal expansion at boundaries, creating micro-fissures that turn slow polymer permeation into rapid Knudsen leakage.
Maritime carriage under the International Maritime Dangerous Goods (IMDG) Code requires freight forwarders to verify that solid-state battery modules shipped in sealed container units do not evolve hazardous gaseous atmospheres. Sulfide-based solid-state batteries shipped under Special Provision 384 must undergo incoming lot leak verification demonstrating that hydrogen sulfide emission rates remain below 1 x 10^-8 mbar L s^-1 per kilowatt-hour of storage capacity under 95 percent relative humidity storage conditions.

Contractual Allocation of Non-Compliance Liabilities in Cell Procurement
Supply contracts between manufacturers and integrators establish strict incoming quality limits for seal integrity. Where traditional battery warranties focused on capacity retention and impedance growth, solid-state contracts define explicit hermeticity thresholds in helium-equivalent leak rates at factory dispatch. Quality agreements apply ISO 2859-1 Acceptable Quality Level (AQL) sampling protocols with zero tolerance for critical seal defects.
When an incoming lot fails mass spectrometry leak screening at the integrator’s dock, landed-cost liabilities shift based on contract terms. Landed costs cover international freight, customs duties, demurrage, quarantine storage, and disposal fees if reactive outgassing prevents road transit. Comprehensive risk allocation requires explicit clauses in the master purchasing agreement.
Section 14.3 of international cell supply agreements specifies that gas leakage rates exceeding 1 x 10^-7 mbar L s^-1 during incoming lot sampling trigger immediate shipment rejection and shift all port storage, re-inspection, and return freight costs to the cell manufacturer.