Analytical Verification Protocols for Recycled Cathode Precursor Powder Quality Control
Analytical verification of recycled pCAM requires rigorous laser diffraction, ICP trace impurity screening, and bench-scale calcination half-cell testing.
Dust
Incoming shipments of black mass derivatives arrive at processing plants as dense, hygroscopic precursor powders destined for re-synthesis into cathode active materials. Physical verification of these nickel-manganese-cobalt hydroxides or carbonates marks the boundary line between battery-grade precursor material and off-spec recycling residue. Particle size distribution metrics dictate packing density during slurry mixing, calendering behavior on current collectors, and solid-state diffusion paths during thermal calcination.
Deviations in particle morphology or particle size spread force immediate adjustments to binder ratios and solvent volumes on downstream coating lines.
Particle Size Distribution Metrics and Span Control
Evaluating recycled nickel-manganese-cobalt precursor batches relies on dry laser diffraction as a baseline measurement. Technicians record tenth percentile D10, median D50, ninetieth percentile D90, and ninety-ninth percentile D99 diameters under controlled dispersion pressures ranging from 0.5 to 3.0 bar. Pressure titrations separate loose agglomerates from hard primary crystallites.
Powder that fractures under a 1.5 bar dispersion pressure contains weakly bound agglomerates that will break down during high-shear slurry mixing, shifting viscosity unexpectedly.
The dimensionless span value, calculated as D90 minus D10 divided by D50, defines distribution width. Tight span control prevents preferential settling during wet storage and maintains uniform packing density. For high-nickel precursors like nickel-manganese-cobalt 811 hydroxide, buyers specify a D50 target between 9.5 and 10.5 micrometers with a strict upper span limit of 0.85.
A broad distribution carrying a tail of fine particles under 2.0 micrometers increases local surface area, driving up solvent demand during cathode paste mixing and causing binder migration during electrode drying.
A precursor batch exhibiting a D50 shift beyond 0.8 micrometers under dry dispersion laser diffraction triggers slurry viscosity spikes exceeding 4500 millipascal-seconds during cathode compounding.
Pneumatic transfer systems in recycling facilities frequently break fragile precursor spheres. Fine particles generated by attrition clog filtration screens and skew tap density measurements. Sampling protocols require taking powder specimens directly from sealed drum cores using multi-zone thief samplers before bulk pneumatic unloading occurs.

Tap Density and BET Surface Area Correlations
Volumetric packing performance dictates how much active material occupies a given volume inside a finished electrode coating. Tap density testing follows standard protocols using 250 milliliter graduated cylinders subjected to 1250 taps under automated mechanical actuators. Recycled precursor hydroxides demand tap densities equal to or exceeding 2.0 grams per cubic centimeter for standard compositions and 2.15 grams per cubic centimeter for spherical high-density grades.
Brunauer-Emmett-Teller nitrogen adsorption gas physisorption measures the specific surface area of primary spherical aggregates. Gas absorption curves collected at relative pressures between 0.05 and 0.30 P over P-zero yield specific surface areas typically between 5.0 and 12.0 square meters per gram for spherical hydroxide precursors. Higher surface area values indicate internal porosity or loose surface flake formation, both of which correlate with poor tap density and excess lithium consumption during high-temperature calcination re-synthesis.
| Precursor Parameter | NMC 622 Hydroxide | NMC 811 Hydroxide | LFP Carbonate pCAM | Test Standard |
|---|---|---|---|---|
| D50 Median Diameter (µm) | 10.0 ± 0.5 | 9.8 ± 0.4 | 4.5 ± 0.3 | ISO 13320 |
| Distribution Span ((D90-D10)/D50) | ≤ 0.90 | ≤ 0.80 | ≤ 1.10 | ISO 13320 |
| Tap Density (g/cm³) | ≥ 2.05 | ≥ 2.15 | ≥ 1.30 | ASTM B527 |
| BET Surface Area (m²/g) | 6.0 to 10.0 | 5.0 to 8.5 | 12.0 to 18.0 | ISO 9277 |
| Karl Fischer Moisture (ppm) | ≤ 3000 | ≤ 2000 | ≤ 5000 | ASTM E1064 |
Physical anomalies in recycled precursor powders directly disrupt manufacturing steps downstream.
- Agglomerate Fracturing ~ Granules collapse during pneumatic transfer, shifting the fine fraction high and clogging co-precipitation seed filters downstream.
- Bimodal Size Shift ~ Secondary nucleation creates a secondary peak near 1.5 micrometers, reducing packing density inside the calendering press.
- Hygroscopic Surface Hydration ~ Exposure to ambient humidity above 30 percent creates surface hydroxide bridges, causing powder bridging in feed hoppers.
- Morphological Hollow Centers ~ Internal pores formed during rapid recycled salt precipitation collapse under electrode rolling pressure, causing particle cracking.

Moisture Uptake during Bulk Powder Transit
Water content inside precursor packaging alters chemical stoichiometry and induces surface reaction degradation. Coulometric Karl Fischer titration performed at an oven evaporation temperature of 170 degrees Celsius determines both adsorbed surface moisture and weakly bound hydration water. Recycled hydroxides shipped in ocean containers absorb atmospheric moisture rapidly if inner polyethylene liners suffer micro-bores or inadequate heat seals during loading.
Adsorbed water reacts with residual atmospheric carbon dioxide to form surface nickel-manganese carbonate layers. These carbonate skins do not decompose completely during standard low-temperature drying stages, leaving localized carbon contamination in calcined cathode crystals. Powder moisture levels exceeding 3000 parts per million force processors to introduce energy-intensive vacuum drying cycles prior to lithium salt blending, adding direct operational cost to the re-synthesis process.
Powders exhibiting asymmetric particle size distributions consistently produce uneven cathode coatings regardless of mixer shear energy.

Assay
Chemical composition determines the thermodynamic ceiling and crystal structure stability of re-synthesized cathode materials. Recycled precursor shipments originate from hydrometallurgical leaching and solvent extraction loops where separation efficiencies vary across production batches. Verification mandates quantifying transition metal ratios along with residual alkali metals, heavy metals, and non-metallic contaminants down to single-digit parts per million thresholds.
A deviation of 0.5 molar percent in nickel ratio alters the phase transition boundaries of the calcined active material during high-voltage cell operation.
Inductively Coupled Plasma Mass Spectrometry Sample Digestion
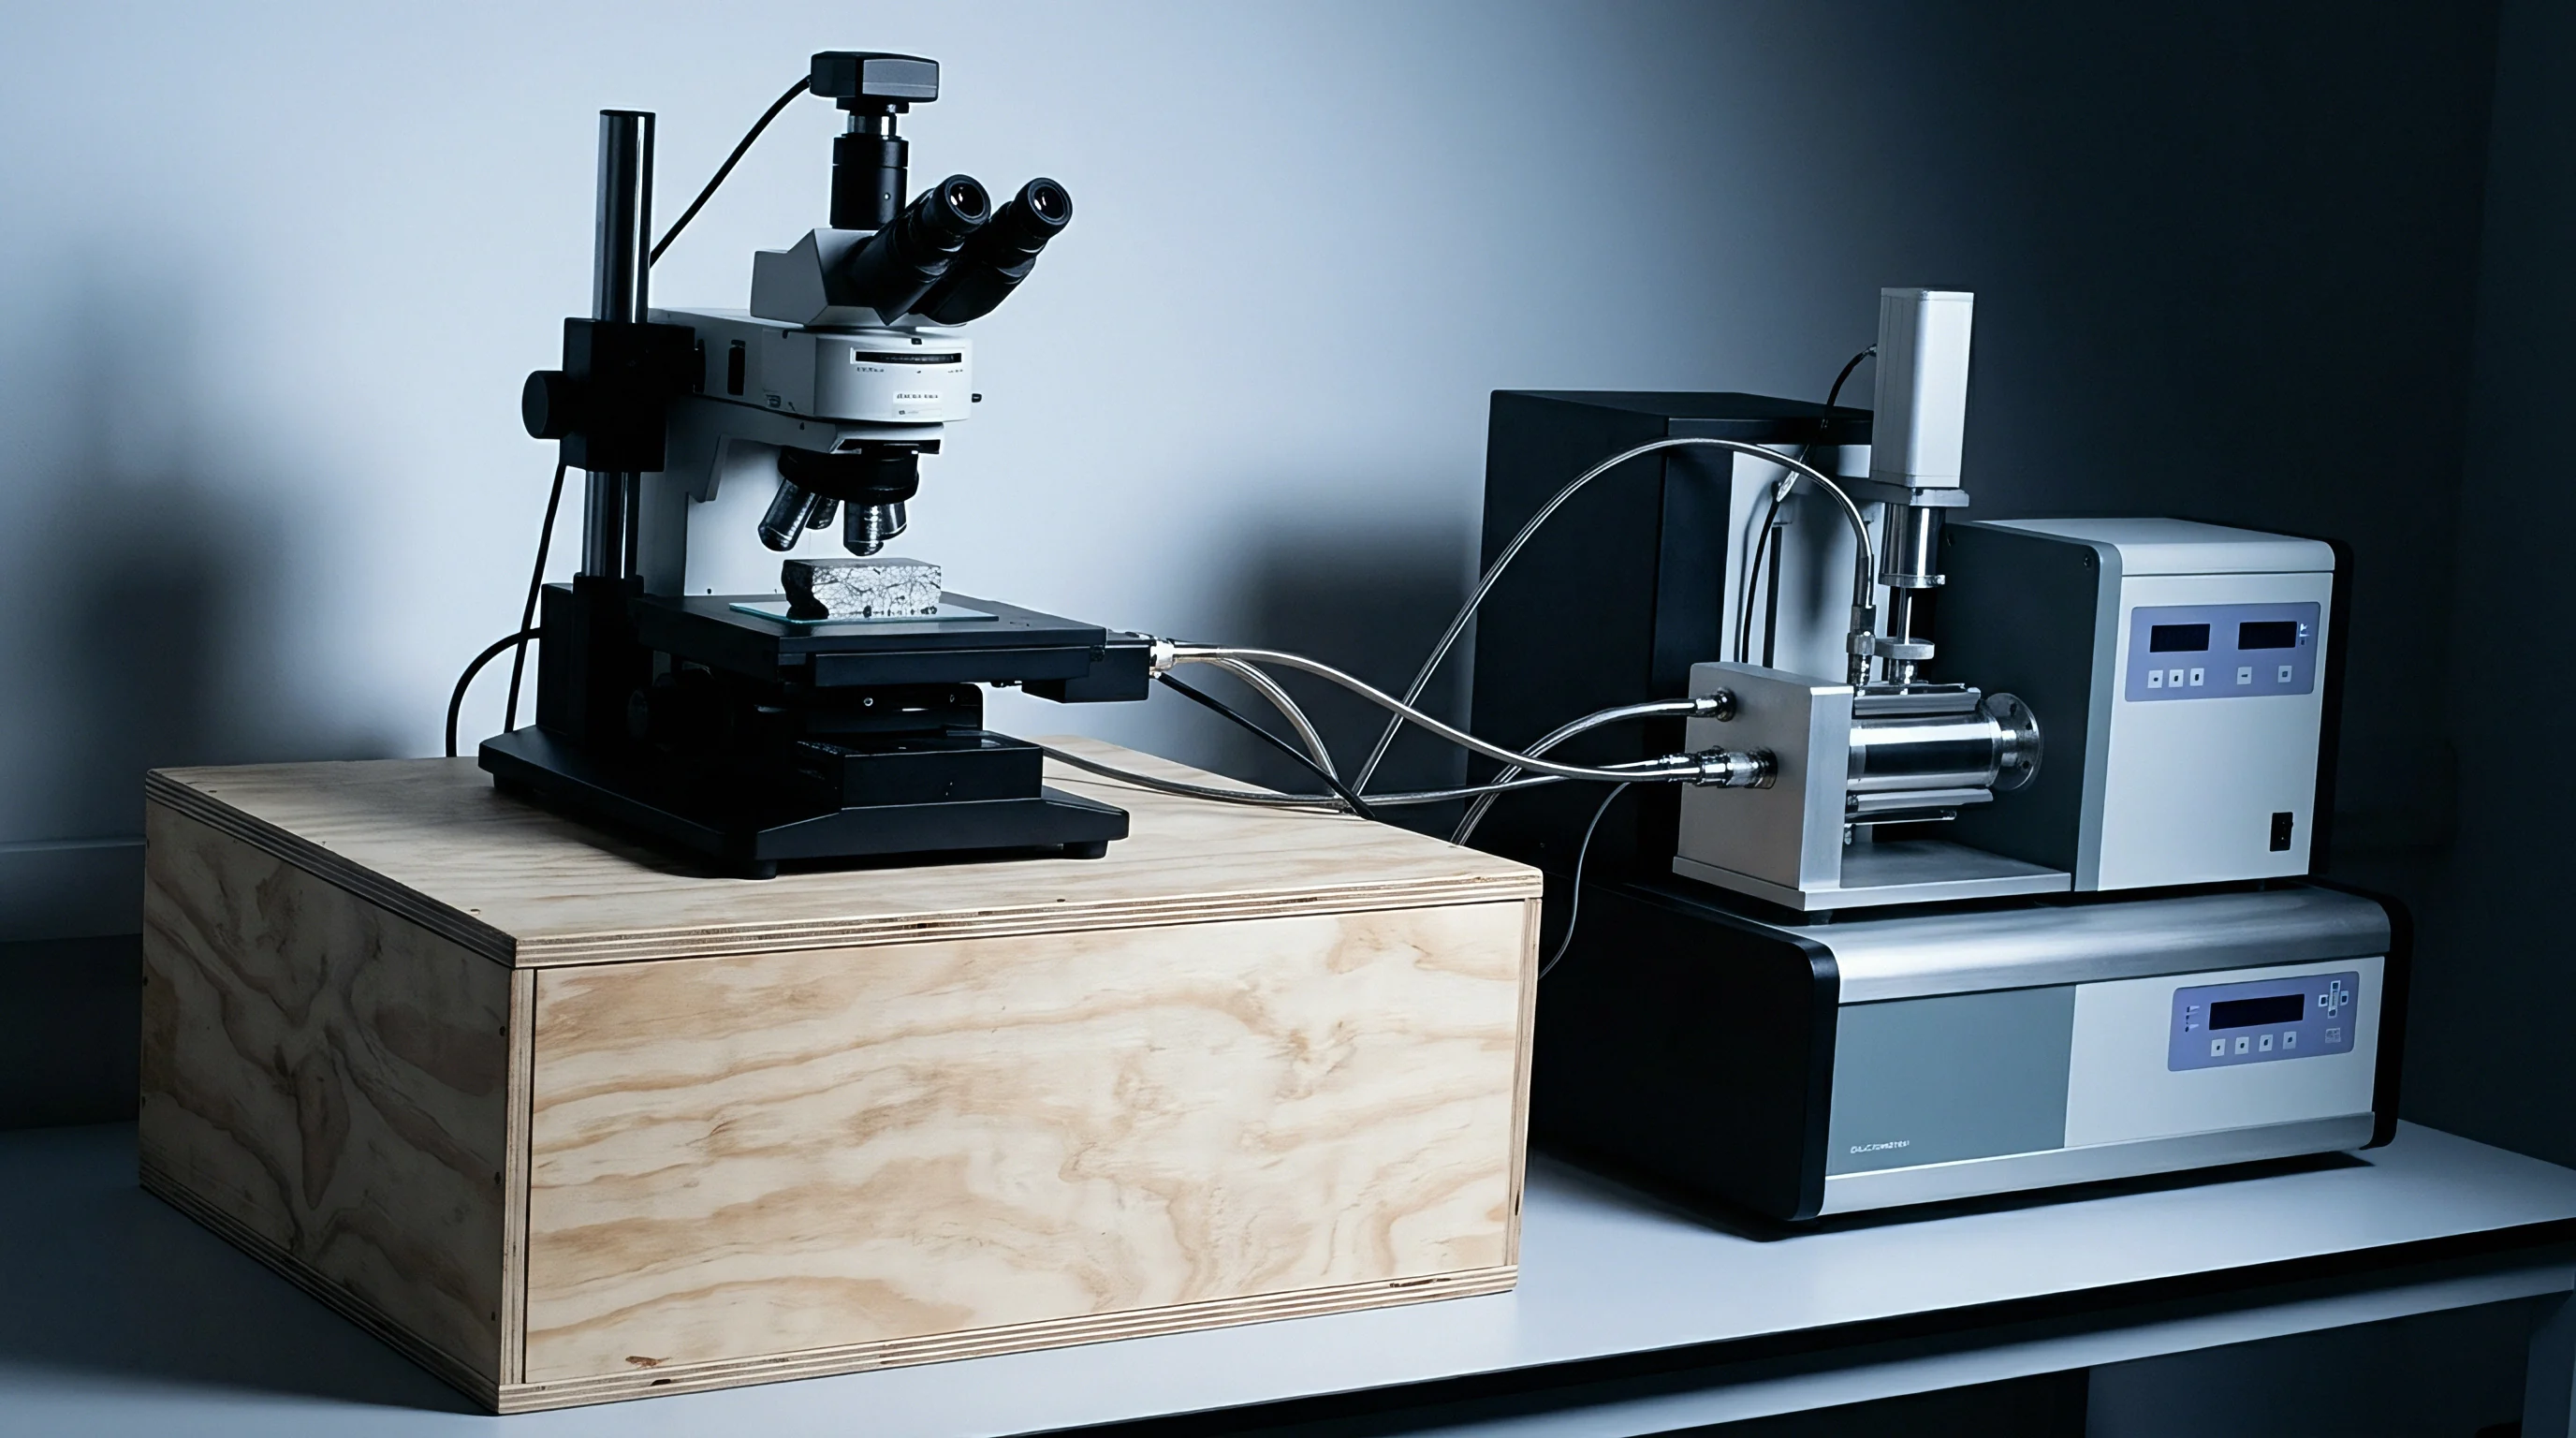
Precise elemental analysis hinges on complete, reproducible sample dissolution. Transition metal hydroxide and carbonate powders resist mild acid attacks, requiring aggressive microwave-assisted digestion protocols. Technicians weigh 0.2500 grams of dried precursor powder into fluoropolymer digestion vessels, adding six milliliters of concentrated hydrochloric acid, two milliliters of concentrated nitric acid, and one milliliter of trace-metal grade hydrofluoric acid.
Microwave heating ramps the mixture to 210 degrees Celsius over twenty minutes, holding peak pressure for twenty-five minutes to achieve total matrix dissolution without forming insoluble metal fluoride precipitates.
Diluted digestion solutions enter inductively coupled plasma optical emission spectrometers for major transition metal determinations. Inductively coupled plasma mass spectrometry handles trace impurity quantification where detection limits below 10 parts per billion are mandatory. Matrix-matched calibration standards prepared with high-purity single-element stock solutions compensate for ionization suppression caused by dense nickel or iron background matrices.
Interferences from polyatomic ions present continuous analytical challenges. Argon oxide ion clusters overlap chromium isotopes at mass-to-charge ratio 52, while argon polyatomic species interfere with iron detection at mass 56. Quadrupole collision-reaction cells pressurized with helium gas attenuate these polyatomic species via kinetic energy discrimination, allowing accurate detection of trace iron contaminants in recycled battery stocks.

Transition Metal Stoichiometry Deviations and Battery Life
Precursor pricing scales directly with nickel and cobalt metal content. Buyers calculate the exact molar ratios of nickel, manganese, and cobalt from elemental weight percentages to ensure compliance with intended cathode formulations such as NMC 622, 712, or 811. Small shifts in metal balance disrupt the target crystal lattice after lithium blending.
Excess manganese in an intended NMC 811 precursor lowers specific capacity by forming electrochemically inactive manganese-rich domains. Conversely, excess nickel elevates specific initial capacity but accelerates capacity fade if the nickel fraction surpasses 83 molar percent without proportional manganese stabilization. The atomic ratio of total transition metals to hydroxide or carbonate ligands must land within 0.005 of theoretical stoichiometry to ensure stoichiometric lithium incorporation during downstream solid-state reaction steps.
Statistical process control charts track molar ratio variations across consecutive delivery lots. If the standard deviation of the nickel-to-cobalt molar ratio across five shipments exceeds 0.003, the refiner’s solvent extraction separation circuit is experiencing organic phase degradation or hydraulic channeling. Sourcing engineers flag such lots for re-assay before authorizing kiln calcination runs.

Trace Contaminant Limits and Electrochemical Interferences
Recycled battery materials carry legacy contaminants inherited from black mass feeds, shredder debris, and hydrometallurgical reagents. Iron, copper, zinc, sodium, calcium, magnesium, aluminum, silicon, and sulfur represent the critical impurity suite monitored during incoming inspection.
Metallic iron and copper particles act as internal short-circuit vectors. During cell formation and high-voltage charging, iron and copper dissolve into the liquid electrolyte as divalent ions, migrating across the separator to deposit as metallic dendrites on the graphite anode. This deposition bridges the separator membranes, causing self-discharge, micro-shorts, or catastrophic thermal failure.
Recycled precursor specs cap total copper and iron concentrations at 10 parts per million each.
Contracts referencing ISO 11885 chemical testing enforce automatic lot rejection whenever sodium residue exceeds 150 parts per million in recycled nickel-cobalt hydroxide precursor.
Sodium and calcium ions introduce structural defects into cathode crystals. Residual sodium hydroxide or sodium sulfate carried over from hydrometallurgical precipitation steps occupies lithium site vacancies during calcination. Because sodium ions possess a significantly larger ionic radius than lithium ions, sodium entrapment blocks lithium diffusion pathways within the layered crystal lattice, driving up charge-transfer resistance and reducing rate capability.
Calcium forms insoluble calcium sulfate precipitates that block surface pores and degrade long-term cycle life.
| Element | Detection Limit (ppm) | Primary Failure Mechanism | Maximum Limit (ppm) |
|---|---|---|---|
| Iron (Fe) | 0.1 | Anode dendrite growth, internal short circuits | 10.0 |
| Copper (Cu) | 0.1 | Separator breakdown, self-discharge acceleration | 5.0 |
| Zinc (Zn) | 0.5 | SEI destabilization, capacity loss | 10.0 |
| Sodium (Na) | 1.0 | Lithium channel blockage, resistance growth | 150.0 |
| Sulfur (S) | 5.0 | Gas evolution, gas bag swelling in pouch cells | 800.0 |
| Silicon (Si) | 2.0 | Surface phase breakdown, slurry gelling | 50.0 |
Uncontrolled sulfur content in precursor hydroxides stems from incomplete washing of nickel sulfate and cobalt sulfate precipitation liquors. Residual sulfate ions decompose into sulfur dioxide gas during high-temperature calcination, damaging kiln exhaust refractory linings and leaving residual lithium sulfate salts at particle grain boundaries. High grain boundary sulfate concentrations cause cell swelling during high-temperature storage tests at 60 degrees Celsius.
Residual sodium sulfate content below two thousand parts per million is sometimes treated as benign on the assumption that downstream calcination washing steps strip the remaining alkali salts.
Phase
X-ray diffraction analysis identifies the crystal lattice symmetry and structural purity of precipitation products before high-temperature thermal treatment. Recycled precursor hydroxides should idealize the hexagonal beta-nickel hydroxide structure carrying P-3m1 space group symmetry. Sub-optimal co-precipitation conditions generate disordered alpha-nickel hydroxide phases, amorphous basic metal sulfates, or mixed oxide impurity phases that alter thermal decomposition dynamics during kiln calcination.

X-Ray Diffraction Peak Profiles and Rietveld Refinement
Rigorous phase qualification uses laboratory powder X-ray diffractometers equipped with copper K-alpha radiation sources and high-speed strip detectors. Scans cover two-theta angles from 10 to 80 degrees with a step size of 0.01 degrees. Laboratory technicians evaluate peak position, peak intensity, and full-width at half-maximum values across characterization reflections including the (001), (100), (101), and (110) crystallographic planes.
Rietveld refinement software fits measured diffraction patterns against structural model databases. The ratio of the integrated intensity of the (001) reflection to the (101) reflection indicates structural order within hydroxide layers. A sharp, symmetric (001) peak centered near 19.2 degrees two-theta confirms a well-crystallized beta-phase hydroxide matrix.
Asymmetric broadening of the (001) reflection accompanied by shifts toward lower two-theta angles signals turbostratic disorder or nitrate and sulfate anion intercalation between brucite-like layer structures.
Phase-pure precursor materials yield predictable thermal breakdown profiles. Mixed-phase precursors undergo step-wise weight loss transitions at inconsistent temperatures, complicating heat balance control in multi-zone calcination kilns.
Crystallite Size Variance and Sintering Kinetics
Peak broadening analysis yields the average crystallite domain size via the Scherrer equation or Williamson-Hall strain analysis plots. Crystallite size directly influences solid-state reactivity when precursor powders mix with lithium hydroxide monohydrate or lithium carbonate. Recycled precursors exhibiting primary crystallite sizes between 15 and 35 nanometers provide short lithium ion diffusion distances, facilitating complete lithiation during calcination at 750 degrees Celsius.
Recycled batches containing large crystallites exceeding 60 nanometers resist complete lithium penetration during standard kiln residence times. Unreacted core regions remain inside precursor particles, leading to local transition metal phase segregation and poor discharge capacity in assembled cells. Conversely, ultra-fine crystallites under 10 nanometers undergo premature surface sintering during early heating stages, trapping volatile moisture inside secondary particles and causing particle bursting.
Standardized phase verification follows an established sequence.
- Transfer two grams of dry precursor powder into a zero-background quartz sample holder, smoothing the surface with a glass slide to minimize preferred orientation artifacts.
- Scan from 10 to 80 degrees two-theta using copper K-alpha radiation at a step size of 0.01 degrees and a dwell time of 2 seconds per step.
- Perform background subtraction and peak fitting using pseudo-Voigt profiles to isolate instrumental line broadening from crystallite size broadening.
- Run Rietveld refinement against the standard beta-nickel hydroxide reference pattern to calculate lattice parameters and quantitative phase fractions.
- Reject the raw material lot if secondary oxide reflections exceed 0.5 weight percent of the total diffracted intensity.
Whether internal crystallite lattice strain in recycled precursors directly accelerates intergranular cracking during long-term cycling remains an open question across commercial testing facilities.
Surface
Spectroscopic probes targeting the outermost atomic layers of recycled particles reveal residual processing reagents and atmospheric degradation. Recycled nickel-manganese-cobalt hydroxides adsorb ambient carbon dioxide rapidly, transforming surface hydroxide layers into insoluble metal carbonates. Surface chemistry controls slurry rheology, binder adsorption, and inter-particle friction during electrode pressing.

X-Ray Photoelectron Spectroscopy of Residual Sulfates
X-ray photoelectron spectroscopy probing the top two to five nanometers of precursor particles quantifies surface contamination species missed by bulk digestion methods. Monochromated aluminum K-alpha X-ray sources irradiate powder samples under ultra-high vacuum conditions below 10-to-the-minus-8 millibar. High-resolution spectra captured at the sulfur 2p, carbon 1s, oxygen 1s, and sodium 1s binding energy regions identify chemical oxidation states.
Sulfur 2p binding energy peaks located at 168.5 electron volts correspond to surface-bound sulfate ions resulting from incomplete hydrometallurgical washing. High surface sulfate signals correlate with severe slurry gelling when precursor powders mix with N-methyl-2-pyrrolidone and polyvinylidene fluoride binders. The acidic surface nature of sulfate-contaminated precursors promotes premature binder cross-linking, causing rapid viscosity increases that render slurry unpumpable through slot-die coating heads.
Carbon 1s peak deconvolution separates adventitious aliphatic carbon at 284.8 electron volts from carbonate carbon at 289.5 electron volts. Recycled precursor lots stored in unpurged ambient silos accumulate surface carbonate layers up to four nanometers thick. These carbonate skins require higher calcination temperatures to break down, driving grain growth beyond target limits.

Thermogravimetric Mass Loss and Hydration States
Thermogravimetric analysis coupled with differential thermal analysis tracks phase transformation steps and volatile species loss as precursor powders undergo heating under controlled atmospheres. Technicians load 20 milligrams of precursor into alumina crucibles, heating from 25 to 900 degrees Celsius at a ramp rate of 10 degrees per minute under a continuous synthetic air purge of 50 milliliters per minute.
The resulting mass loss curve exhibits three distinct temperature regimes. Mass loss occurring between 25 and 150 degrees Celsius reflects the desorption of physisorbed surface water. The second mass loss step between 150 and 320 degrees Celsius corresponds to the structural dehydroxylation of metal hydroxides into transition metal oxides, accompanied by water vapor release.
Mass loss above 600 degrees Celsius indicates the decomposition of trace residual sulfates or carbonates into gaseous sulfur oxides and carbon dioxide.
Pneumatic transport systems utilizing ambient air drive rapid surface carbonation on active precursor particles, degrading slurry mixing consistency within hours.
Excessive mass loss in the first regime indicates inadequate drying prior to packaging. Deviations in the second mass loss regime point to non-stoichiometric hydroxide-to-oxide ratios, signaling incomplete precipitation reactions during hydrometallurgical synthesis.
Is Magnetic Impurity Extraction Necessary for Recycled pCAM?
Ferromagnetic contaminants originating from recycled battery shredding machinery, conveyer wear, or stainless steel piping pose immediate safety hazards. Free metallic iron, nickel, or stainless steel particles down to 10-micrometer dimensions pass through standard receiving mesh screens. High-gradient magnetic separators operating at flux densities exceeding 1.2 Tesla are necessary to pull magnetic particles out of dry precursor powder streams prior to calcination.
Verification protocols run powder samples through analytical high-gradient magnetic traps, followed by acid digestion of captured magnetic fractions. Inductively coupled plasma spectroscopy quantifies iron, chromium, and nickel content in the magnetic isolate. Batches exhibiting magnetic impurity counts greater than 50 parts per billion by weight trigger immediate isolation and double-pass magnetic filtration of the entire shipment.
| Analytical Technique | Target Property | Detection Limit | Test Duration (Hours) | Instrument Cost ($) |
|---|---|---|---|---|
| Laser Diffraction | Particle size, span, D10/D50/D90 | 0.01 µm | 0.25 | 45,000 to 80,000 |
| ICP-OES / ICP-MS | Bulk metal ratios, trace impurities | 0.01 ppm | 3.0 | 120,000 to 350,000 |
| X-Ray Diffraction | Phase purity, crystallite size | 0.1 wt% | 1.5 | 90,000 to 220,000 |
| XPS Spectrometry | Surface sulfate and carbonate content | 0.1 at% | 4.0 | 400,000 to 850,000 |
| TGA / DTA Analysis | Moisture loss, structural water | 0.01 wt% | 2.0 | 35,000 to 65,000 |
Laboratory testing capabilities dictate the speed of material release decisions at processing sites.
A thirty-ton precursor lot required full replacement after unrecognized surface carbonate contamination caused catastrophic gas evolution during pilot cell degassing.

Assurance
Validating precursor quality demands transforming raw powder into active cathode materials through standardized bench-scale thermal processing and cell assembly. Chemical and physical characterization alone cannot fully predict electrochemical performance inside a battery cell. A precursor lot meeting every elemental and physical specification may still fail baseline cycling tests due to hidden grain boundary defects or micro-scale phase non-uniformities.
Bench Scale Calcination and Lithium Stoichiometry Tuning
Qualification begins by blending precursor powder with battery-grade lithium hydroxide monohydrate or lithium carbonate using high-energy turbula mixers. The target lithium-to-transition-metal molar ratio must account for lithium volatilization losses occurring during calcination. For high-nickel NMC 811, typical blending ratios range from 1.01 to 1.03 moles of lithium per mole of transition metal.
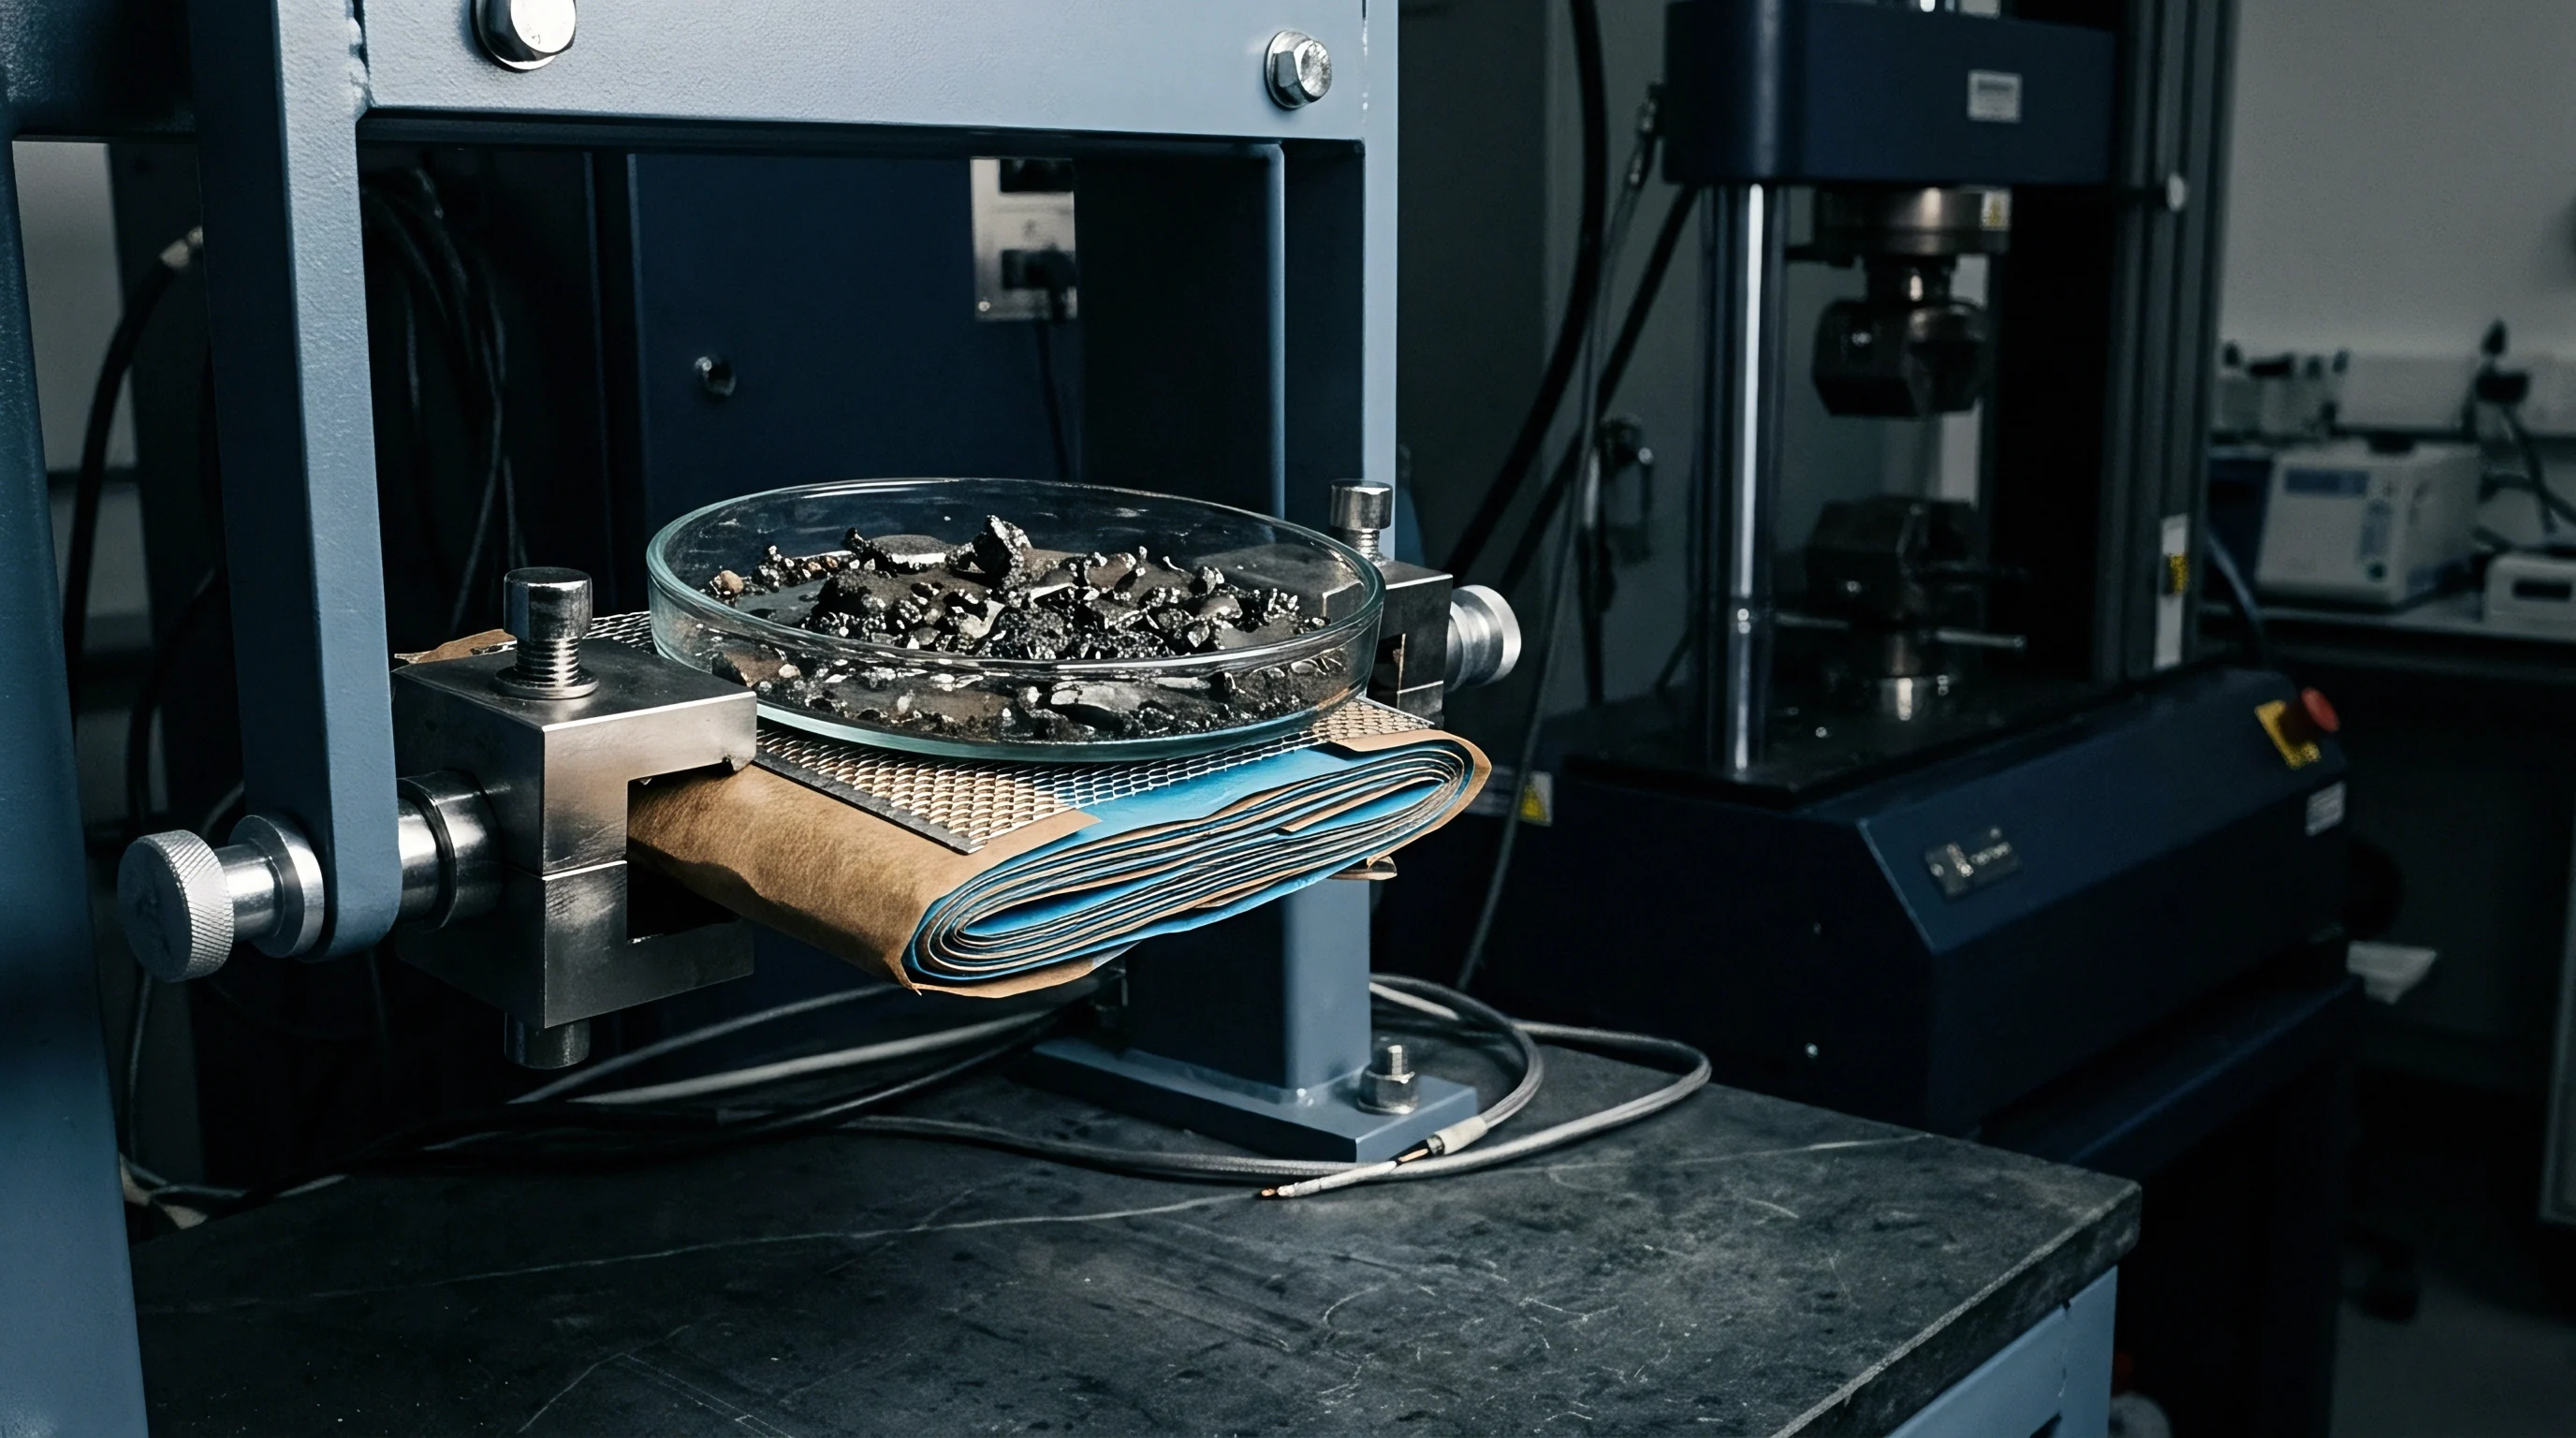
Thermal calcination takes place inside atmosphere-controlled tube furnaces or multi-zone rotary kilns. Samples undergo heating at 5 degrees Celsius per minute to an intermediate dehydroxylation dwell temperature of 450 degrees Celsius for two hours under pure oxygen flow. The temperature then ramps to a final sintering plateau between 750 and 850 degrees Celsius for twelve hours.
Oxygen flow rates must maintain positive pressure inside the furnace tube to prevent reduction of trivalent nickel species to divalent nickel ions, which drive cation mixing defects.
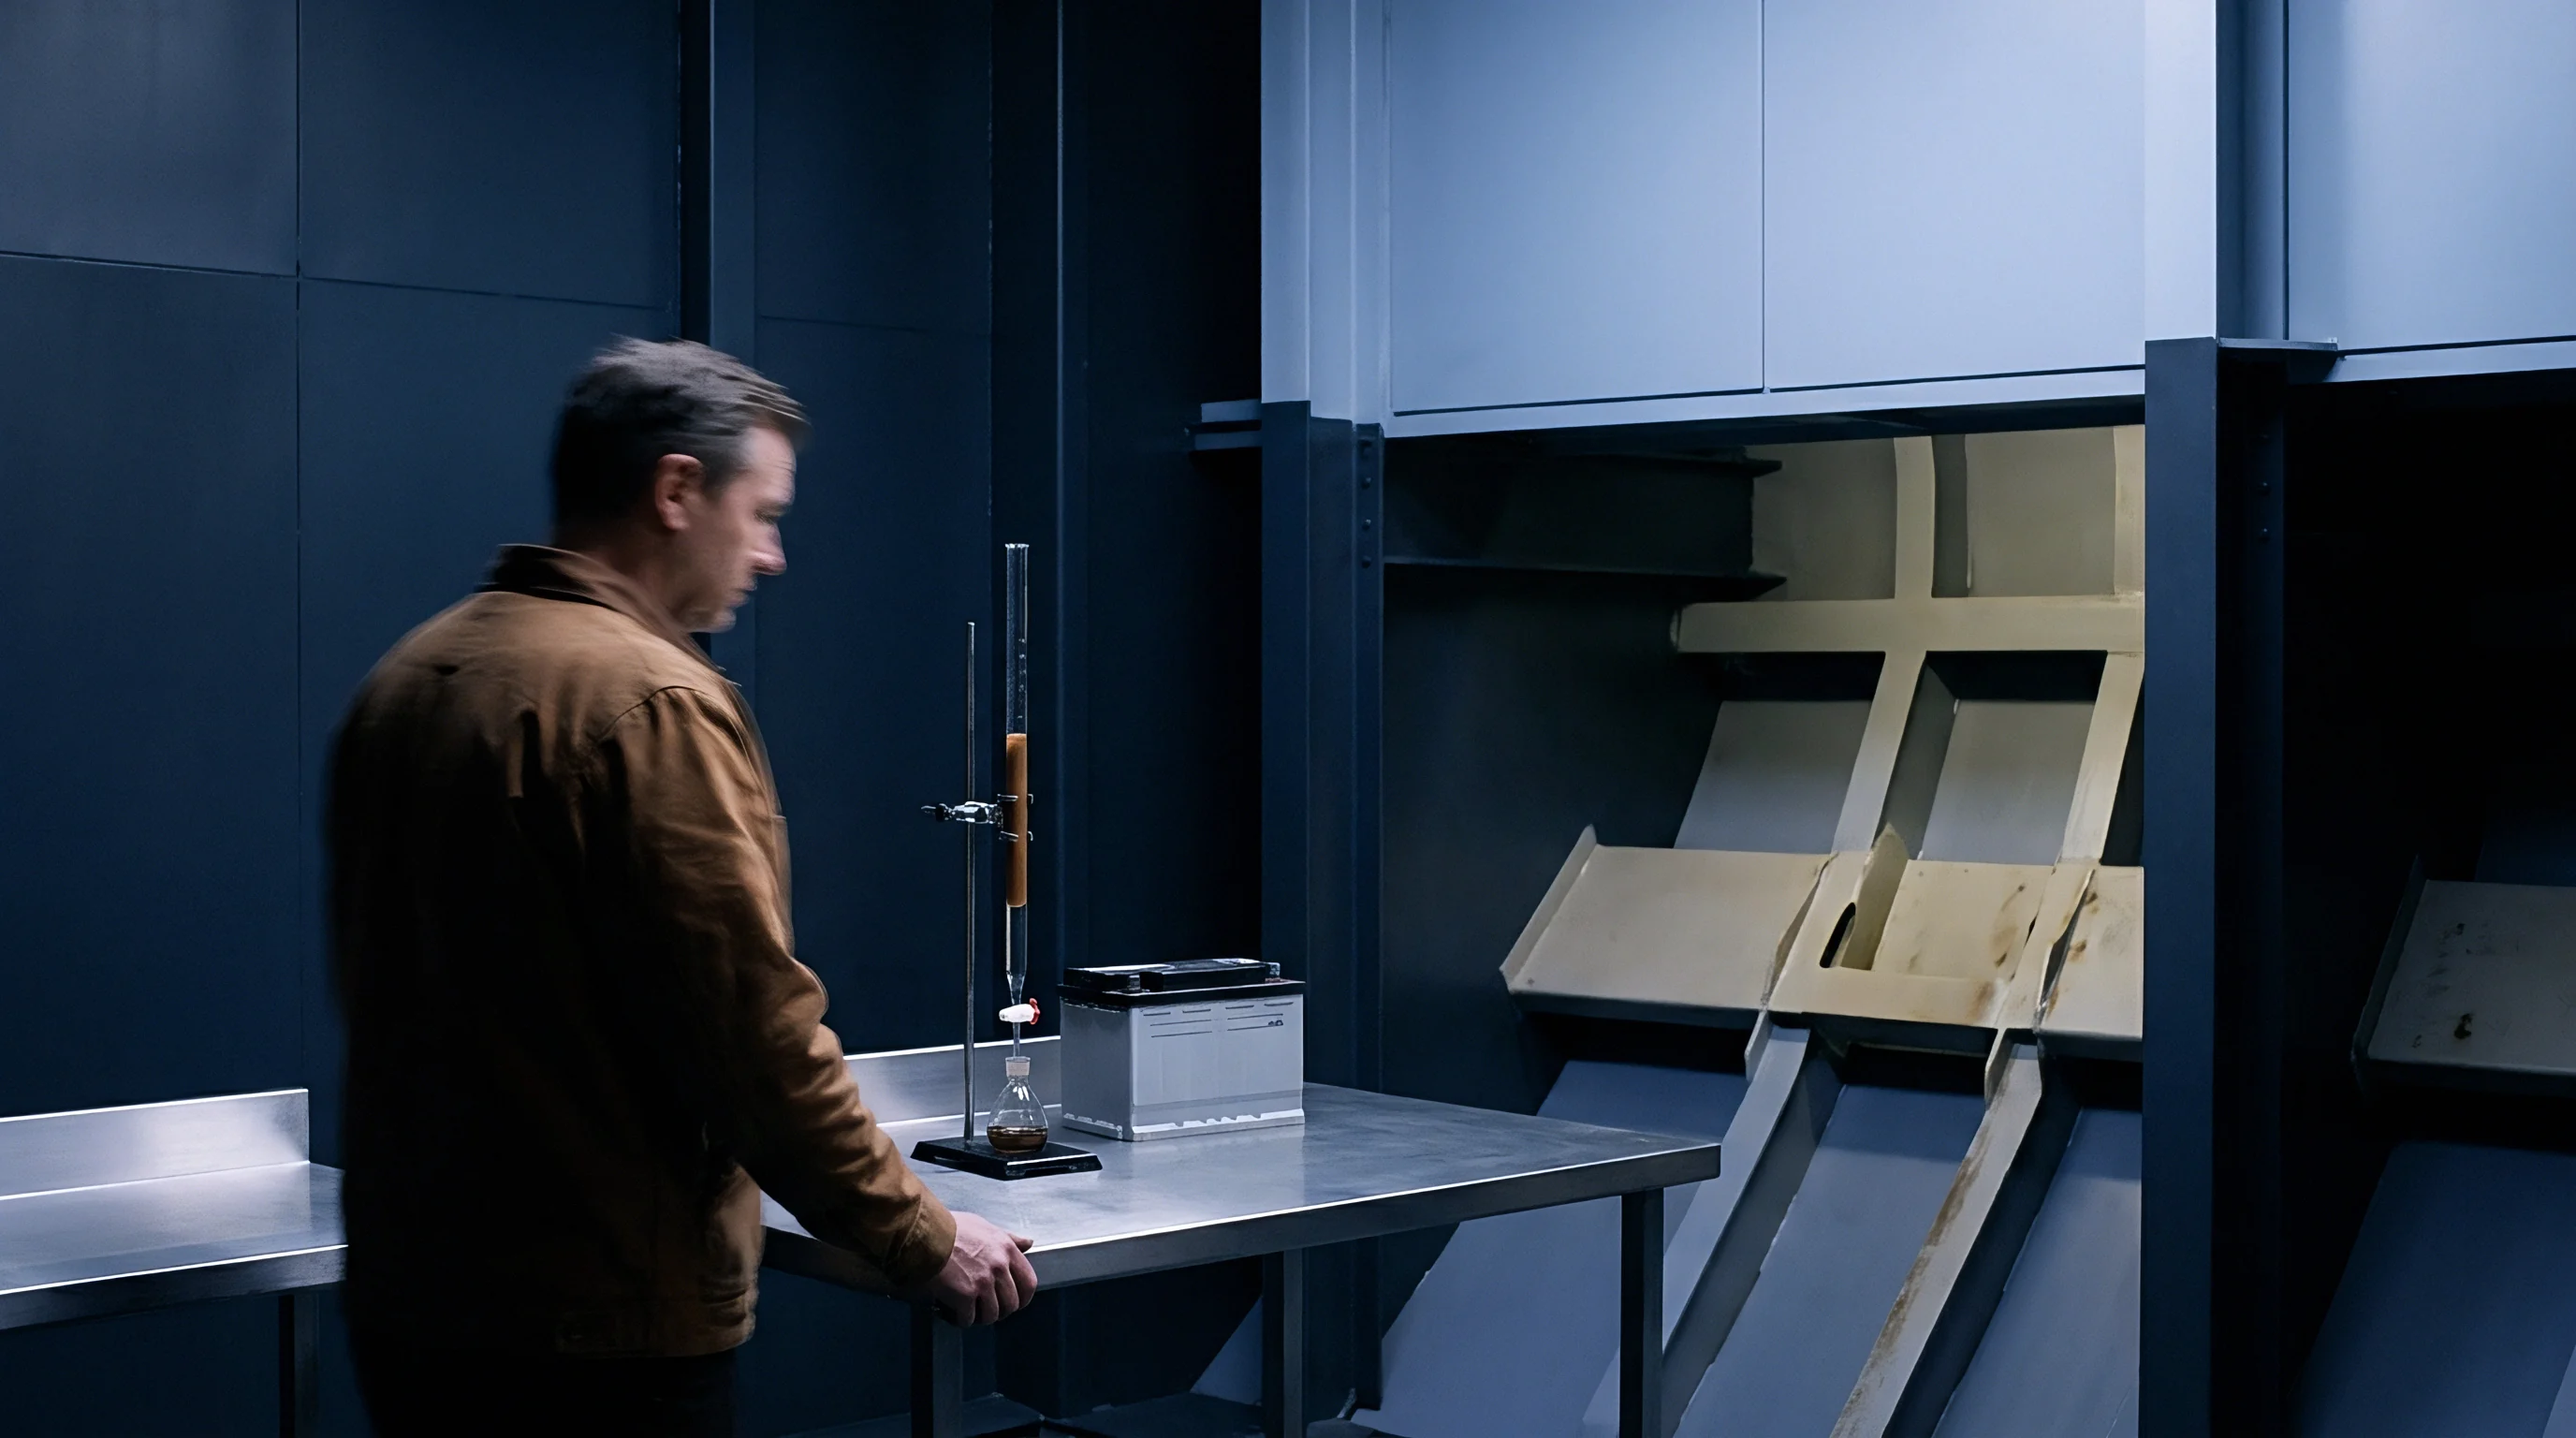
Post-calcination grinding and sieving yields finished cathode active material. Technicians evaluate the calcined product for residual soluble lithium compounds using double-titration methods. Unreacted surface lithium carbonate and lithium hydroxide levels must remain below 0.5 weight percent to prevent gas evolution and slurry gelation during cell manufacturing.
Electrochemical Qualification in Half Cell and Full Cell Formats
Synthesized cathode materials are formulated into slurry consisting of 90 weight percent active material, 5 weight percent conductive carbon black, and 5 weight percent polyvinylidene fluoride binder dissolved in N-methyl-2-pyrrolidone. Slot-die coaters apply slurry onto 15-micrometer aluminum foil collectors at target mass loadings of 15.0 milligrams per square centimeter. Calendering presses compress dried coatings to a target electrode density of 3.3 grams per cubic centimeter.
Half-cell testing uses coin-cell geometries with metallic lithium discs acting as counter and reference electrodes. Standard non-aqueous liquid electrolyte containing 1.0 molar lithium hexafluorophosphate in ethylene carbonate and ethyl methyl carbonate (3:7 ratio by volume) with 2 weight percent vinylene carbonate fills the cell separators. Half cells undergo galvanostatic charge-discharge testing inside climate-controlled chambers at 25 degrees Celsius.
Initial capacity evaluation protocol applies a slow C/10 charge rate to a upper cutoff voltage of 4.3 Volts versus lithium, followed by a C/10 discharge to 2.8 Volts. Recycled NMC 811 precursor batches must yield initial specific discharge capacities equal to or exceeding 202 milliampere-hours per gram with a first-cycle coulombic efficiency of at least 88.5 percent. Lower coulombic efficiency points directly to structural disorder or excessive cation mixing inside the synthesized cathode lattice.
Impedance Growth and Capacity Retention Tracking
Pouch-cell testing provides realistic data regarding long-term degradation mechanisms. Single-layer pouch cells pairing calcined recycled cathode electrodes with artificial graphite anodes undergo extended cycling at 1C charge and 1C discharge rates between 2.8 and 4.2 Volts under 25 degrees Celsius and accelerated 45 degrees Celsius ambient environments.
Electrochemical impedance spectroscopy tracks solid electrolyte interphase resistance and charge-transfer resistance growth across cycling intervals. Impedance spectra captured from 100 kilohertz down to 10 millihertz reveal high-frequency semi-circle growth associated with cathode surface degradation. Precursors contaminated with trace iron or sodium show rapid charge-transfer resistance increases within the first 200 cycles due to transition metal dissolution and surface micro-cracking.
Testing three recycled NMC 622 precursor lots carrying varied trace impurity profiles established direct failure correlations. Lot A contained 8 parts per million iron and 45 parts per million sodium. Lot B contained 22 parts per million iron and 180 parts per million sodium.
Lot C contained 45 parts per million iron and 410 parts per million sodium. After calcination under identical oxygen atmospheres and lithium blending ratios, coin cells were assembled and cycled.
Lot A delivered an initial capacity of 177.2 milliampere-hours per gram with 89.1 percent first-cycle efficiency, retaining 92.4 percent capacity after 500 cycles at 1C. Lot B achieved 175.8 milliampere-hours per gram initial capacity but experienced accelerated decay, retaining only 83.1 percent capacity at 500 cycles. Lot C failed baseline qualification immediately, displaying an initial capacity of 168.4 milliampere-hours per gram, a low first-cycle efficiency of 82.3 percent, and severe capacity roll-off down to 64.2 percent retention at cycle 350.
The high sodium concentration in Lot C induced severe cation mixing, blocking lithium migration pathways and accelerating intergranular particle cracking.
Precursor powders with poor internal porosity yield cathode particles that fracture during initial lithiation cycles under high current density.
Rigorous assurance steps require clear decision boundaries before material approval occurs.
- Stoichiometric Lithium Ratio Adjustment ~ Base the lithium-to-transition-metal blending ratio on total ICP metal concentration rather than nominal precursor weight to prevent unreacted lithium species.
- Oxygen Flow Velocity Verification ~ Maintain positive gauge pressure during furnace calcination to ensure complete oxidation of divalent nickel ions into trivalent states.
- Coin Cell Screening Thresholds ~ Reject precursor batches yielding cathode active materials with first-cycle coulombic efficiency below 88.5 percent at C/10 discharge rates.
- Pouch Cell Rate Retention Criteria ~ Require 2C discharge capacity retention above 82 percent relative to C/5 baseline capacity prior to commercial batch release.
Systematic correlation between precursor physical metrics and long-term pouch cell capacity retention eliminates commercial uncertainty before scaling production to multi-megawatt kilns.

Contract
Commercial agreements governing recycled battery materials depend entirely on defining precise analytical protocols and binding tolerance limits. Purchasing pCAM from recycling facilities involves pricing formulas indexed to contained metal value minus refining margins. If testing methods differ between buyer and seller laboratories, disputes over metal content, moisture deductions, and impurity penalties escalate into costly commercial deadlocks.

Representative Bulk Sampling Protocols and Split Sample Logistics
Acceptance testing fails if sample collection misses bulk batch heterogeneity. Master purchase contracts mandate sampling protocols compliant with ISO 5608 standard procedures for fine cohesive powders. Automated cross-belt samplers or vacuum thief probes slice through powder streams at defined time intervals during drum filling, collecting a composite primary sample representing at least 0.5 percent of total lot mass.
Primary composite samples undergo rotary sample splitting inside humidity-controlled gloveboxes to generate four identical analytical subsamples. Sealed aluminum foil-laminated bags carry argon gas flushes to prevent atmospheric moisture pickup during transport. Buyer and seller each receive one subsample for independent testing.
The third subsample remains stored at a neutral location as an uncompromised reserve sample, while the fourth subsample goes to an agreed referee laboratory if analytical results diverge beyond contractually defined tolerances.
Sampling bias routinely occurs when fine particles settle at drum bottoms during truck transport. Sourcing teams enforce static rotary splitting protocols over manual scoop sampling to guarantee representative particle size representation.

Arbitration Thresholds and Landed Price Adjustment Formulas
Commercial contracts define precise inter-laboratory reproducibility limits based on ASTM standard test method precision statements. For total nickel content determined via ICP-OES, the acceptable variance between buyer and seller assays is capped at 0.30 weight percent. If analytical results land within this window, the invoice settles on the mathematical average of the two reported figures.
When analytical variance exceeds 0.30 weight percent for nickel or 0.20 weight percent for cobalt, the binding referee clause triggers automatically. The referee laboratory executes acid digestion and ICP analysis under identical specified parameters. The referee result governs final settlement, and the party whose assay showed the largest deviation from the referee value pays all arbitration laboratory fees.
Landed pricing formulas adjust payment amounts based on chemical impurity penalties. Contracts establish a baseline price per metric ton of precursor powder based on London Metal Exchange or Fastmarkets daily index prices for nickel and cobalt metals. Penalty clauses deduct direct dollar amounts for off-spec impurity levels.
For instance, sodium levels exceeding 150 parts per million incur a penalty deduction of $50 per metric ton for every 50 parts per million incremental step. Trace iron or copper levels exceeding 10 parts per million give the buyer absolute rights to reject the entire shipment lot at seller expense, forcing supplier re-pick up and freight re-imbursment within fourteen calendar days.
Incorporating ASTM E300 sampling compliance into purchase orders mandates three-way split sampling at the discharge port, shifting transit degradation liability to the seller upon delivery.