Precursor Selection and Oxidative Stabilization Parameters for Hard Carbon Synthesis
Controlled oxidative cross-linking of pitch precursors balances carbon yield and closed porosity to optimize hard carbon capacity and initial coulombic efficiency.

Pitch

Precursor Chemical Architecture
Aromatic hydrocarbon feeds establish the baseline molecular skeleton for hard carbon synthesis. Polycyclic aromatic structures present in coal tar pitch and petroleum pitch provide high initial carbon content, typically between 88 percent and 93 percent by weight. Biomass precursors such as sucrose, starch, and lignin exhibit lower initial carbon content due to abundant oxygenated functional groups, resulting in lower conversion mass yields.
Synthetic polymers like phenolic resins yield highly reproducible sp2-hybridized carbon frameworks, though raw material pricing remains elevated. Pitch softening points ranging from 110°C to 280°C dictate whether the raw feed behaves as a fluid or a solid during early thermal treatment steps. High softening points correlate with elevated mesophase resin fractions and quinoline insolubles, which restrict molecular realignment and foster isotropic, disordered carbon structures upon thermal decomposition.
Heteroatom content inside the raw precursor modifies structural condensation paths. Sulfur and nitrogen atoms embedded within aromatic rings lower the onset temperature of thermal polymerization. Excess heteroatoms generate localized structural defects during high-temperature volatile clearance, opening surface-accessible micro-cavities that degrade first-cycle charge retention.
Synthetic pitch modification using Lewis acid catalysts increases the pitch softening point, shifting the precursor chemical structure toward higher molecular weight aromatic clusters before thermal oxidative processing begins.
Coal tar pitch with a softening point above 250°C achieves a carbon yield of 62 percent under inert pyrolysis at 1200°C.
Cross-Linking Reactions and Thermosetting Mechanics
Polycyclic aromatic structures demand chemical immobilization to prevent parallel stacking during high-temperature carbonization. Unmodified thermoplastic pitch melts upon heating above its softening point, causing aromatic molecules to align into ordered graphitic domains that form soft carbon. Introducing oxidative cross-linking converts thermoplastic pitch into a non-melting thermoset solid.
Oxygen bridges, including carbonyl, carboxyl, phenolic hydroxyl, and ether linkages, form between adjacent aromatic rings during thermal air processing. These oxygen bridge structures freeze molecular orientations, preventing graphitization during subsequent thermal exposure above 1000°C.
Aromaticity controls cross-linking kinetic rates. Coal tar pitch exhibits higher aromatic condensation levels than petroleum pitch, accelerating oxidation kinetics and reducing the required residence time inside oxidation reactors. Yield losses increase total processing cost.
The balance between precursor aromaticity, softening point, and oxygen reactivity dictates the final microstructural landscape of the synthesized hard carbon material.
- Macro-Phase Separation Heavy insolubles precipitate early during liquefaction, creating spatial variance in oxygen diffusion depth throughout the precursor mass.
- Volatilization Loss Low molecular weight species evaporate prior to cross-linking, reducing solid carbon yield below acceptable economic thresholds.
- Exothermic Runaway Uncontrolled oxidation reactions spike internal reaction vessel temperatures, causing localized sintering and structural collapse.
- Heteroatom Contamination Excess sulfur or nitrogen content forms unstable surface compounds that degrade initial coulombic efficiency in finished cells.
| Precursor Feedstock | Softening Point (°C) | Aromaticity Index (I-ar) | Initial Oxygen (wt%) | Pyrolysis Carbon Yield (%) |
|---|---|---|---|---|
| Coal Tar Pitch (High Softening) | 250–280 | 0.88–0.92 | 1.2–1.8 | 58–64 |
| Petroleum Pitch (Isotropic) | 110–140 | 0.65–0.72 | 0.3–0.8 | 42–48 |
| Phenolic Resin (Novolac) | 90–115 | 0.50–0.58 | 14.0–18.0 | 45–52 |
| Sucrose / Carbohydrate | 185 (Decomp) | 0.00 | 48.0–51.0 | 28–34 |
| Kraft Lignin | 170–210 | 0.35–0.42 | 25.0–30.0 | 35–41 |
Variations in precursor softening points falling within a fifteen-degree window exert negligible impact on target electrochemical properties.

Air
Oxygen Mass Transfer and Thermal Windows
Thermosetting precursor solids demands precise gaseous environment management inside the oxidation kiln. Diffusion rates of oxidizing species into liquid or solid hydrocarbon particles govern conversion depth. Oxygen molecules react with aliphatic side chains and condensed aromatic rings at particle surfaces, establishing a concentration gradient that moves inward toward particle cores.
Reaction rates must remain balanced against diffusion rates to prevent skin-core effects, where an oxidized, rigid outer shell encloses an un-crosslinked, thermoplastic core. Particle size reduction improves mass transfer efficiency, establishing uniform oxygen uptake throughout particle cross-sections.
Operating temperatures during oxidative stabilization range between 180°C and 320°C, remaining below the softening point or rising slowly alongside the softening point increase induced by cross-linking. Heating rates above 5°C per minute run the risk of exceeding the thermal dissipation capacity of gas-solid contactors. Exothermic oxidation releases heat between 1.2 and 2.8 megajoules per kilogram of precursor processed, requiring active vessel cooling and gas flow regulation to maintain thermal control.
- Load pulverized precursor powder into the rotary kiln, establishing an active bed motion that prevents particle fusion.
- Elevate reactor vessel temperature to 180°C at a rate of 2°C per minute under continuous dry gas flow.
- Hold isothermal conditions at 220°C for three hours while monitoring mass gain targets between eight and twelve percent.
- Ramp temperature to 280°C at 1°C per minute to complete oxygen bridge cross-linking throughout particle cores.
- Cool reactor contents under nitrogen purge to ambient levels prior to discharging thermoset material into storage hoppers.
Non-compliance with ISO 188 for gas-flow velocity variations exceeding five percent induces localized thermal spikes that invalidate batch homogeneity.

Thermosetting Ramps and Residence Sequence
Controlling the temperature profile prevents sample agglomeration while building stable oxygen bridge structures. Gas flow prevents localized thermal spikes. Isothermal holds integrated at intermediate temperatures allow heat dissipation while oxygen diffuses into inner core regions.
Oxygen mass gain serves as the primary parameter for evaluating stabilization completeness. Targeted oxygen incorporation levels typically fall between 6 percent and 14 percent by weight relative to the starting material mass.
Insufficient mass gain leaves thermoplastic pockets that liquefy during high-temperature pyrolysis, inducing graphitic domain growth and reducing closed pore volume. Excessive mass gain over-oxidizes the carbon framework, forming volatile carbon oxides during subsequent heating steps. Over-oxidation creates macro-pores and surface cracks that increase specific surface area, exposing active carbon sites to secondary reactions with battery electrolytes.
| Precursor Type | Gas O2 Content (%) | Ramp Rate (°C/min) | Peak Temperature (°C) | Target Mass Gain (wt%) |
|---|---|---|---|---|
| Coal Tar Pitch | 21 (Dry Air) | 0.5–1.5 | 270–300 | 8.0–11.0 |
| Petroleum Pitch | 15–21 | 0.2–0.8 | 240–270 | 10.0–13.5 |
| Phenolic Resin | 5–10 | 2.0–5.0 | 180–220 | 2.0–4.5 |
| Lignin Powder | 21 (Dry Air) | 0.5–2.0 | 220–250 | 5.0–8.0 |
Insufficient oxidative cross-linking results in complete particle fusion during high-temperature firing, converting fluidised powder beds into fused glassy slabs that destroy furnace liners and produce zero battery-grade material.

Pyrolysis
Thermal Profile and Volatile Discharge
Thermal degradation of cross-linked carbonaceous matter under inert atmospheres removes non-carbon heteroatoms and drives aromatic condensation. Carbonization temperature dictates graphitic layer spacing. Heating stabilized precursors between 1000°C and 1400°C drives off volatile species including carbon monoxide, carbon dioxide, water vapor, methane, and hydrogen gas.
The primary mass loss phase occurs between 400°C and 700°C, during which oxygen bridges break and recombine into stable carbon-carbon bonds, emitting condensable hydrocarbon tars and non-condensable gases.
Ramp rates during carbonization govern gas evolution velocities and structural pore development. Heating rates between 2°C and 10°C per minute prevent structural fracturing caused by rapid gas expansion within particle cores. High-temperature residence times ranging from two to six hours allow lattice strain relaxation and structural consolidation.
Processing temperatures exceeding 1500°C initiate graphitization in carbon materials, causing closed pores to collapse, interlayer spacing to contract below 0.36 nanometers, and sodium storage capacity to decline rapidly.

Inert Atmosphere Purging Protocols
Maintaining high-purity argon or nitrogen sweep gas prevents secondary oxidation during graphitic domain reorganization. Oxygen contamination levels above 10 parts per million inside high-temperature firing zones etch carbon particle surfaces, expanding open surface micro-cavities and destroying closed porosity. High sweep gas velocity strips volatile species away from particle surfaces, preventing secondary tar deposition that blocks surface pore openings.
- Atmosphere Purity Verification Oxygen content in argon sweep gas remains below five parts per million to protect expanding pore surfaces from unwanted oxidation.
- Soak Temperature Bounds Ultimate carbonization target ranges between 1100°C and 1300°C to maximize closed pore volume without inducing premature microcrystallite stacking.
- Exhaust Volatile Scavenging Condensable tar vapors require continuous extraction from hot furnace zones to prevent surface soot re-deposition.
- Cooling Profile Controls Post-firing quench rates stay under 5°C per minute down to 300°C to minimize internal lattice strain.
Slower ramp rates during high-temperature carbonization expand closed pore volume while preserving structural integrity against pore collapse.
Contract specifications enforcing ISO 14811 guidelines for carbon material volatile matter testing penalize shipments exceeding 0.5 percent trace volatiles by imposing a fifteen percent price deduction per metric ton.
Lattice

Interlayer Spacing and Turbostratic Disorder
Microstructural metrics of hard carbon materials govern the physical space available for sodium insertion and storage. Interlayer spacing d002 measured via x-ray diffraction ranges between 0.36 nanometers and 0.40 nanometers in non-graphitizable carbons, exceeding the 0.335 nanometer spacing characteristic of ideal graphite. Expanded interlayer distance lowers the energy barrier for sodium ion intercalation between curved graphene layers.
Turbostratic disorder describes the random translational and rotational displacement of graphene sheets relative to adjacent layers, preventing long-range crystalline stacking along the c-axis.
Cross-linked pitch precursors retain short-range aromatic order while suppressing long-range graphitic orientation. Raman spectroscopy ratios of defect-induced D-band intensity around 1350 cm⁻¹ to graphitic G-band intensity around 1580 cm⁻¹ quantify surface and bulk disorder levels. ID/IG ratios between 0.95 and 1.25 correlate with high slope capacity during electrochemical galvanostatic cycling, representing sodium adsorption at edge defects, heteroatom sites, and surface functional groups.
Closed Porosity Creation and Sodium Insertion Mechanism
Nanometer-scale voids embedded within disordered carbon domains store neutral sodium atoms at low operating potentials. Closed porosity develops when curved, cross-linked graphene sheets fold and cross-link during volatile gas discharge, leaving inaccessible interior voids. Nitrogen physisorption methods measure open surface pores, yielding low specific surface areas between 1.0 and 5.0 square meters per gram for optimized hard carbon powders.
Small-angle x-ray scattering or carbon dioxide adsorption techniques reveal closed pore volumes ranging from 0.05 to 0.20 cubic centimeters per gram.
Closed pores store neutral sodium atoms via pore-filling mechanisms, manifesting as a flat voltage plateau below 0.1 volts versus sodium metal reference electrodes. High plateau capacity combined with low voltage hysteresis enhances full-cell energy density when paired with sodium-ion cathodes. Excessive oxidative stabilization increases lattice defect density but reduces closed pore volume, shifting the capacity distribution toward high-potential slope regions and reducing total full-cell energy output.
| Stabilization Parameter Set | Interlayer d002 (nm) | Raman ID/IG Ratio | Closed Pore Vol (cm³/g) | Slope Capacity (mAh/g) | Plateau Capacity (mAh/g) |
|---|---|---|---|---|---|
| Low O2 Gain (4.0 wt%) | 0.362 | 0.88 | 0.042 | 95 | 140 |
| Optimal O2 Gain (9.5 wt%) | 0.378 | 1.12 | 0.145 | 120 | 215 |
| High O2 Gain (15.0 wt%) | 0.389 | 1.34 | 0.068 | 185 | 90 |
| Over-Stabilized (18.5 wt%) | 0.395 | 1.52 | 0.021 | 210 | 35 |
Whether closed pore volume can be selectively expanded without increasing exterior surface area remains an open question across industrial electrochemistry laboratories.


Defect

Where Does First Cycle Capacity Loss Originate?
Unsaturated carbon bonds and active heteroatom sites on powder surfaces consume active charge carriers during initial cell formation. Residual oxygen functional groups, including acidic carboxylic and phenolic species left behind after incomplete thermal clearance, react irreversibly with carbonate electrolyte solvents and active sodium ions. Solid electrolyte interphase layer growth scales with exterior specific surface area, consuming active sodium and lowering initial coulombic efficiency below acceptable commercial thresholds.
Initial coulombic efficiency values below 85 percent require expensive pre-metalliation steps or cathode active mass overbalancing inside manufactured sodium-ion cells. Surface defects also induce irreversible capacity losses at potentials above 0.5 volts, accelerating gas generation inside sealed pouch cells during high-temperature storage testing. Controlling stabilization heating rates and inert purging efficiency minimizes surface functional group density while maintaining internal closed pore networks.
Passivation and Surface Chemistry Remediation
Post-synthetic chemical washing removes residual active species to stabilize the solid electrolyte interphase. Chemical vapor deposition using volatile hydrocarbon gas feeds like acetylene or methane coats raw hard carbon particles with a thin, highly ordered carbon layer. Surface passivation reduces specific surface area from over 20 square meters per gram down to less than 2 square meters per gram without altering internal closed pore structures.
Coated particle morphology reduces solvent molecule access to reactive defect sites, inhibiting continuous electrolyte decomposition over extended cycling. Halogen gas etching or mild acid washing removes metallic ash impurities such as iron and silicon derived from low-cost pitch feedstocks. Metallic ash impurities trigger localized micro-short circuits and accelerate transition metal dissolution when present inside active cell environments.
Residual surface oxygen functional groups accelerate electrolyte decomposition and expand first-cycle capacity loss during sodium insertion.
- Elemental Composition Analysis Certificate of analysis reports carbon, oxygen, nitrogen, and sulfur weight percentages accurate to within 0.1 percent resolution.
- Thermogravimetric Residue Log Mass loss profiles under inert heating document volatile release stages from 200°C to 1000°C.
- Softening Point Verification Standardized ring-and-ball test data certifies precursor liquefaction temperatures to ensure proper processing feed parameters.
- Trace Metal Impurity Sheet Inductively coupled plasma spectroscopy quantifies iron, nickel, and vanadium levels below fifty parts per million.
Higher specific surface area in hard carbon materials universally degrades initial coulombic efficiency regardless of precursor origin or thermal treatment history.

Cost
Precursor Pricing and Mass Yield Balance
Financial expenditure for hard carbon production scales directly with raw feedstock yield and energy consumption during thermal processing. Coal tar pitch and petroleum pitch cost between 400 and 900 USD per metric ton, offering low raw material procurement costs relative to synthetic phenolic resins that exceed 3,000 USD per metric ton. Biomass feedstocks like coconut shells or starch appear inexpensive at 200 to 500 USD per metric ton, but exhibit low carbon conversion yields between 25 percent and 35 percent after complete oxidative thermal processing.
Mass balance losses during oxidative stabilization and high-temperature carbonization amplify effective raw material costs. Processing one metric ton of low-yield precursor requires larger reactor vessel volumes and higher gas throughput, driving up capital equipment amortization and utility costs per kilogram of finished material. High-softening-point pitch feedstocks achieving overall mass yields above 55 percent lower total expenditure despite elevated raw feed procurement pricing.
Energy Intensity and Landed Expense Breakdown
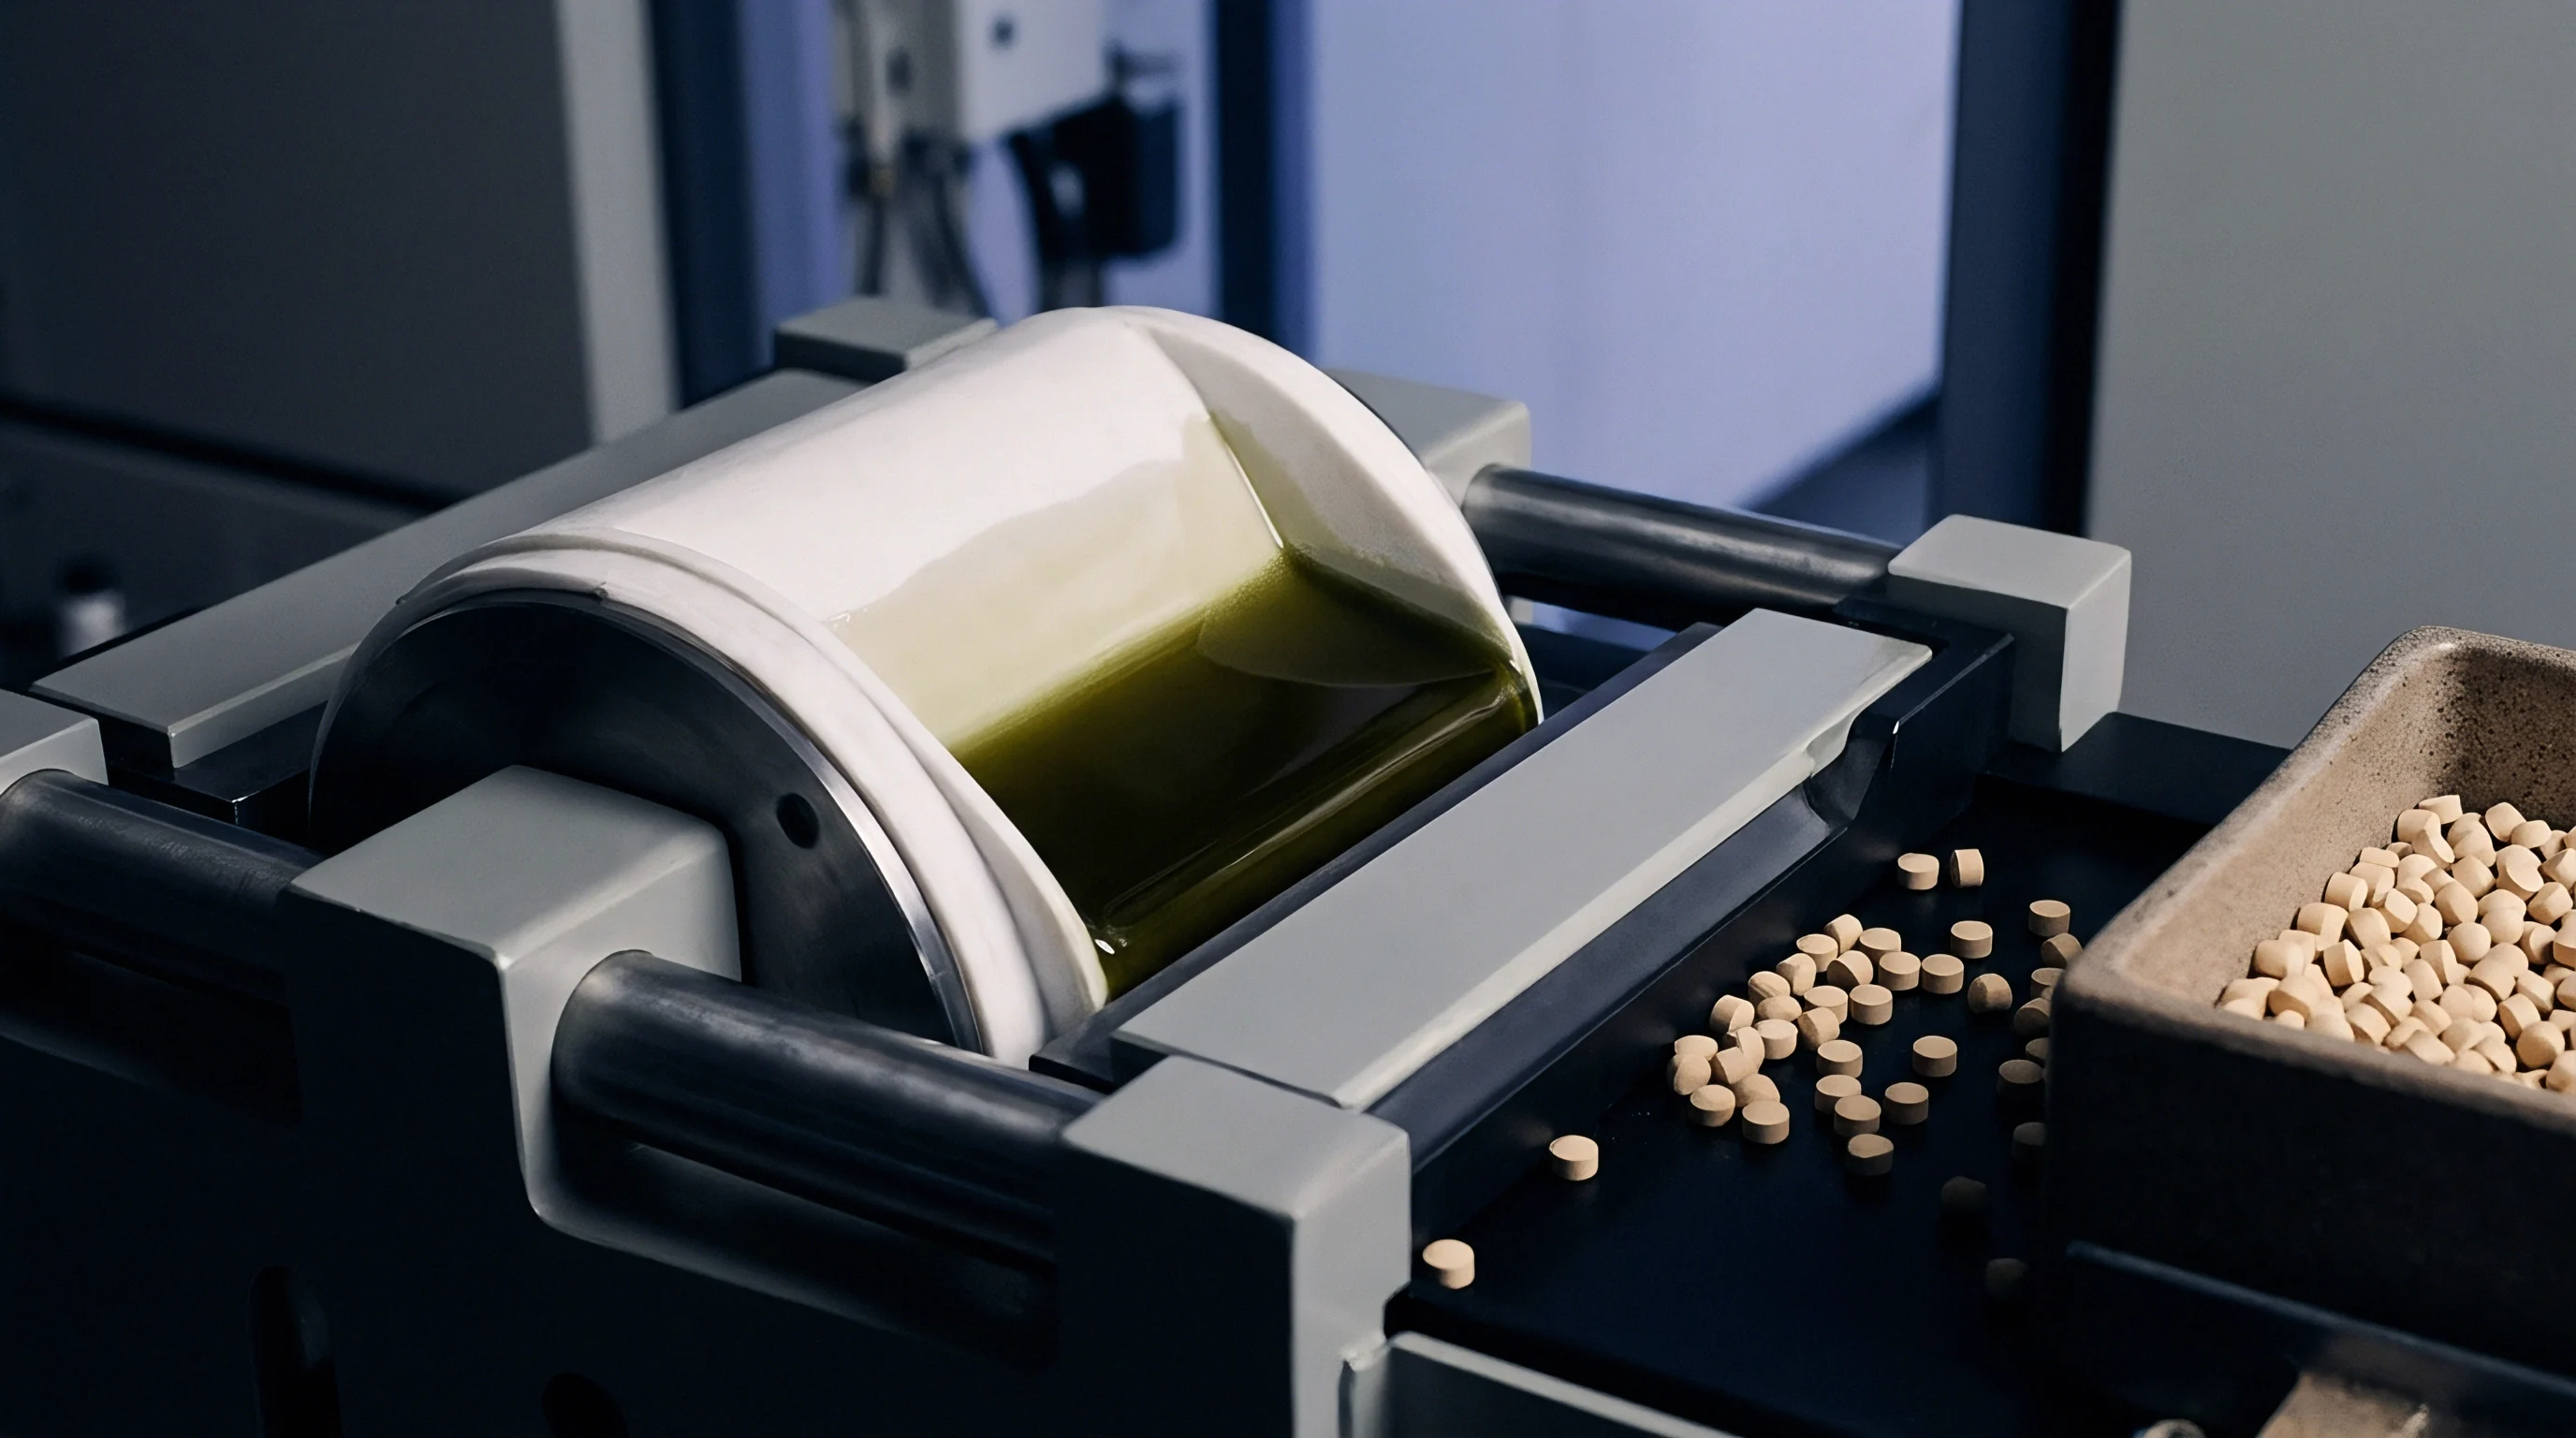
Electricity requirements for multi-stage high-temperature kilns dominate operational processing budgets at scale. Multi-stage continuous rotary kilns consume between 8 and 14 kilowatt-hours of electrical energy per kilogram of produced hard carbon, depending on residence times and furnace insulation efficiency. Extended stabilization holds at 250°C and carbonization ramps to 1300°C constitute the primary energy cost drivers.
Landed cost calculations incorporate chemical consumables, inert gas purging expenses, waste gas scrubbing compliance, and transportation freight. Purging kilns with high-purity argon gas adds up to 0.80 USD per kilogram of finished product compared to nitrogen gas purging at 0.15 USD per kilogram, though argon preserves higher closed porosity levels. Yield losses, energy consumption, and surface coating steps yield final cell-grade hard carbon production costs between 3.50 USD and 7.20 USD per kilogram, directly governing the commercial viability of sodium-ion cell manufacturing lines.
Yield-adjusted landed calculations determine whether a low-cost biomass feedstock ultimately outperforms a high-cost synthetic pitch on a delivered cost per kilowatt-hour basis.