Resolving High Frequency Alternating Current and Direct Current Impedance Measurement Divergence in Automated Test Fixtures
Resolving AC and DC impedance divergence in automated test fixtures requires four-wire coaxial leads, real-time SOL de-embedding, and dual-metric cell triage.
Clamp
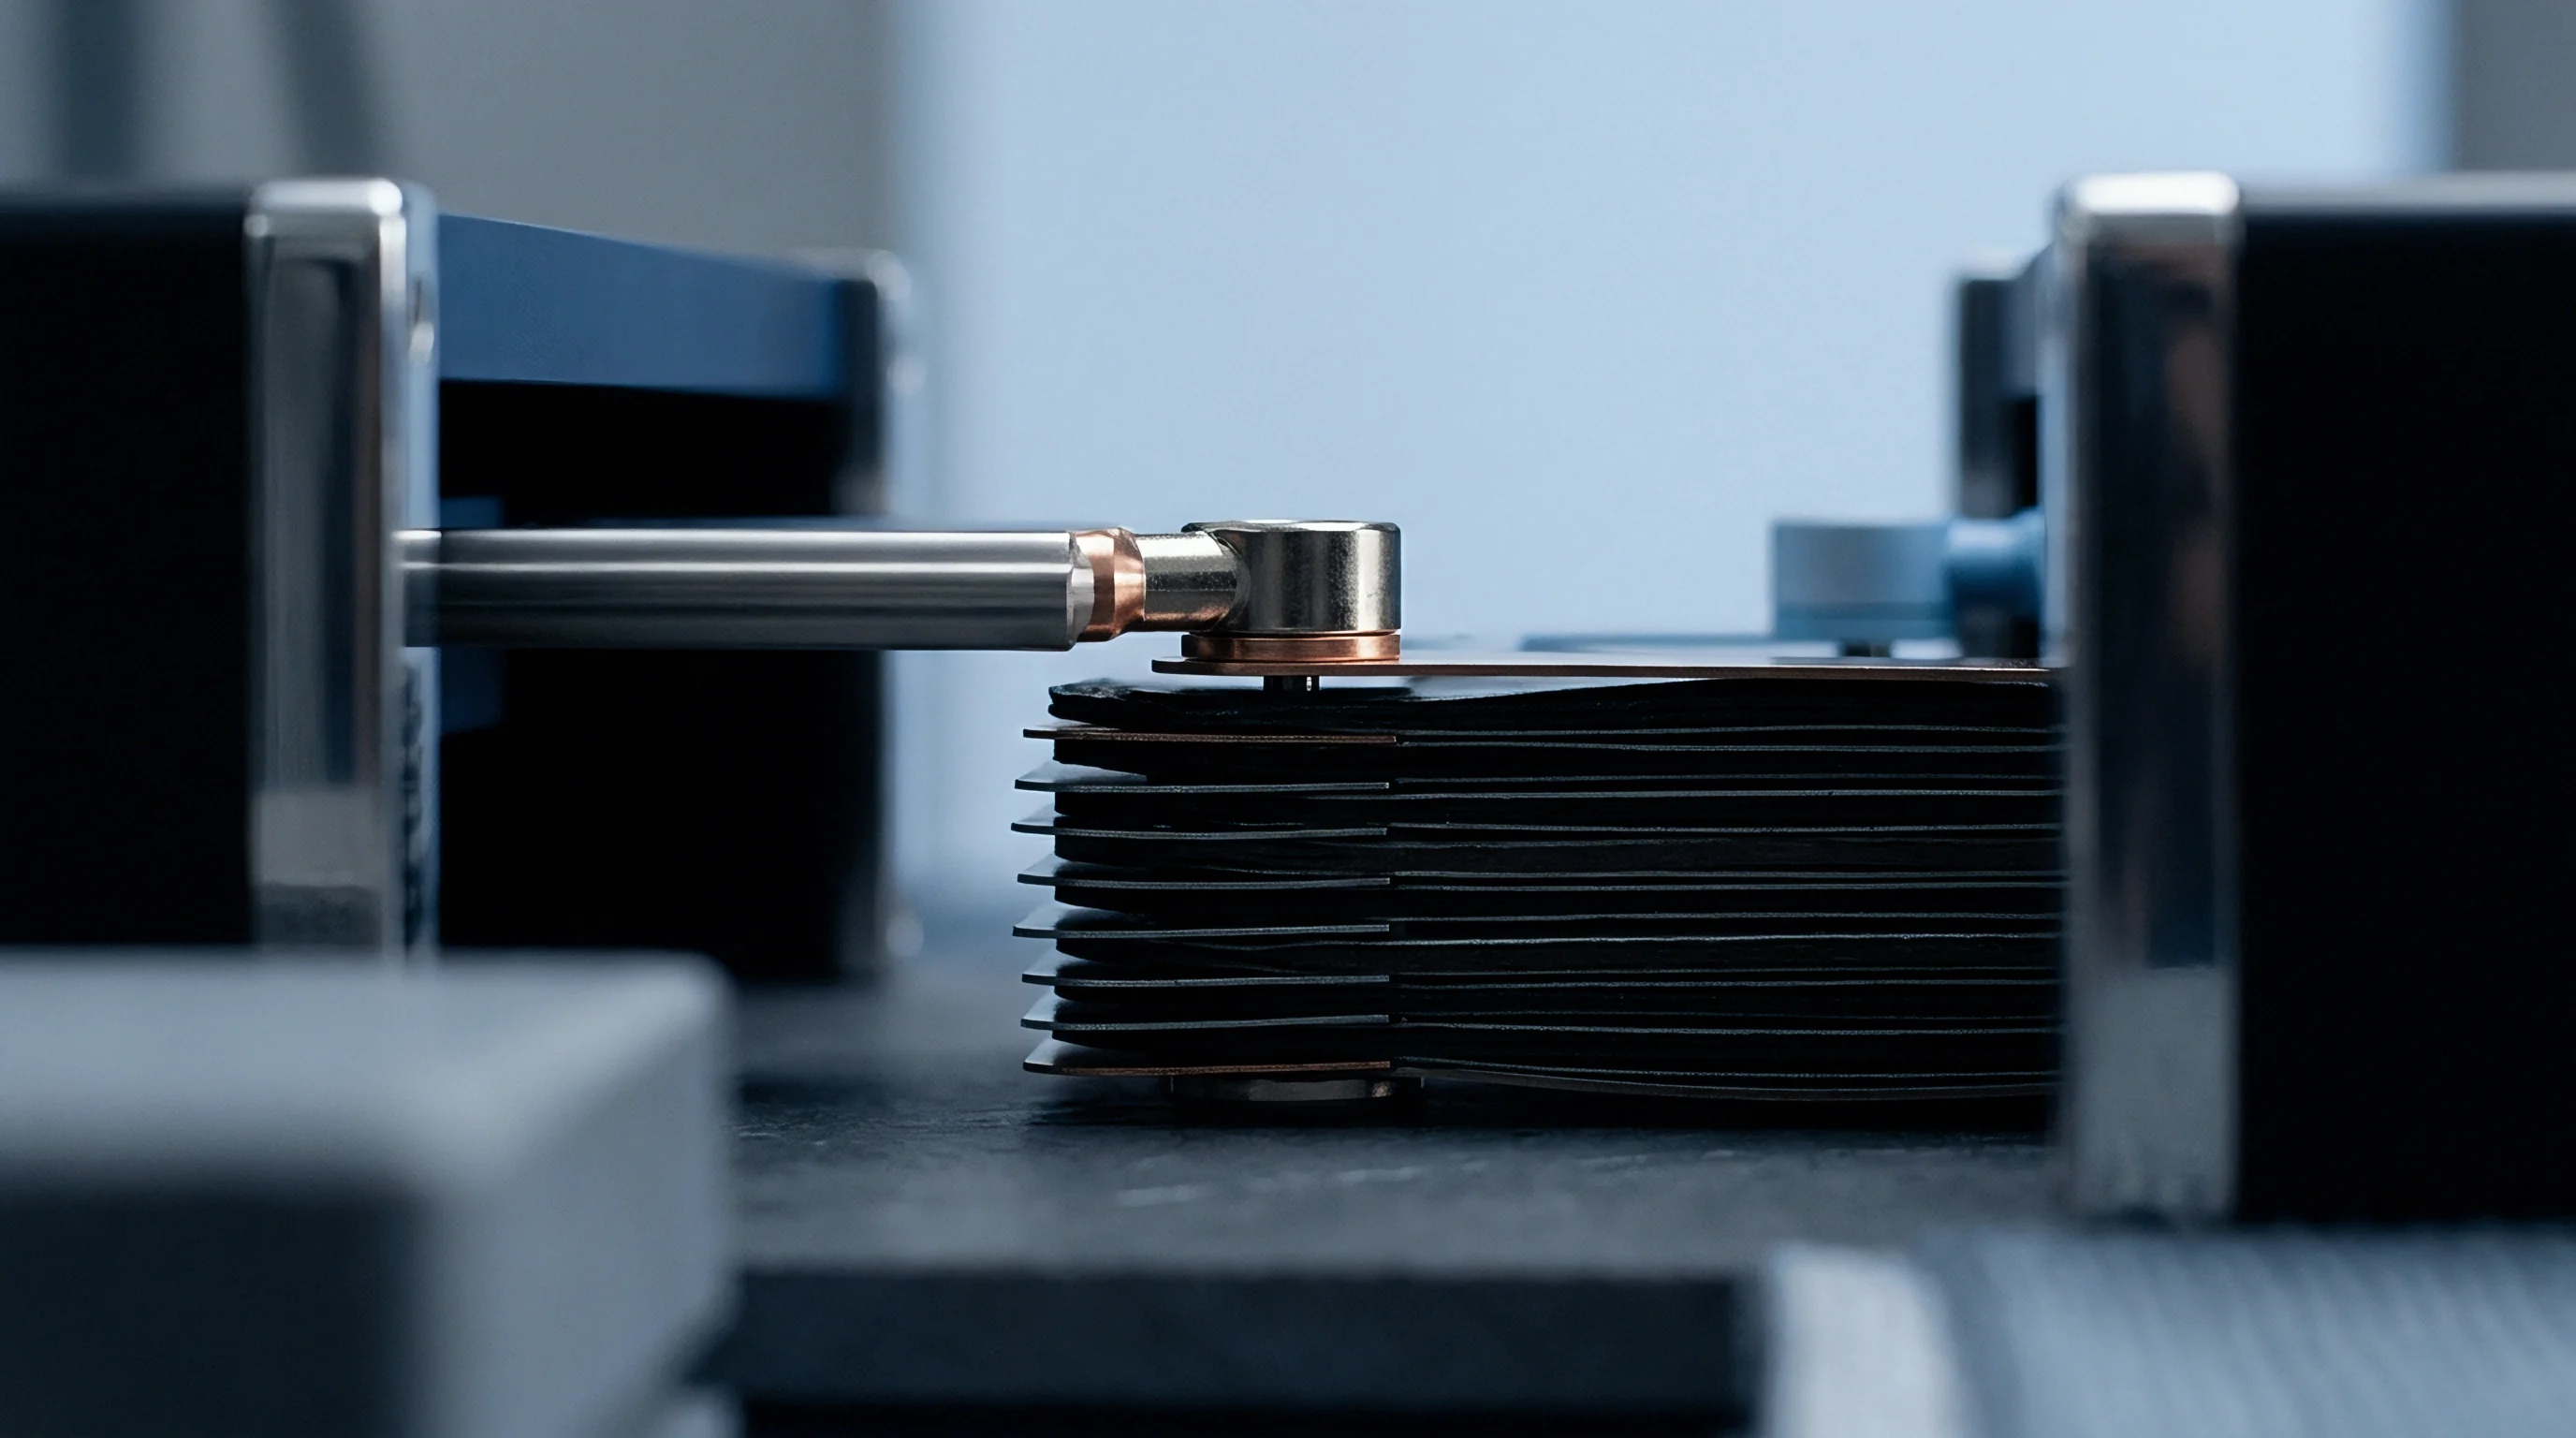
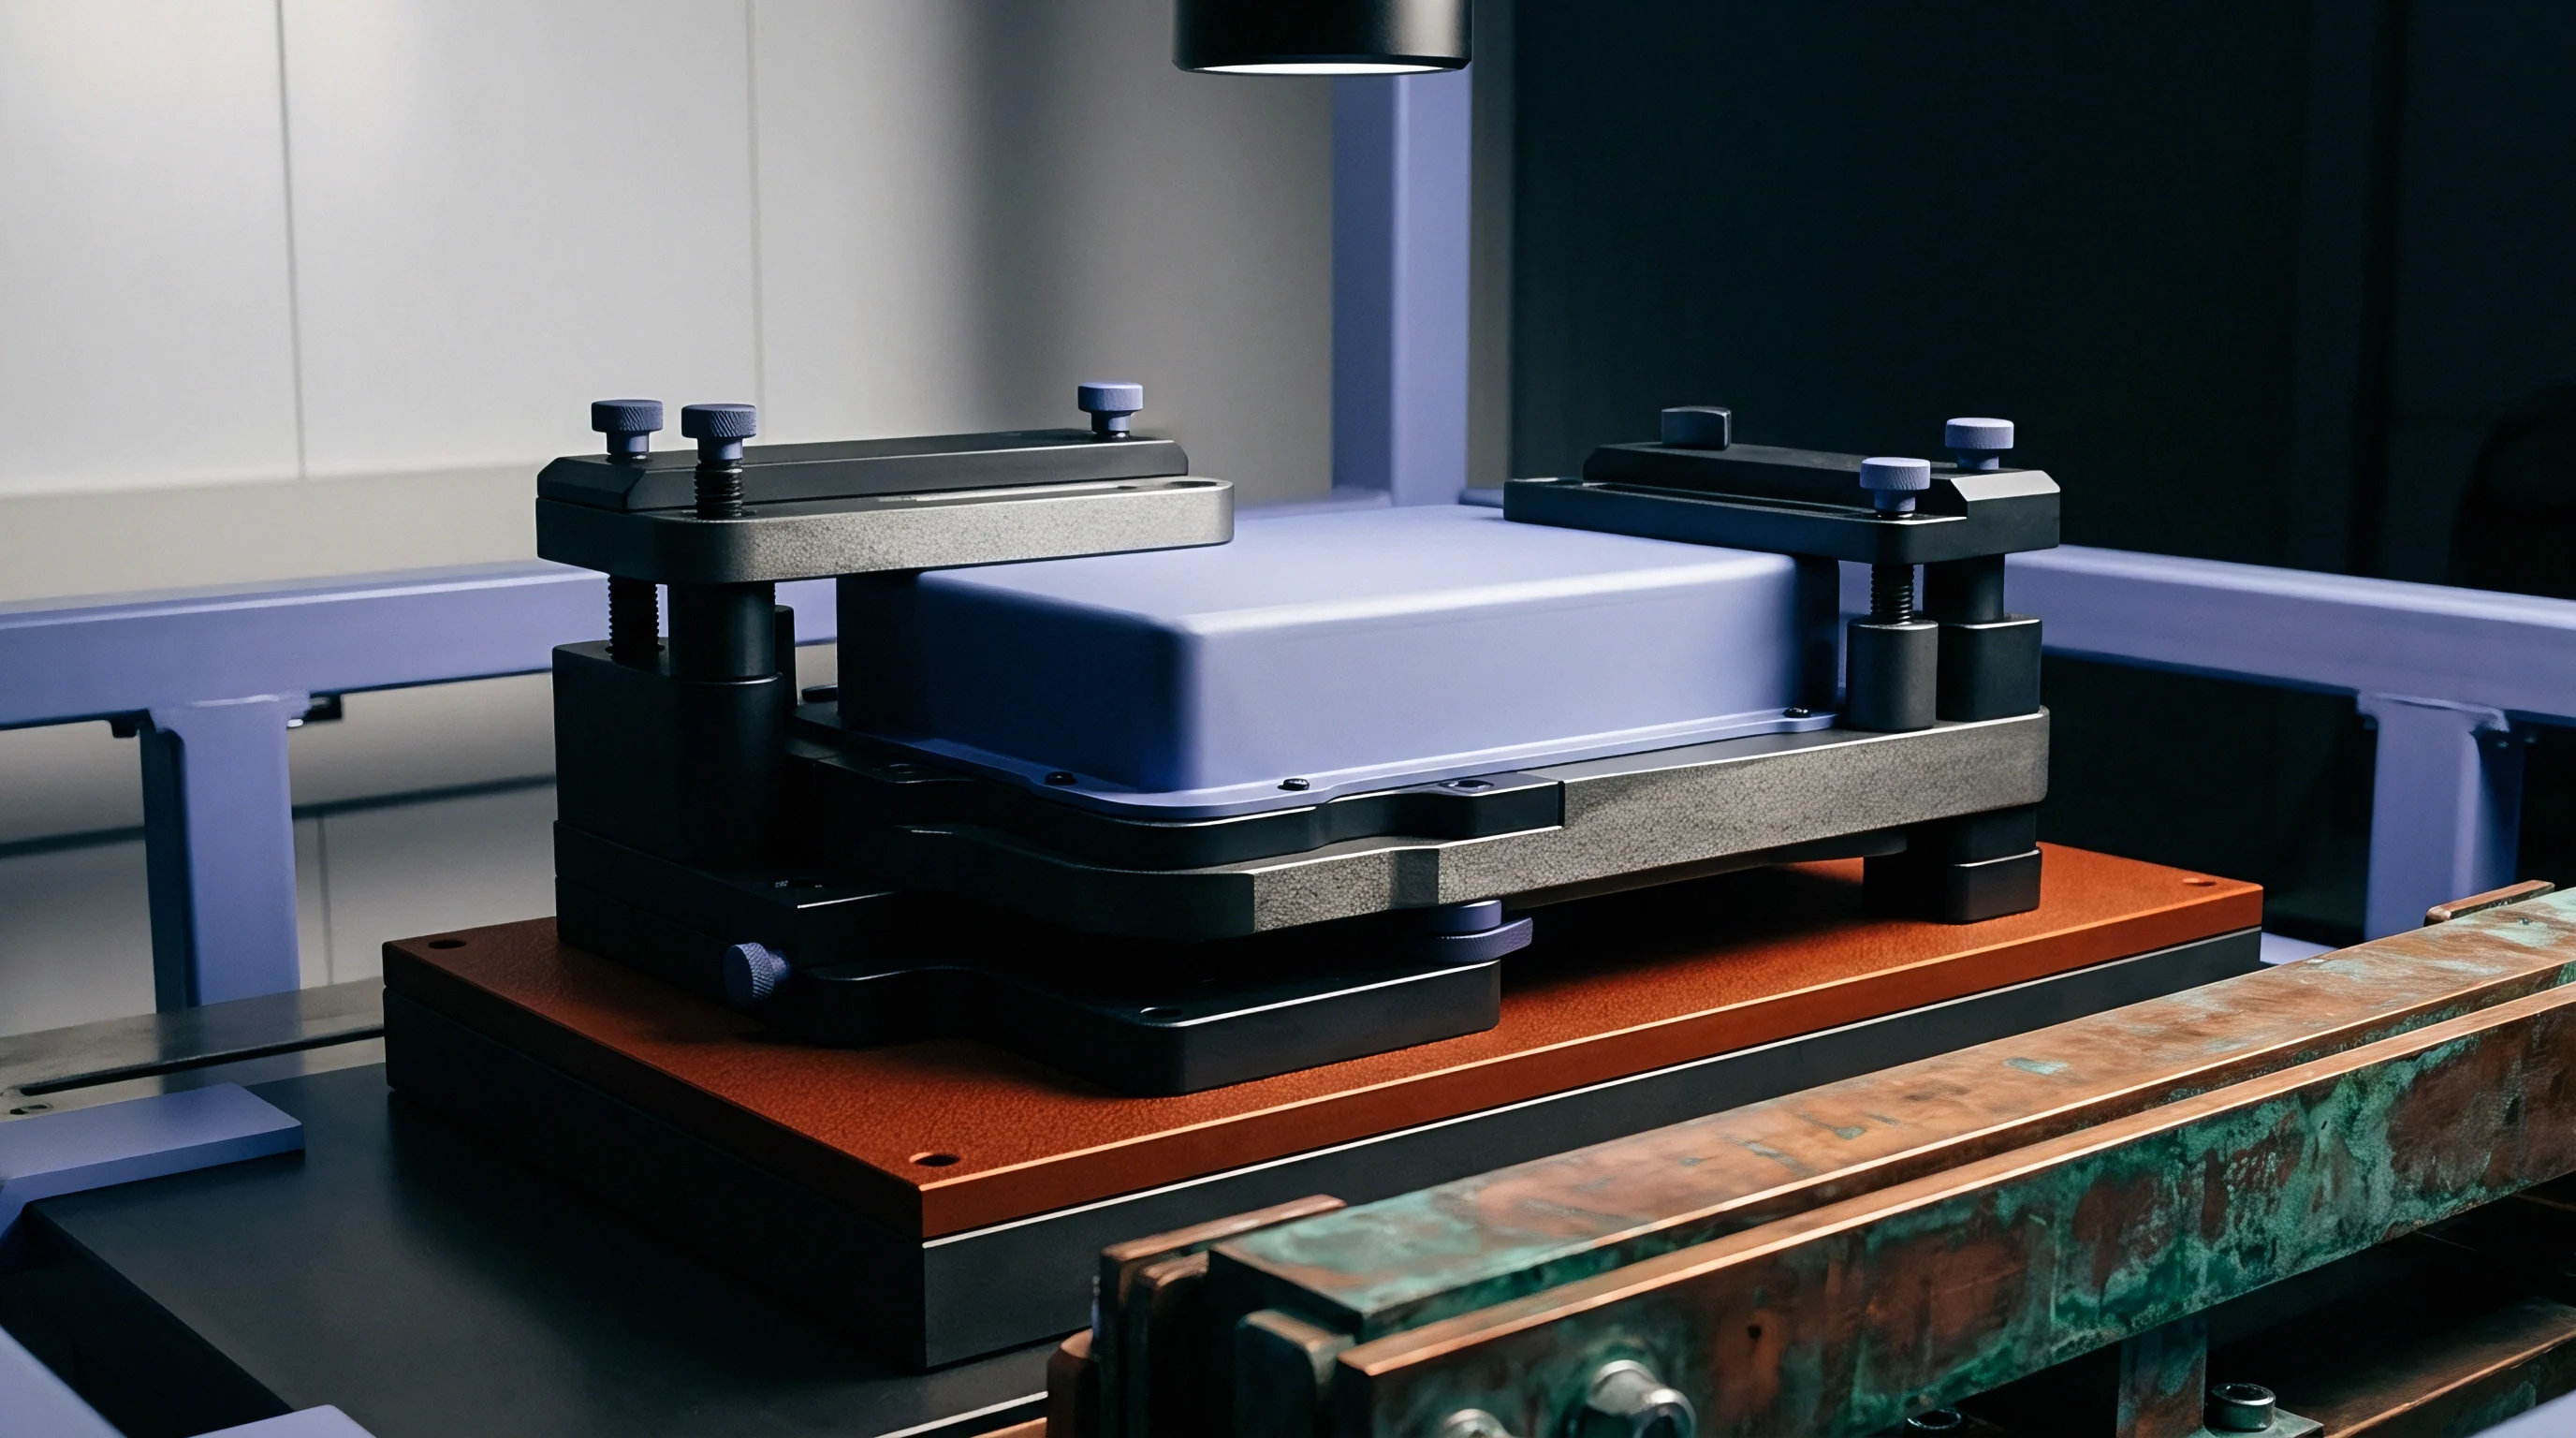
Automated cell testing relies on fast mechanical fixtures to establish four-wire Kelvin connections in fractions of a second. High-speed pneumatic actuators press spring-loaded pogo pins or copper alloy blades directly onto battery terminal surfaces. Small variations in contact resistance between test cycles add noise to low-milliohm impedance measurements.
Surface oxidation, residual electrolyte films, and mechanical alignment drift alter the primary current path, while test channels operating at ten to fifty amperes generate local voltage drops that distort AC excitation signals and DC step responses.
Four-wire Kelvin geometry isolates lead resistance when force and sense probes maintain distinct physical boundaries right up to the terminal face. Automated fixtures compromise this isolation when force and sense pins share a barrel housing or make contact through a unified terminal pad. Parasitic resistance across shared conductive paths creates offset errors that disproportionately distort one-kilohertz alternating current readings, which often measure cell impedances below 0.5 milliohms.
Direct current step measurements, operating across higher voltage drops, absorb minor contact variations into overall polarization curves but suffer when contact resistance fluctuates during pulse discharge windows.
| Probe Interface Type | Contact Force (N) | Typical Contact Resistance (mΩ) | 1 kHz AC Impedance Offset (mΩ) | 100 ms DCIR Error Contribution (%) |
|---|---|---|---|---|
| Crown-head spring pin | 3.5 to 5.0 | 0.12 to 0.45 | +0.08 to +0.25 | 1.5 to 4.2 |
| Serrated copper-beryllium blade | 12.0 to 18.0 | 0.03 to 0.08 | +0.01 to +0.04 | 0.4 to 1.1 |
| Pneumatic flat-face plunger | 25.0 to 40.0 | 0.01 to 0.03 | +0.005 to +0.015 | 0.1 to 0.5 |
| Dual-needle coaxial pogo | 2.0 to 4.0 | 0.20 to 0.60 | +0.15 to +0.40 | 2.8 to 7.5 |
Loss of spring force alters how deeply pins penetrate surface aluminum oxide or nickel plating layers. Plating debris collects inside pin crowns over ten thousand insertion cycles, raising interface impedance unpredictably. High-frequency excitation signals pass through parasitic capacitive paths between closely spaced force and sense wiring inside the actuator assembly.
Direct current steps bypass capacitive coupling, but localized Joule heating at microscopic contact points converts variable contact resistance into phantom thermal voltage shifts.
- Force pin contamination elevates local contact resistance, shifting excitation phase angles during high-frequency AC sweeps and artificially inflating DC voltage drops.
- Sense pin oxidation creates non-linear, diode-like junction effects that distort low-amplitude AC waveforms while leaving high-current DC step readings unaffected.
- Mechanical misalignment reduces contact surface area, elevating pin self-inductance and pushing high-frequency reactive measurements into positive phase territory.
- Barrel wear in spring pins permits lateral tip deflection, introducing intermittent contact resistance spikes across sequential test cycles.
Holding contact resistance variations below fifty microohms requires rigid mechanical guides, pneumatic force monitoring, and regular tip cleaning schedules. Unstable contact physics remain a primary driver of measurement divergence between automated channels and benchtop manual fixtures. Pin degradation is often treated as an operational variable driven by incoming cell terminal contamination rather than fixture engineering.

Frequency
Divergence between alternating current and direct current impedance measurements originates in the fundamental electrochemistry of the cell. Standard automated production equipment measures AC impedance at a fixed frequency of one kilohertz. This fast sinusoidal stimulus probes rapid physical processes within the cell structure: bulk electrolyte resistance, separator tortuosity, and surface film electronic conductivity dominate the response at this time scale.
The single-frequency AC measurement captures pure ohmic resistance alongside minor contributions from surface passivation layers.
Direct current impedance testing applies a continuous current step lasting from tens of milliseconds to several seconds. Current flows across the electrode interfaces, driving electrochemical charge transfer and concentration shifts. The resulting voltage drop reflects ohmic resistance, charge transfer resistance across the solid-electrolyte interphase, double-layer capacitance discharge, and mass transport diffusion through active material particles.
Direct current resistance measurements integrate kinetic and thermodynamic transport limitations that remain invisible to a one-kilohertz AC signal.
1 kHz AC impedance captures pure ohmic resistance while 100 ms DC pulses incorporate charge transfer kinetics that elevate total measured resistance by 15 to 45 percent.
Cell charge state and ambient temperature scale these two metrics at different rates. Alternating current ohmic impedance varies modestly with temperature, driven primarily by electrolyte viscosity changes. Direct current resistance exhibits strong thermal sensitivity because charge transfer reaction rates follow Arrhenius kinetics.
At zero degrees Celsius, charge transfer resistance expands rapidly, widening the numerical gap between one-kilohertz AC measurements and DC pulse resistance by up to three hundred percent.
Phase angle shifts during high-frequency AC excitation introduce imaginary impedance components. When automated test fixtures calculate impedance magnitude directly from peak voltage and current values, they combine real ohmic resistance with reactive inductive components. High-frequency current distribution inside large prismatic cell terminals also forces current to the outer edges via skin depth effects, altering internal path resistance.
Direct current steps eliminate skin depth constraints, enforcing uniform current density throughout terminal cross-sections after initial capacitive ring-down fades.
Electrochemists map these behaviors across the complex impedance plane using multi-frequency electrochemical impedance spectroscopy. Production lines forgo full spectral sweeps due to cycle time constraints exceeding thirty seconds per cell. Single-point one-kilohertz AC testing provides a five-millisecond snapshot, but it fails to track charge-transfer degradation occurring over battery operational life.
Test engineers remain unable to define a static universal conversion factor that converts one-kilohertz AC resistance values into equivalent DC pulse values across varying cell chemistries and temperatures.
Coupling
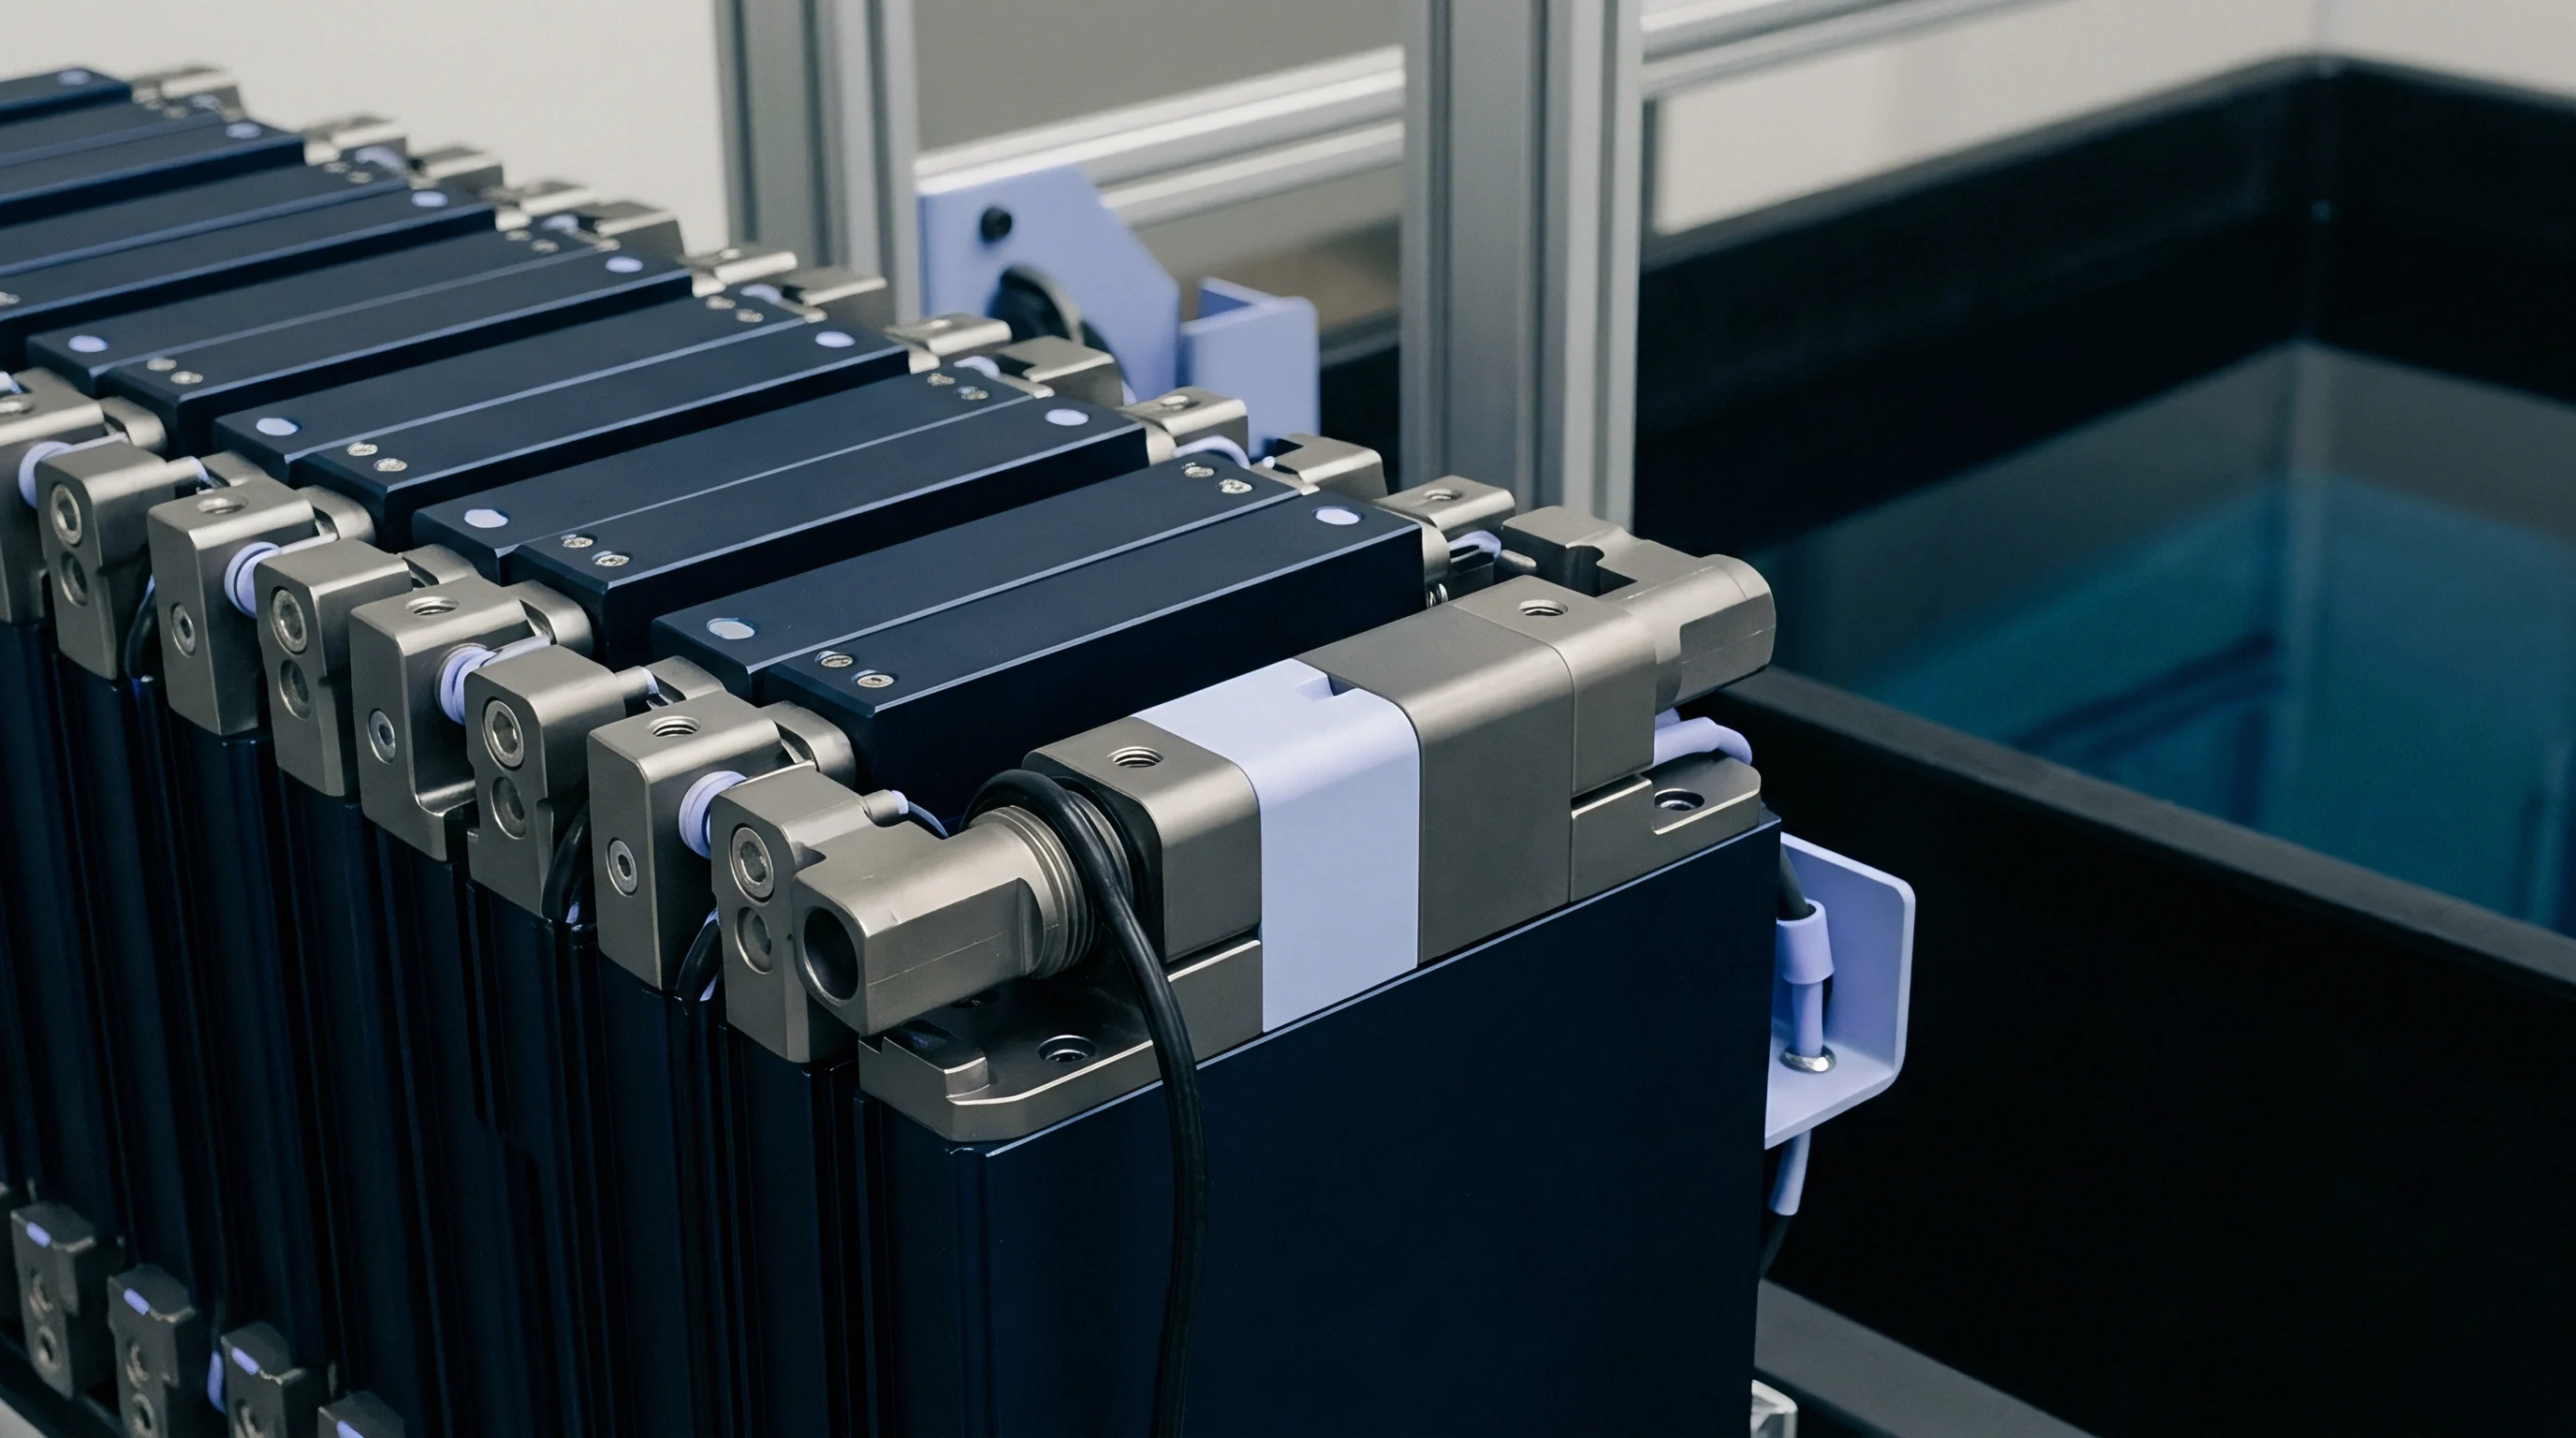
Automated test trays arrange tens or hundreds of test channels in close physical proximity to achieve required throughput levels. High-density wiring harnesses route parallel power and sense lines from instrument racks to fixture contact blocks. Current pulses carried by active channels induce electromagnetic fields that link into neighboring sense loops.
Mutual inductance between adjacent cables creates signal cross-talk during rapid current transients or high-frequency AC excitation.
Unshielded sense leads running parallel to high-current force leads act as secondary transformer windings. A ten-ampere peak-to-peak AC signal at one kilohertz generates a changing magnetic flux that induces parasitic voltages across adjacent measurement circuits. Induced phase shifts rotate measured complex impedance vectors into the inductive quadrant, artificially inflating the real resistance calculated by phase-sensitive demodulators.
Direct current pulse testing experiences inductive spikes at pulse turn-on and turn-off edges, requiring voltage sampling delays to avoid transient field corruption.
| Cable Configuration | Loop Inductance (nH/m) | Mutual Coupling Ratio (dB) | 1 kHz Real Resistance Error (mΩ) | 10 ms DCIR Transient Ringing Time (µs) |
|---|---|---|---|---|
| Unshielded parallel leads | 850 to 1200 | -22 to -16 | +0.18 to +0.45 | 450 to 1200 |
| Twisted pair force and sense | 220 to 380 | -38 to -30 | +0.04 to +0.12 | 120 to 310 |
| Individual coaxial cables | 45 to 85 | -62 to -52 | +0.008 to +0.025 | 15 to 45 |
| Triaxial driven shield cable | 12 to 28 | -78 to -68 | +0.001 to +0.005 | 3 to 10 |
Spatial geometry within the test bay dictates loop area parameters. Large loop areas formed between positive and negative force cables amplify self-inductance. High self-inductance retards DC pulse rise times, blunting sharp edge transitions needed for precise millisecond-level internal resistance extraction.
High-frequency AC measurements suffer as self-inductive reactance eclipses microohm-level real resistance values, degrading measurement signal-to-noise ratios.
IEC 61960 mandates four-terminal Kelvin connections with twisted-pair coax configurations to prevent external inductive cross-talk from corrupting microohm resistance values.
Ground loops between multi-channel power supplies and measurement acquisition cards create parallel current return paths. Stray DC currents flowing through ground planes inject offset voltages into sensitive analog-to-digital converters. High-frequency common-mode noise generated by adjacent switch-mode power supplies bleeds through parasitic channel-to-channel capacitances, swamping low-level AC excitation signals.
Failure to isolate channel grounds distorts both AC and DC measurements, producing spatial divergence patterns across channel locations on the same tray platform.
Fixing electromagnetic coupling requires systematic line isolation, physical separation of power and signal paths, and strict shield grounding topologies. Shielding integrity dictates signal purity. Omitting coaxial shielding in high-speed automated fixtures transforms high-density wiring harnesses into distributed inductive radiators, destroying cross-channel data integrity and forcing costly false scrap events.
Trimming
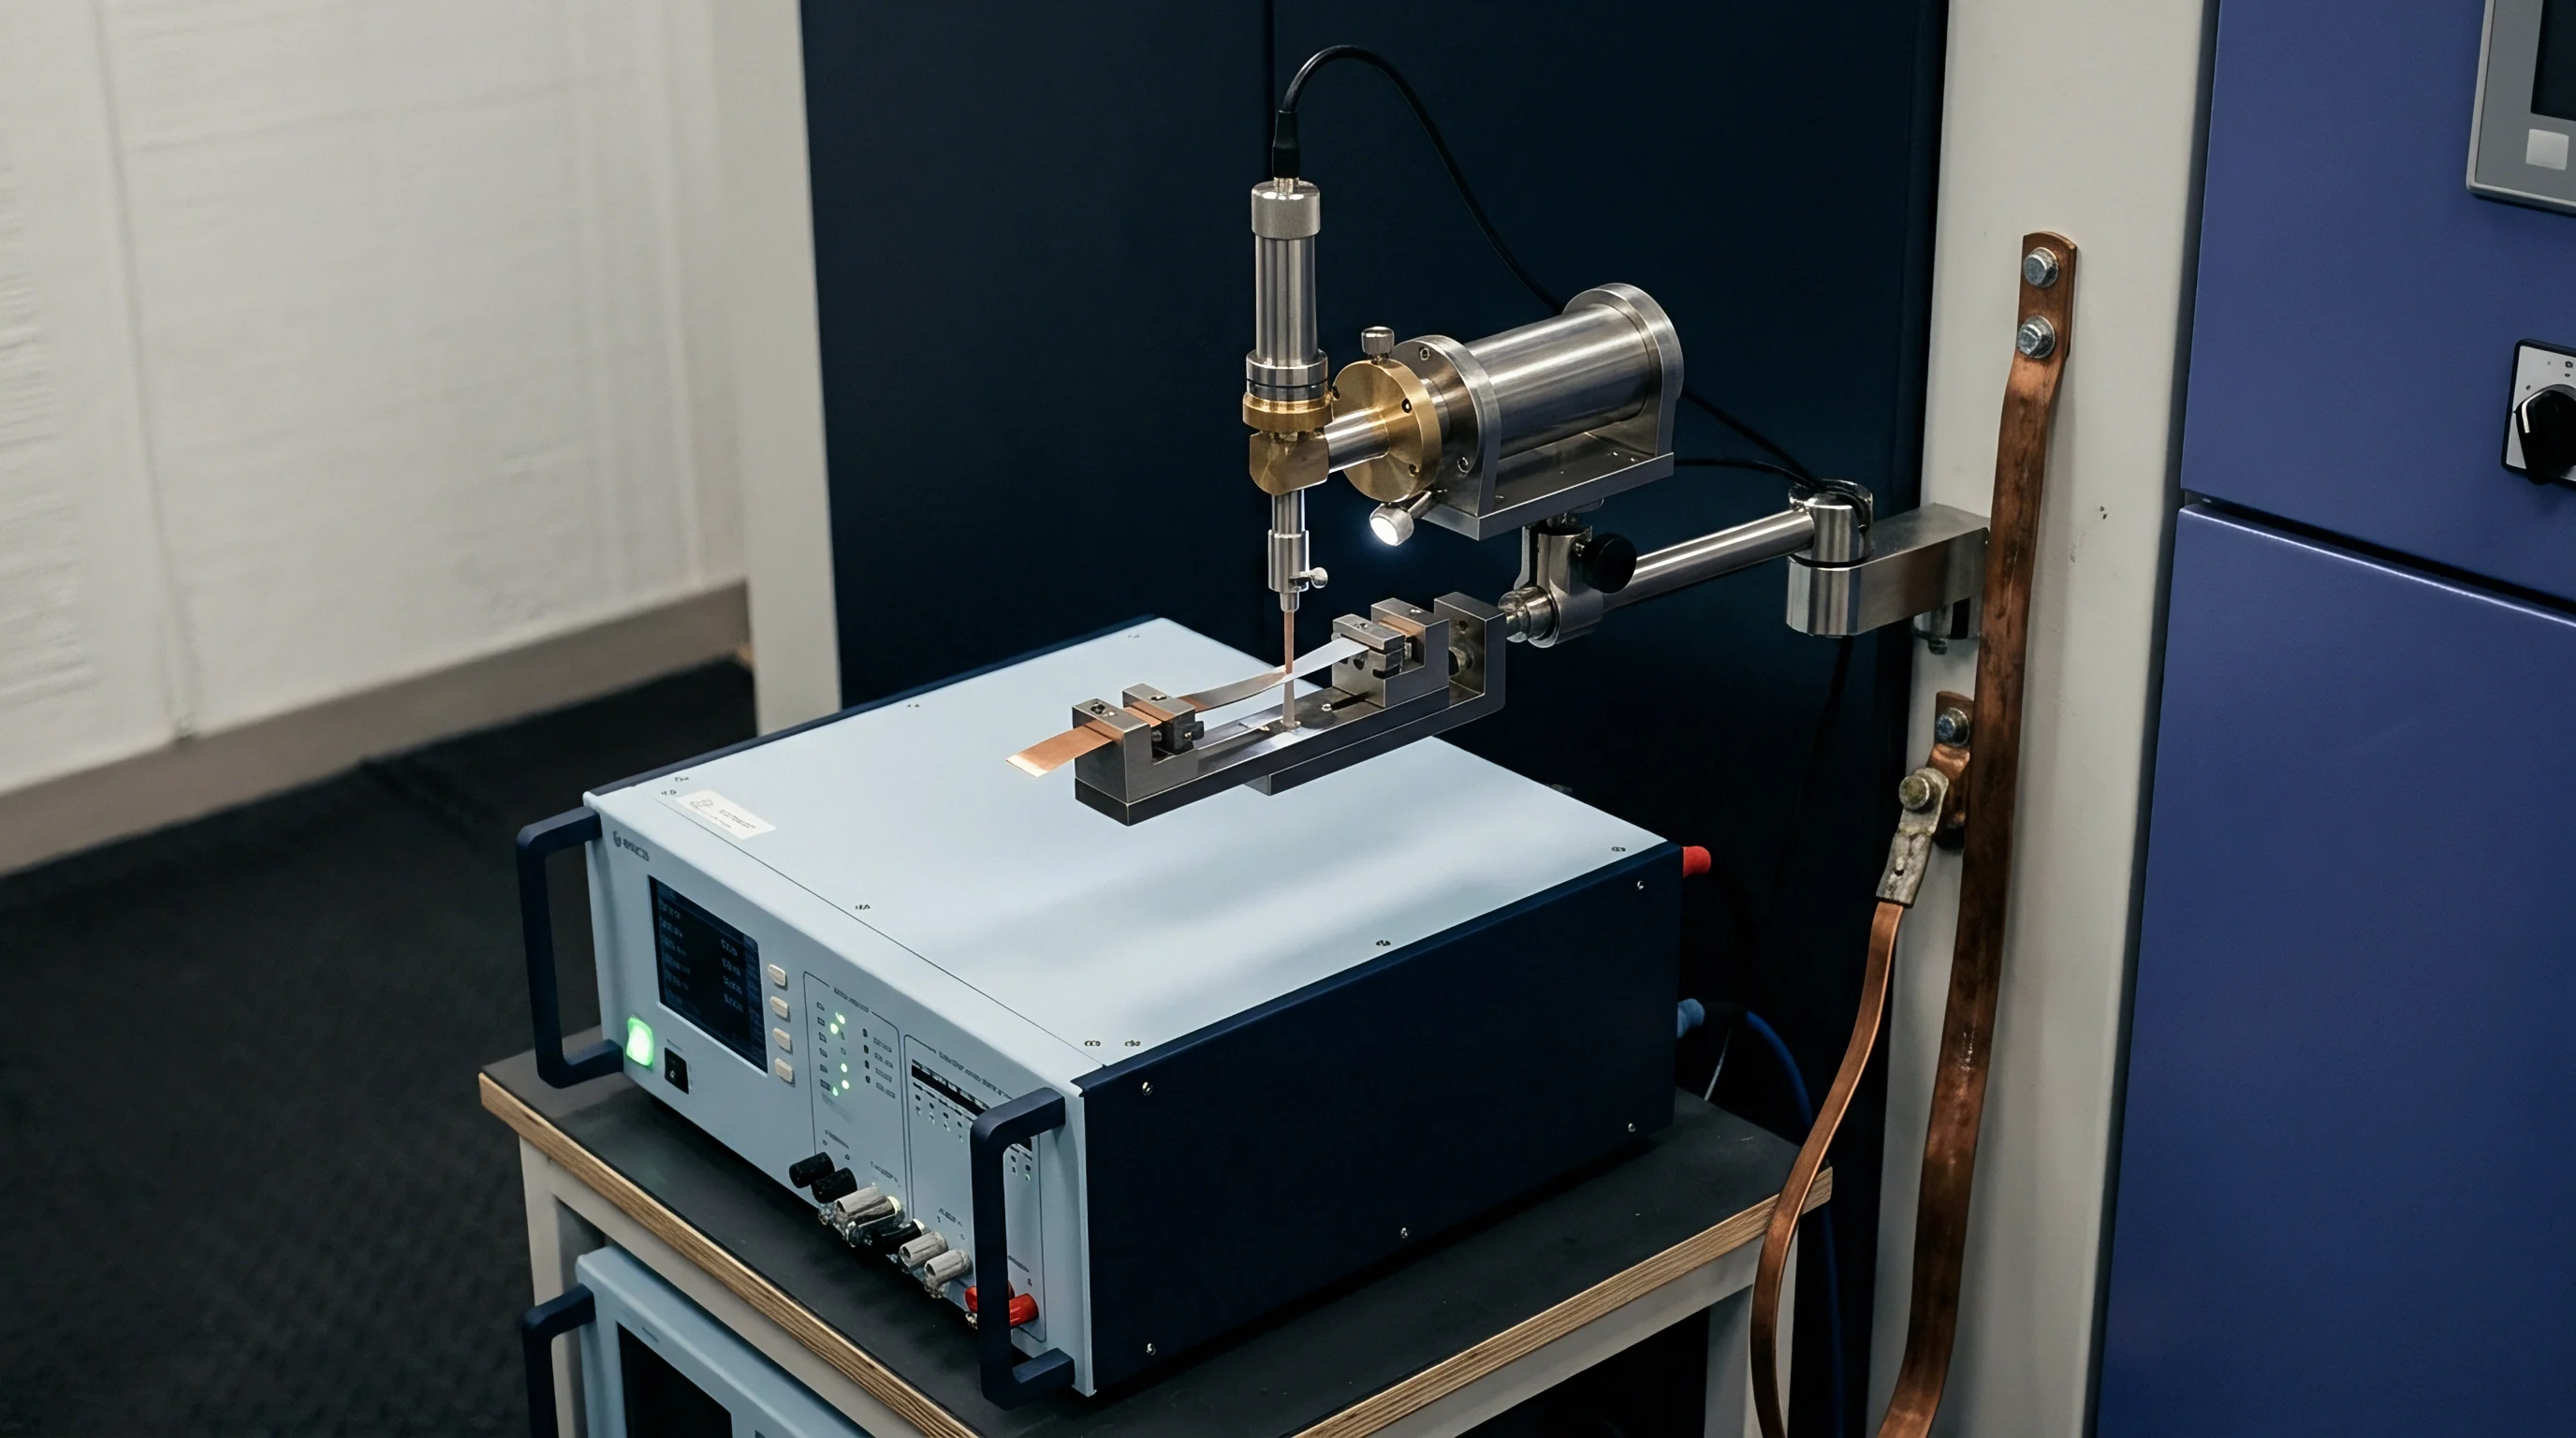
Resolving fixture divergence requires rigorous parasitic removal through active matrix compensation and system calibration. Raw impedance measurements produced by automated channels combine cell characteristics with system lead inductance, contact resistance, trace capacitance, and multiplexer path resistance. Fixture de-embedding isolates the cell impedance by mathematically subtracting system parasitic matrices measured under standardized reference conditions.
Short-Open-Load calibration protocols adapt classical microwave vector network analyzer techniques to milliohm battery test channels. Short calibration replaces the cell with a solid copper zero-resistance fixture block, capturing series inductance and lead resistance. Open calibration isolates contact probes in air, recording parallel parasitic capacitance and leakage conductance.
Load calibration connects precise low-inductance shunt resistors across the probes, establishing phase and magnitude accuracy across the measurement spectrum.
- Position precision copper shorting blocks into all fixture channels using standard pneumatic contact pressure.
- Run high-frequency AC vector sweeps and DC pulse steps to record baseline lead impedance matrices.
- Retract pneumatic actuators to suspend contact pins in free space for open-circuit admittance characterization.
- Engage non-inductive foil standard resistors across all channels to calculate complex scaling factors and phase corrections.
- Store channel-specific compensation arrays inside local acquisition firmware for real-time de-embedding during production runs.
- Repeat automated compensation sweeps every four hours to account for thermal drift in cabling and electronic driver circuits.
Real-time contact impedance tracking complements static calibration arrays. Dual-voltage sensing circuits monitor voltage drops across force pins during current injection, detecting dynamic contact degradation before it corrupts cell measurements. When pin resistance exceeds pre-set thresholds, system firmware adjusts de-embedding coefficients or alerts operators to inspect probe hardware.
Zero-drift analog switches and autozeroing amplifiers clear DC amplifier thermal offsets between test cycles.
Mathematical phase correction aligns AC real impedance with DC step ohmic baselines. High-speed signal processors compute real and imaginary vector components, stripping phase lag introduced by multiplexer switching networks. While system calibration removes static fixture parasitics and brings measurement channels into agreement, it cannot compensate for mechanical pin shift or contact contamination occurring between calibration intervals.
De-embedding algorithms must calculate phase shifts dynamically to maintain impedance measurement accuracy below one milliohm across multi-channel trays.
Thermal stability across instrumentation racks preserves calibration validity. Ambient temperature swings shift analog filter response curves and switch resistance in solid-state multiplexers. Uncontrolled plant environments render four-hour calibration matrices obsolete within ninety minutes.
Maintaining stable thermal control inside test cabinets remains necessary to hold de-embedded channel divergence within five microohms over extended production runs.
Sorting
Battery manufacturing lines rely on precise impedance measurements to grade and bin incoming cells before pack integration. Automated cell triage splits production volumes into narrow performance bands to ensure balanced current sharing in parallel module branches. Unresolved divergence between one-kilohertz AC testing and DC pulse testing creates false binning classifications, routing misaligned cells into high-performance packs.
A cell showing low one-kilohertz AC resistance may still possess degraded charge-transfer kinetics due to localized cathode damage or solid-electrolyte interphase thickening. High-frequency AC inspection passes the cell because electrolyte conductivity remains nominal. Subsequent DC pulse testing reveals elevated total resistance, exposing charge transfer bottlenecks that induce localized overheating during fast-charging operations.
Relying solely on AC metrics allows kinetically flawed cells to reach production streams.
| Evaluation Metric | False Acceptance Rate (%) | False Scrap Rate (%) | Bin Distribution Variance (%) | Pack Thermal Imbalance Risk |
|---|---|---|---|---|
| 1 kHz AC impedance only | 4.8 to 8.2 | 0.3 to 0.8 | ±12.5 | High |
| 100 ms DCIR step only | 0.8 to 1.5 | 3.5 to 6.2 | ±8.0 | Moderate |
| Dual AC/DC composite gating | 0.1 to 0.3 | 1.2 to 2.1 | ±2.5 | Low |
| Uncompensated AC signal | 12.0 to 18.5 | 8.5 to 14.0 | ±28.0 | Severe |
False scrap rates impose heavy economic losses on cell manufacturing plants. Uncompensated fixture lead inductance adds artificial positive reactance to one-kilohertz AC readings, raising calculated impedance magnitudes above upper rejection limits and causing sound cells to be discarded as defective. Parasitic variation across channels generates false variance in cell populations, broadening sorting bins and forcing manufacturers to hold larger safety margins.
Consider a production lot of 50,000 prismatic lithium iron phosphate cells evaluated on an automated line. Sorting criteria mandate a maximum 100-millisecond DC resistance of 0.60 milliohm. The factory line uses a fast 1 kilohertz AC tester calibrated to a 0.40 milliohm threshold, assuming a fixed 0.20 milliohm offset.
Uncalibrated contact pin oxidation introduces an average +0.08 milliohm contact error across 10 percent of channels. This parasitic shift artificially elevates measured AC resistance to 0.48 milliohm, causing the automated system to misclassify 5,000 good cells as scrap. The financial loss from discarded tier-one cells far outweighs the cost of upgrading fixture contact hardware and calibration routines.
Dual-metric screening resolves false classification issues by combining high-speed AC sweeps with short DC pulses. The fast AC check validates basic metallic welds, tab integrity, and electrolyte fill status in under ten milliseconds. A subsequent fifty-millisecond DC pulse extracts true kinetic resistance, confirming charge transfer health.
Implementing dual-metric screening stops low-quality cells from entering pack streams while protecting plant margins against unnecessary scrap penalties.
Harmonized sorting protocols demand clear metric definition within purchasing technical specifications. Specifying cell internal resistance without defining pulse duration, temperature, charge state, and measurement frequency leaves delivery criteria open to interpretation. Purchase contracts specifying IEC 62660-1 test conditions bind suppliers to rigorous DC step methodologies, suppressing disputes over cell arrival quality.
Stipulation
Procurement agreements for battery cells and automated manufacturing lines must explicitly define impedance measurement parameters to avoid commercial liability. Cell datasheets typically quote one-kilohertz AC impedance due to its ease of execution on rapid production channels. Module and pack integration engineers require DC resistance figures to calculate real-world thermal loads and continuous power delivery limits.
Contractual specifications bridge this gap by enforcing dual-metric target windows tied to explicit test standard clauses.
Technical clauses must detail fixture design standards alongside measurement methodologies. Specifying four-wire Kelvin pin mechanics, maximum allowable contact resistance variations, and mandatory calibration intervals ensures incoming inspection lines mirror factory grading channels. Without fixture specifications, measurement divergence can easily be attributed to customer test fixture parasitics and contact degradation rather than cell quality.
Supply agreements incorporating clear de-embedding requirements protect buyers against false grading claims. Quality verification annexes stipulate that cell acceptance decisions rest on DC pulse testing conducted under tightly controlled environmental conditions. When factory AC screen numbers diverge from incoming DC inspection results, contractually mandated arbitration routines perform multi-frequency impedance spectroscopy sweeps to isolate electrolyte degradation from kinetic interface failures, assigning financial responsibility according to clear electrochemical evidence.