Sodium Ion Battery Hard Carbon Anode Precursor Selection Standards
Precursor selection for sodium ion hard carbon anodes dictates closed pore volume, surface area, initial coulombic efficiency, and landed material cost.
Resin
Primary feedstocks for non-graphitizable carbon anodes fall into synthetic polymers, biopolymers, and cross-linked fossil pitches. Each precursor family exhibits distinct chemical bonding patterns, aromatic condensation degrees, and heteroatom ratios that dictate structural evolution during heat treatment. Unlike graphitizable carbons derived from soft pitches or synthetic graphite, hard carbons require raw materials that maintain an isotropic, disordered molecular matrix up to elevated thermal thresholds.

Synthetic Polymer Networks
Phenolic condensed structures offer high carbon conversion rates while maintaining disordered atomic packing during thermal decomposition. Resole and novolac resins cross-link through formaldehyde bridges, forming rigid three-dimensional thermosetting networks whose non-melting behavior prevents graphitic layer alignment during pyrolysis. Epoxy resins, furfuryl alcohol polymers, and polyacrylonitrile resins operate through similar structural retention mechanisms.
The high density of oxygen-containing functional groups in thermosetting polymers forces early structural cross-linking, trapping short-range disorder and generating high volumes of closed internal voids upon carbonization.
Biopolymer and Plant Derived Matrices
Lignin, cellulose, and nutshell feedstocks present distinct oxygen-to-carbon stoichiometry that dictates cross-linking density during pyrolysis. Agricultural residues such as coconut shells, walnut shells, and rice husks provide natural polymeric architectures rich in aromatic rings and ether linkages. Lignin possesses a complex phenylpropanoid framework with high natural carbon yields, whereas carbohydrates like sucrose and glucose undergo dehydration and polymerization under acid catalysis to yield spherical hard carbon particles.
Oxygen content above 35 weight percent in raw biopolymers promotes early aromatic cross-linking, suppressing graphitic domain growth and preserving random atomic stacking.

Cross Linked Pitch Chemistry
Coal tar and petroleum distillation residues demand air stabilization to force thermosetting behavior before carbonization. Untreated coal tar pitch and petroleum asphalt behave as thermoplastic materials, melting and forming aligned graphitic domains above 400 degrees Celsius. Introducing oxygen through low-temperature thermal stabilization between 200 degrees Celsius and 300 degrees Celsius creates oxygen bridge linkages across aromatic rings.
This oxidative processing converts thermoplastic pitch into a non-melting thermoset precursor, enabling the generation of turbostratic hard carbon with extensive closed porosity.
| Precursor Class | Oxygen-to-Carbon Atomic Ratio | Precursor Carbon Yield (%) | Thermosetting Trait | Target Anode ICE (%) |
|---|---|---|---|---|
| Phenolic Novolac Resin | 0.15 to 0.25 | 55 to 65 | Intrinsic Thermoset | 88 to 92 |
| Kraft Lignin Biomass | 0.35 to 0.50 | 38 to 48 | Partial Thermoset | 84 to 89 |
| Sucrose Carbohydrate | 0.80 to 0.90 | 30 to 38 | Dehydration Required | 82 to 87 |
| Air-Treated Petroleum Pitch | 0.05 to 0.12 | 70 to 80 | Oxidized Thermoset | 86 to 90 |
| Coal Tar Pitch Derivative | 0.03 to 0.08 | 72 to 82 | Oxidized Thermoset | 85 to 89 |
High oxygen content in raw precursors promotes early cross-linking that prevents graphitic domain alignment during heat treatment.
Selecting synthetic resins yields consistent batch-to-batch chemical purity at higher raw material cost, whereas natural biomass sources introduce cost advantages alongside seasonal chemical variance. Coal tar and petroleum pitch precursors present lower procurement costs but add chemical oxidation steps and environmental scrubbing overhead to processing facilities. Whether low-cost agricultural waste streams can match the batch-to-batch chemical uniformity of synthetic polymers without inflating purification overhead remains an open industrial question.

Furnace
Thermal processing converts raw carbonaceous compounds into disordered sp2 carbon frameworks while driving off volatile light species. Thermal conditions control the transition from organic polymer networks to turbostratic carbon crystallites. Heat exposure governs the removal of functional groups, the shrinkage of aromatic domains, and the final volume of closed micropores that house active sodium ions.
Thermal Profile Parameters
Pre-carbonization between 400 degrees Celsius and 600 degrees Celsius removes oxygenated volatiles and establishes the carbonaceous skeleton. Slow heating rates during this initial devolatilization stage prevent particle bursting and structural macro-void formation. Subsequent high-temperature carbonization between 1000 degrees Celsius and 1400 degrees Celsius drives out residual heteroatoms while initiating turbostratic domain rearrangement.
Exceeding 1400 degrees Celsius causes rapid shrinkage of interlayer spacing, collapsing closed pores and lowering overall sodium storage capacity.

Atmospheric Control and Gas Velocity
High-purity nitrogen or argon sweep streams prevent surface oxidation while carrying pyrolytic vapor away from the reaction bed. Inadequate gas flow leads to the secondary deposition of volatile tars onto particle surfaces, forming dense non-porous carbon skins that restrict ion diffusion rates. Maintaining positive furnace pressure and monitoring outlet tar condensation units ensures complete evacuation of volatile pitch vapor throughout thermal processing.
- Preheat raw precursor feedstock under inert argon atmosphere to 300 degrees Celsius at a heating rate of 5 degrees Celsius per minute.
- Maintain thermal hold at 500 degrees Celsius for two hours to complete devolatilization and gas venting without particle rupture.
- Ramp furnace temperature to 1200 degrees Celsius at 3 degrees Celsius per minute to induce turbostratic carbon crystallization.
- Dwell at 1200 degrees Celsius for three hours to develop closed micropore structures while maintaining disordered crystallite orientation.
- Cool reaction vessel to ambient room temperature under continuous nitrogen gas flow exceeding two liters per minute.
Managing thermal processing profile precision directly dictates the balance between open surface defect density and internal void volume. Faster thermal ramp rates generate wider pore openings, whereas longer dwell times at peak temperature promote structural shrinkage and higher material density.

Pore
Electrochemical performance depends on the balance between open surface area and internal closed void volume. Hard carbon anode materials store sodium ions through a combination of defect adsorption, interlayer intercalation, and pore filling. Controlling precursor microstructural evolution ensures high reversible capacity while suppressing irreversible surface reactions during initial battery charging cycles.

Storage Mechanisms and Voltage Profiles
Sodium ions bind to edge defects along sloping voltage regions before intercalating between turbostratic graphene layers or filling enclosed spaces during plateau discharge. Sloping capacity above 0.1 Volts relative to sodium metal corresponds to adsorption at oxygen functional groups, defect sites, and open surface micropores. Plateau capacity below 0.1 Volts corresponds to sodium intercalation into turbostratic graphene sheets with interlayer spacing d002 greater than 0.37 nanometers and filling of closed nanopores.
Maximizing plateau capacity provides stable low-voltage discharge profiles essential for energy-dense cell design.
Worked Capacity and Efficiency Calculation
Performance models evaluate how specific surface area directly limits initial active sodium recovery. Consider a 1000 kilogram batch of hard carbon anode material synthesized with a Brunauer-Emmett-Teller specific surface area of 3.5 square meters per gram, evaluated against a sodium metal reference electrode in a standard carbonate electrolyte solution. The material delivers a measured sloping capacity of 130 milliampere-hours per gram above 0.1 Volts and a plateau capacity of 190 milliampere-hours per gram below 0.1 Volts, yielding a total specific discharge capacity of 320 milliampere-hours per gram.
Irreversible capacity loss correlates with liquid electrolyte decomposition over exposed surface areas during solid electrolyte interphase formation. Assuming an empirical specific surface loss factor of 8.5 milliampere-hours consumed per square meter of exposed Brunauer-Emmett-Teller surface area, a surface area of 3.5 square meters per gram generates 29.75 milliampere-hours per gram of irreversible capacity loss. The total initial charge capacity equals 320 plus 29.75, totaling 349.75 milliampere-hours per gram.
The resulting initial coulombic efficiency equals 320 divided by 349.75, yielding 91.49 percent.
If improper precursor cross-linking or excessive devolatilization venting increases specific surface area to 8.0 square meters per gram, irreversible capacity loss rises to 68.0 milliampere-hours per gram under identical electrochemical testing conditions. Total initial charge capacity becomes 388.0 milliampere-hours per gram, while reversible discharge capacity remains capped at 320 milliampere-hours per gram. Initial coulombic efficiency drops to 82.47 percent.
This drop consumes 38.25 milliampere-hours per gram of additional active sodium inventory from the cathode during initial formation.
At a current density of 20 milliampere-hours per gram, hard carbon with a Brunauer-Emmett-Teller surface area of 2.8 square meters per gram yields an initial coulombic efficiency of 92.1 percent.
Excessive open surface area consumes active sodium inventory during initial cell formation, forcing pack designs to carry extra cathode mass that penalizes overall energy density.


Purity
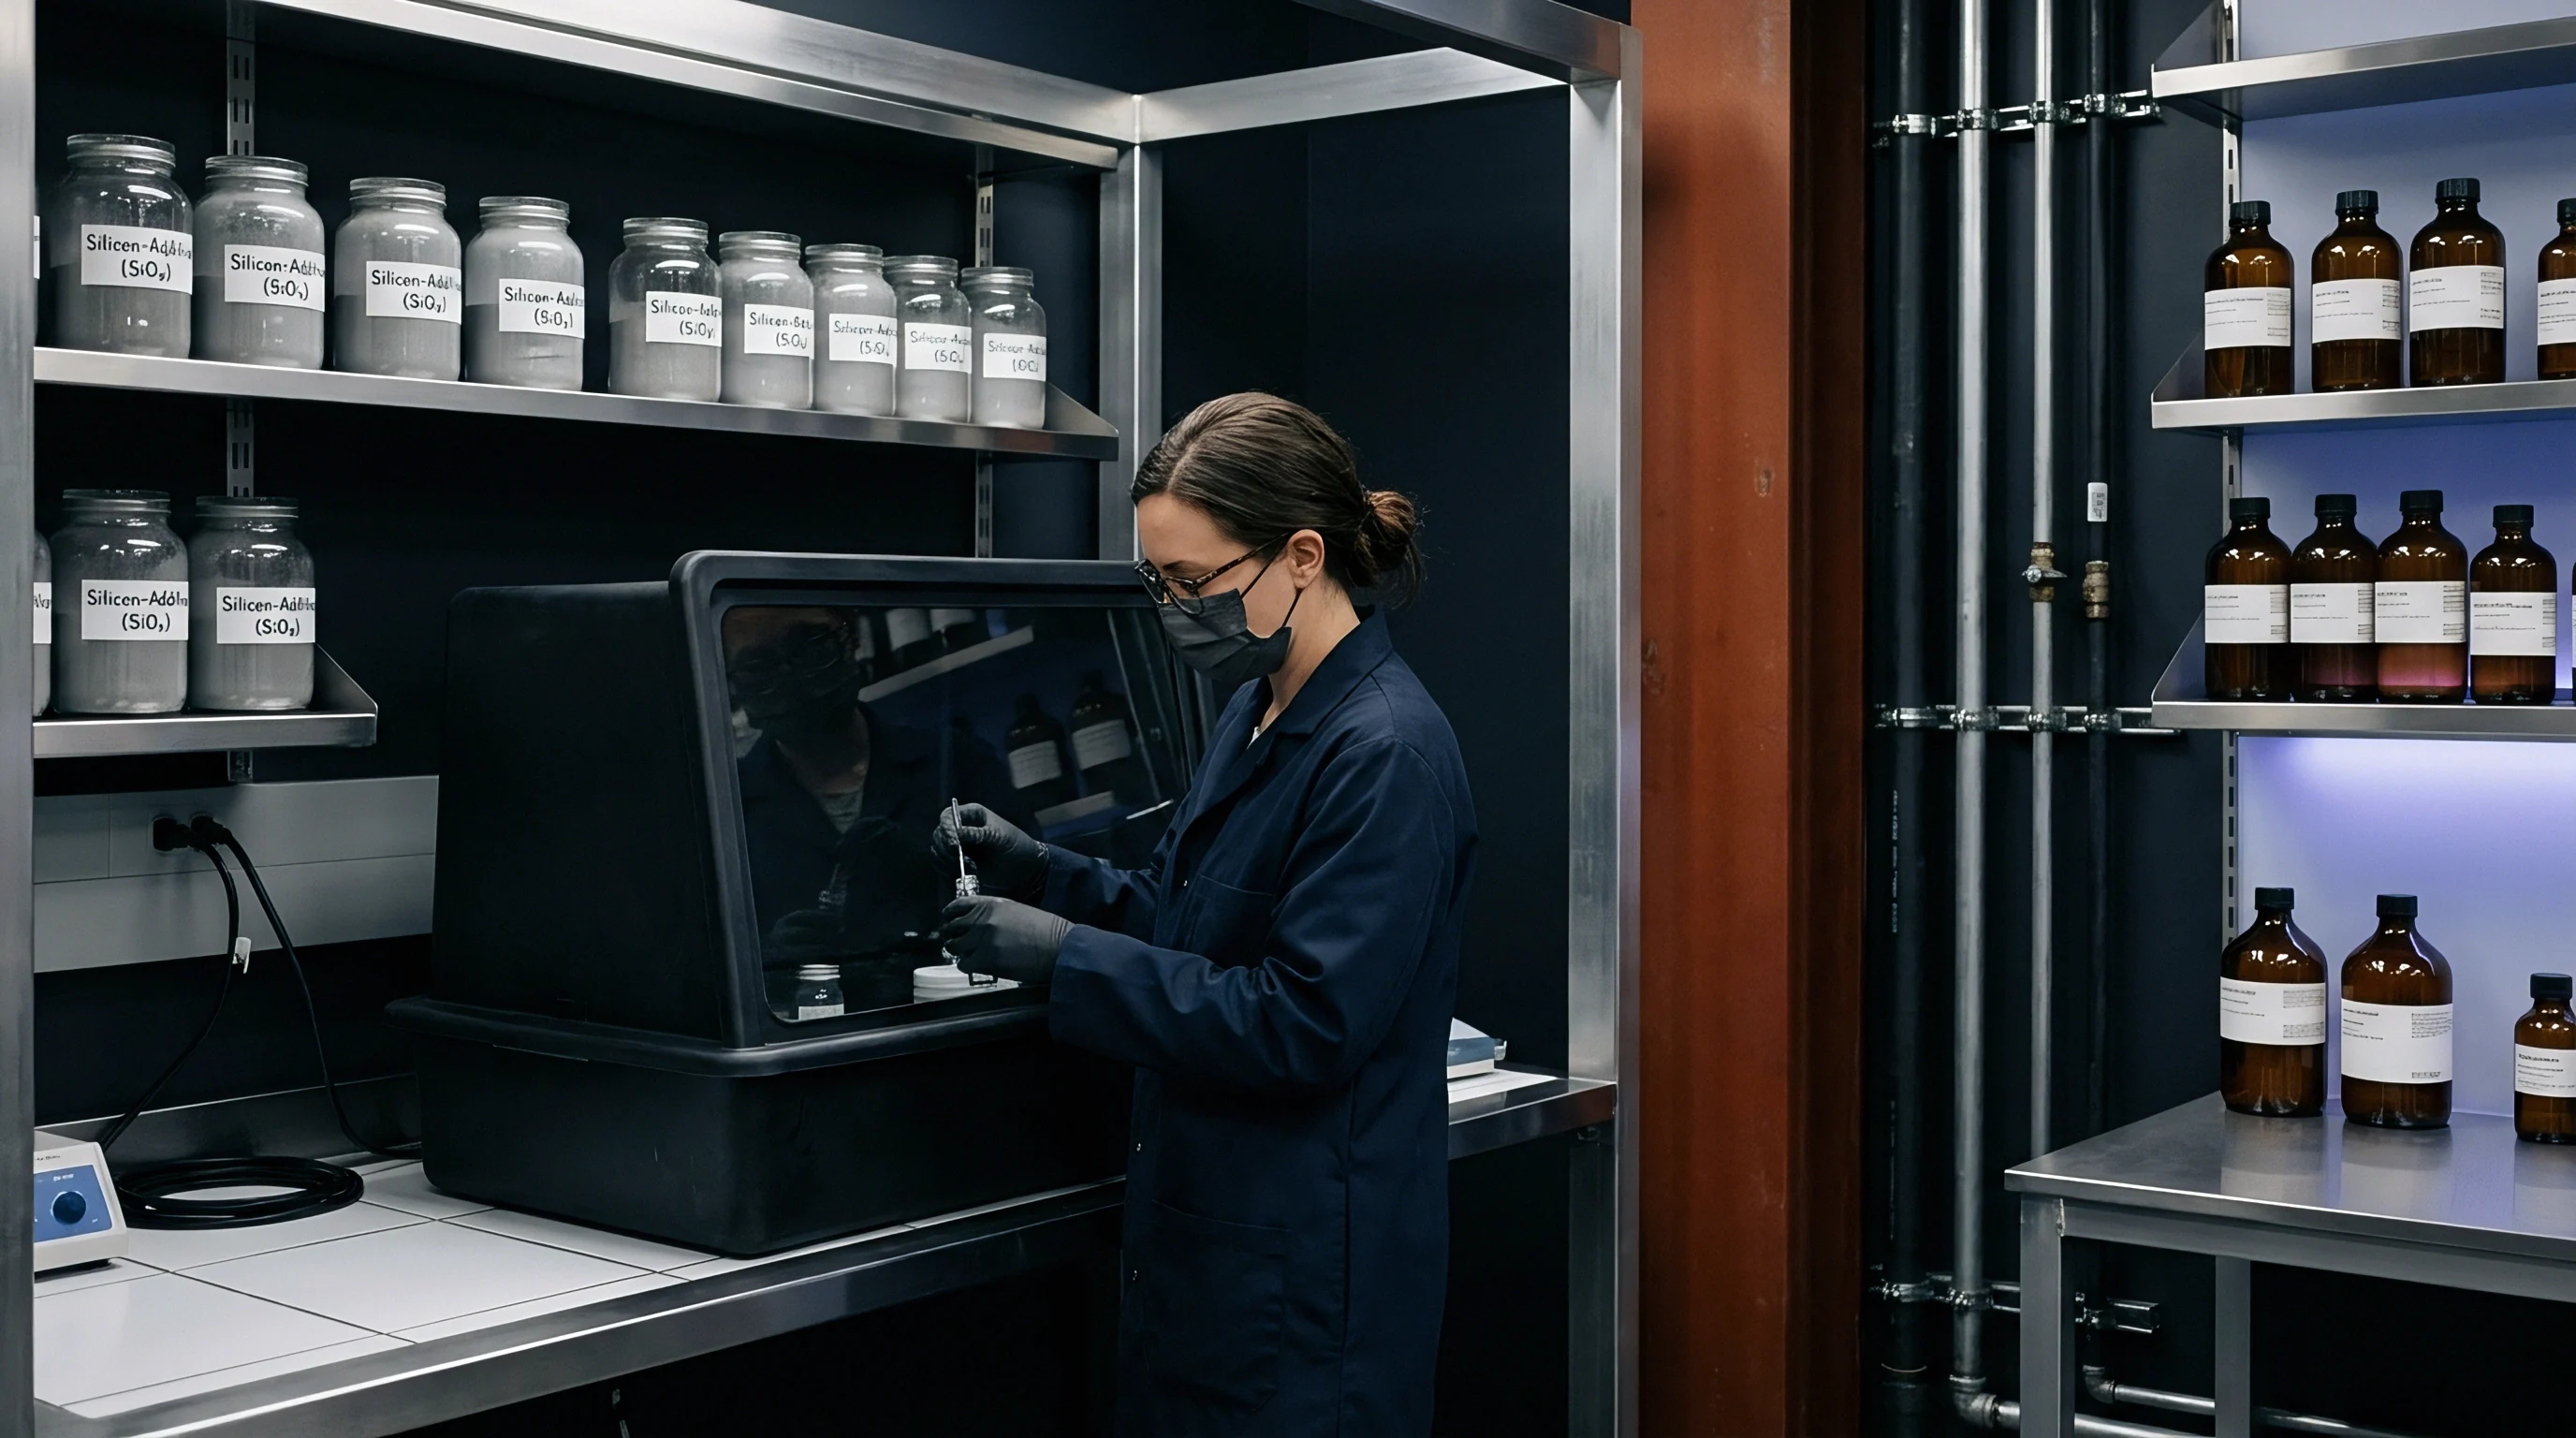
Contaminants inside precursor batches disrupt lattice formation and cause side reactions during cycling. Organic and inorganic impurities present in raw feedstocks alter pyrolysis pathways, alter surface chemistry, and accelerate electrolyte degradation during cell storage and cycling.

Are Inorganic Ash Residues Detrimental to Cell Performance?
Transition metals like iron and copper catalyze local graphitization while inducing internal micro-shorts through dendrite formation. Iron species lower the graphitization temperature threshold, causing localized domain alignment that destroys closed micropores. Trace amounts of iron, nickel, or copper promote parasitic liquid electrolyte decomposition, generating gaseous byproduct species during cycling.
Calcium, sodium, and silicon ash residues form electrochemically inactive silicate and oxide phases, reducing active material mass fraction and blocking sodium ion transport channels.
Heteroatom Doping Effects
Residual oxygen, nitrogen, and phosphorus atoms alter local electron density and expand interlayer lattice spacing. Controlled oxygen functionality increases initial surface wettability but risks elevated irreversible capacity if present as reactive carboxyl or hydroxyl groups. Phosphorus doping strengthens carbon framework stability, suppressing structural breakdown during high-rate sodium insertion.
Nitrogen atoms enhance electronic conductivity across turbostratic domain boundaries. Residual sulfur levels above threshold limits trigger gas formation and copper current collector corrosion at elevated operating temperatures.
| Contaminant Species | Maximum Limit (ppm) | Primary Feedstock Source | Electrochemical Failure Mechanism | Analytical Detection Method |
|---|---|---|---|---|
| Iron (Fe) | 10 | Synthetic Chemical Catalysts | Catalytic Graphitization and Micro-Shorts | ICP-OES Spectroscopy |
| Copper (Cu) | 5 | Biomass Processing Machinery | Dendrite Growth and Self-Discharge | ICP-OES Spectroscopy |
| Calcium (Ca) | 50 | Natural Hardwood and Shells | Ash Passivation and Channel Blocking | X-ray Fluorescence |
| Silicon (Si) | 100 | Rice Husks and Agricultural Soil | Electrochemically Inactive Mass Inflation | ICP-OES Spectroscopy |
| Sulfur (S) | 300 | Coal Tar and Petroleum Distillates | Gas Generation and Collector Corrosion | Combustion Elemental Analysis |
- Transition metal contamination introduces self-discharge pathways by migrating across the separator under high operational voltages.
- Alkali ash content reduces first-cycle charge efficiency by forming insoluble carbonate species that block ion channels.
- Sulfur residue levels above 500 parts per million cause gas evolution and swelling during elevated temperature storage tests.
- Volatile organic matter leaves behind reactive surface species that continuously degrade liquid electrolyte solutions.
Under contract specification limits, iron content exceeding 15 parts per million triggers automatic lot rejection prior to thermal processing.
Inconsistent ash figures frequently arise from seasonal variations in raw biomass harvesting conditions.
Assay
Rigorous analytical characterization validates incoming batch quality before committing to large-scale carbonization. Establishing incoming inspection criteria ensures material consistency, reduces production scrap rates, and verifies compliance with strict electrochemical specifications.

Diffraction and Structural Spectroscopy
X-ray measurements determine the average interlayer spacing d002 and crystallite height Lc of disordered domains. Bragg peak positions at the 002 reflection yield interlayer spacing values through application of Bragg’s Law. Hard carbon candidates require d002 values between 0.370 nanometers and 0.385 nanometers to permit unhindered sodium ion insertion.
Raman spectroscopy provides complementary structural insight through the intensity ratio of the disorder-induced D-band at 1350 reciprocal centimeters to the graphitic G-band at 1580 reciprocal centimeters. An intensity ratio between 0.95 and 1.15 confirms the necessary balance between structural disorder and electronic conductivity.

Gas Adsorption and Density Metrics
Helium pycnometry measures skeleton density while nitrogen isotherm analysis evaluates surface area and internal volume distributions. High skeletal density values above 1.95 grams per cubic centimeter indicate solid carbon walls with low open microporosity. Low Brunauer-Emmett-Teller surface area values below 3.0 square meters per gram confirm reduced surface defect exposure.
Tap density measurements exceeding 0.85 grams per cubic centimeter ensure adequate volumetric packing during electrode slurry coating and calendering operations.
- X-ray diffraction analysis confirms interlayer d002 spacing falls strictly within the target range of 0.370 nanometers to 0.385 nanometers.
- Raman intensity ratio tracking ID to IG peak heights verifies structural disorder required for sodium storage.
- Helium pycnometer testing ensures skeletal carbon density exceeds 1.95 grams per cubic centimeter to prevent low volumetric packing.
- Inductively coupled plasma spectroscopy quantifies metallic trace elements down to parts-per-million detection thresholds.
- Full-cell coin screening tests rate capability up to 2C discharge rates to confirm kinetic performance before commercial scale-up.
Structural disorder in hard carbon directly determines sodium storage capacity along the low-voltage plateau.
Pursuant to ISO 9277 section 6.3, surface area results measured below 3.0 square meters per gram allow raw batch acceptance without penalizing supplier delivery schedules.

Yield
Commercial viability hinges on mass retention during thermal conversion and raw feedstock procurement costs. Financial success in scaling sodium ion anode manufacturing requires optimizing carbon recovery efficiency while minimizing total energetic input during synthesis.

Mass Conservation and Material Balance
Synthetic polymer precursors produce lower total mass losses during pyrolysis compared to unrefined biomass feedstocks. Phenolic resins achieve raw carbon conversion yields between 55 and 65 percent by mass due to dense aromatic cross-linking. Lignin and carbohydrate precursors lose up to 70 percent of initial dry weight as water vapor, carbon monoxide, and volatile light organics during thermal devolatilization.
Pitch precursors yield high carbon output exceeding 70 percent but require capital-intensive air stabilization reactors to prevent melting.

Landed Cost Economics and Procurement Specs
Raw precursor pricing, thermal energy consumption, and gas consumption determine the final per-kilogram material expenditure. Processing low-yield biopolymers consumes substantial electrical energy per kilogram of finished hard carbon, offsetting cheap raw material procurement prices. Factoring inert gas recycling systems, thermal furnace maintenance, and ash purification chemical costs establishes true landed cost profiles.
| Precursor Type | Raw Cost ($/kg) | Pyrolysis Carbon Yield (%) | Thermal Energy Cost ($/kg Anode) | Landed Anode Cost ($/kg) |
|---|---|---|---|---|
| Phenolic Synthetic Resin | 3.80 to 4.50 | 58 | 1.85 | 8.40 to 9.60 |
| Purified Kraft Lignin | 1.20 to 1.80 | 42 | 2.55 | 5.40 to 6.80 |
| Coconut Shell Biomass | 0.60 to 0.95 | 34 | 3.15 | 4.90 to 5.95 |
| Oxidized Coal Tar Pitch | 0.85 to 1.30 | 74 | 1.45 | 2.60 to 3.20 |
Procurement teams that evaluate precursor options on combined metric mass retention and post-processing purity secure lower landed costs per delivered cycle.