Frequency Sweep Impedance Criteria for High Power Lithium Cell Batches
Broadband EIS frequency sweeps isolate mid-frequency charge transfer resistance to catch high-rate lithium cell batch defects invisible to 1 kHz resistance testing.
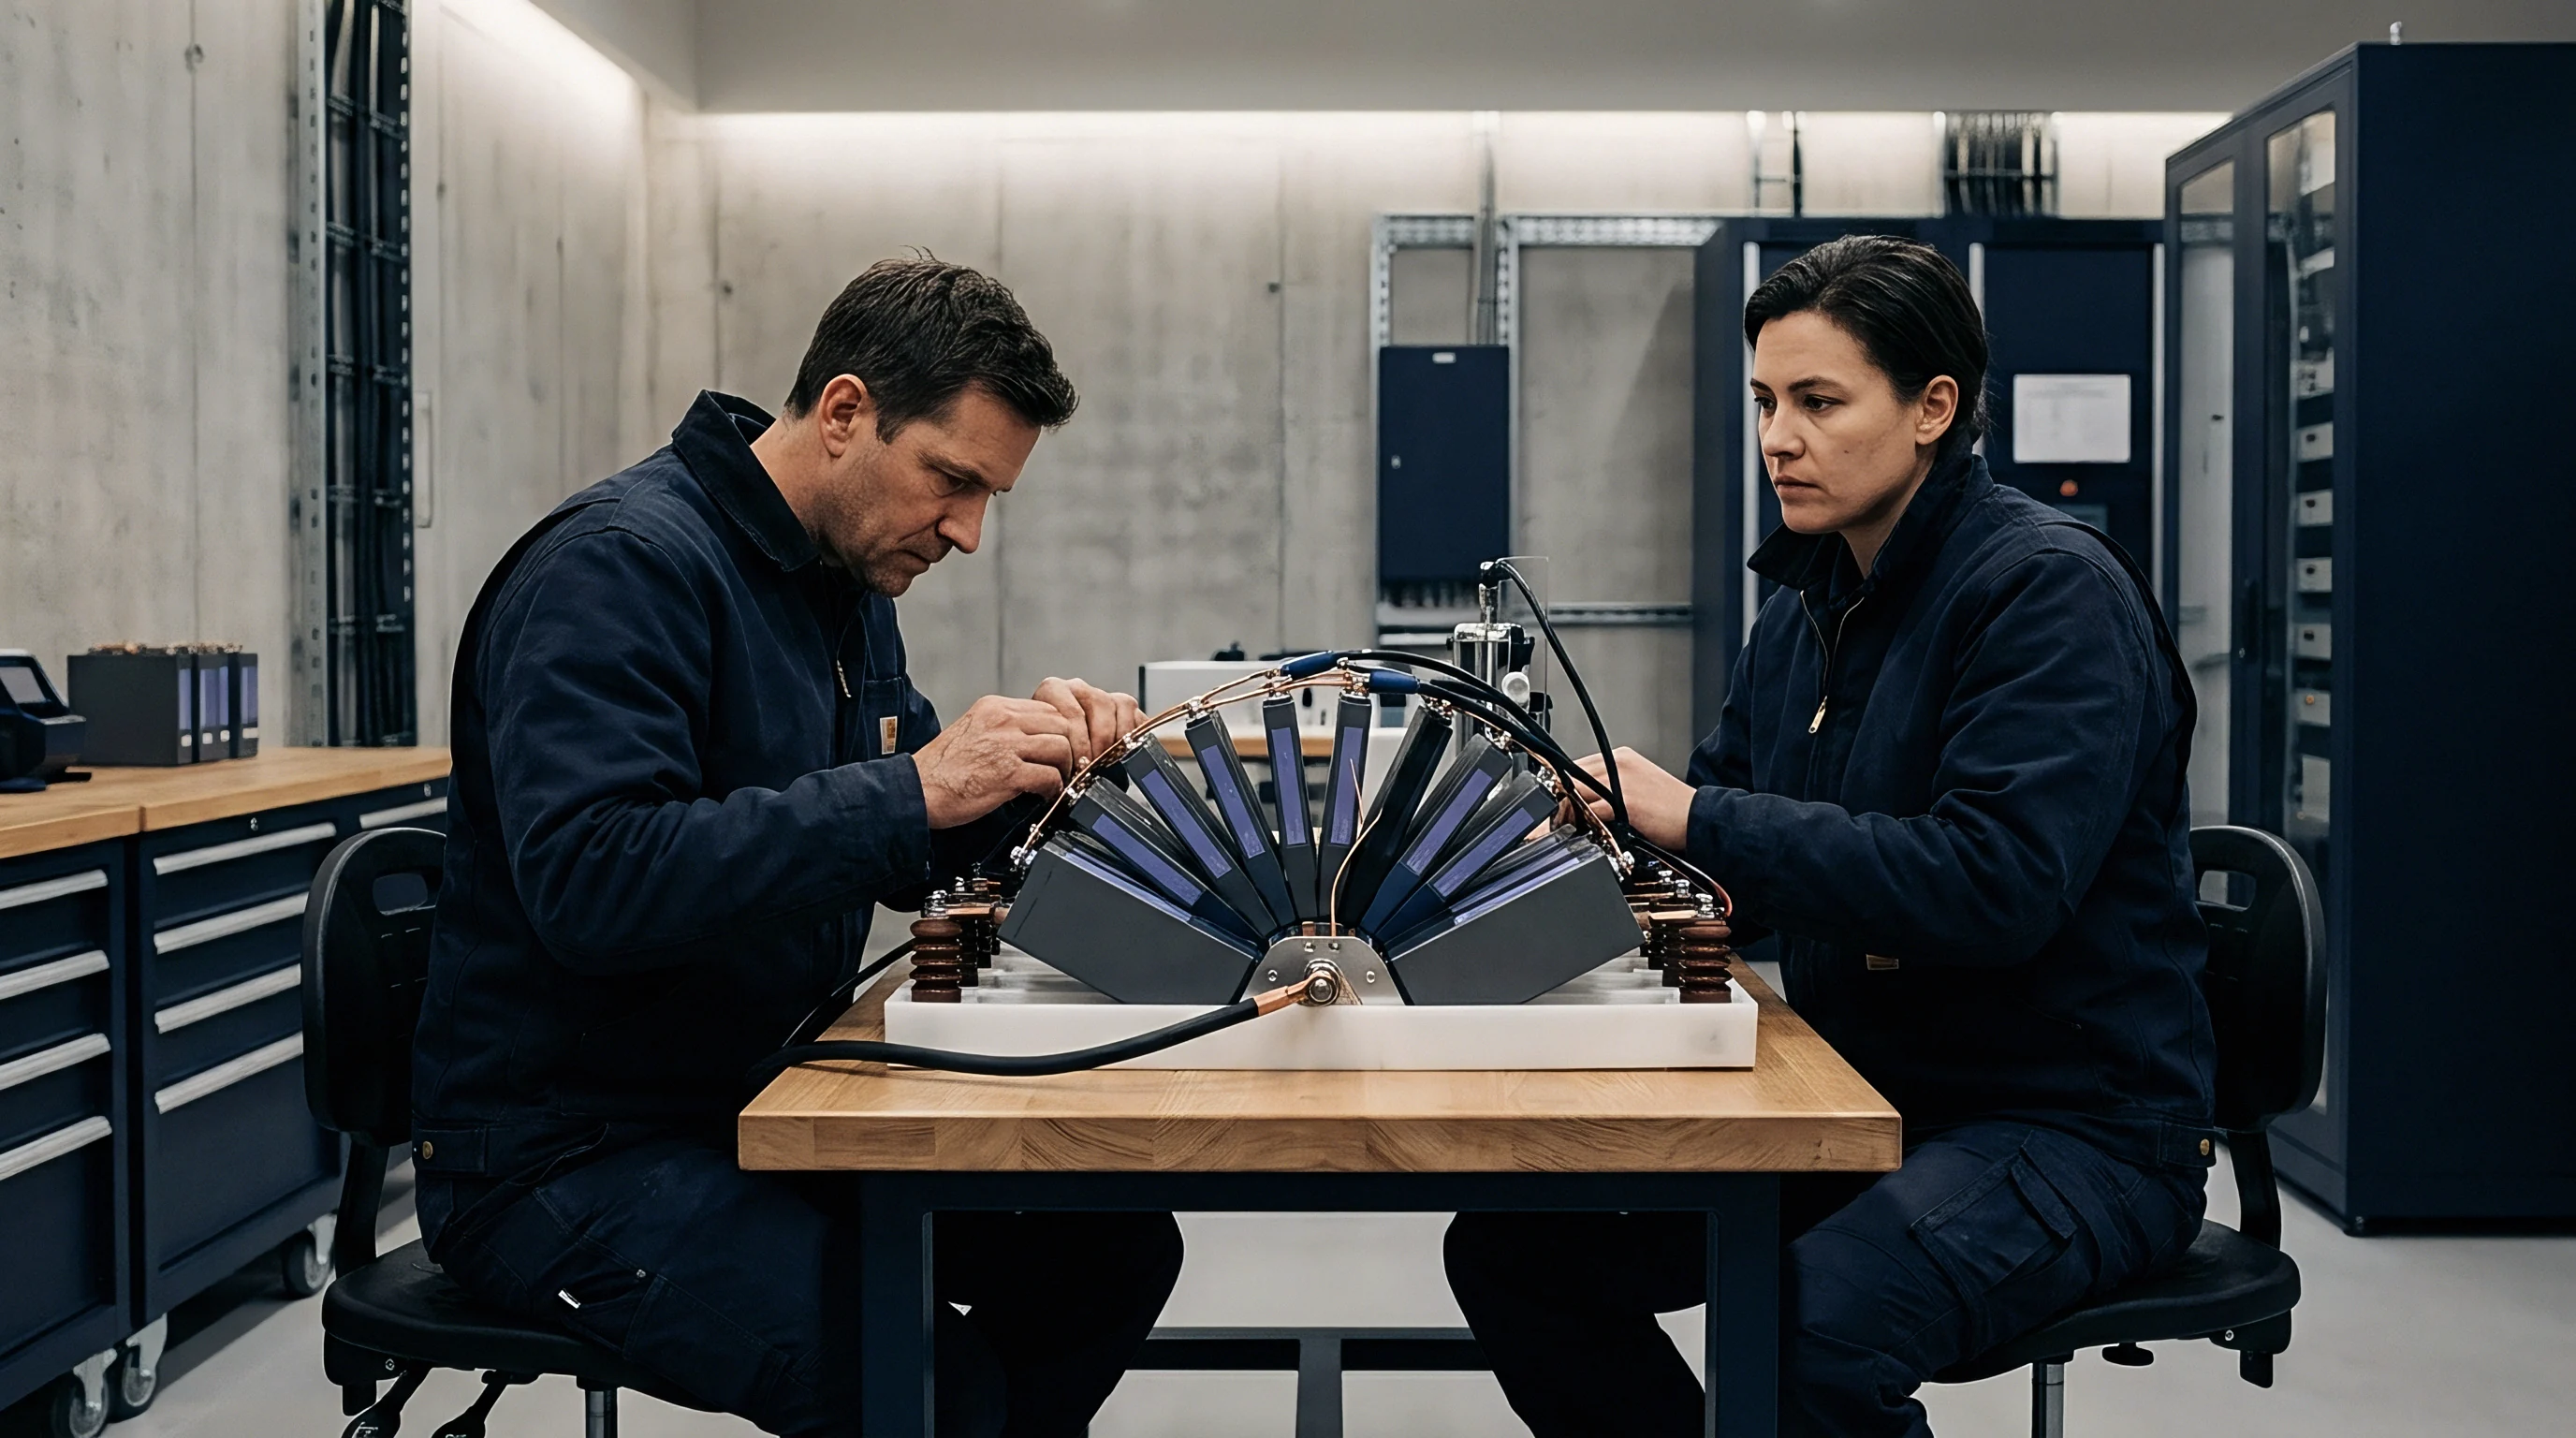

Spectrum
Standard single-frequency resistance measurements at 1 kilohertz capture pure metallic and ohmic resistive components while missing electrochemical degradation. High-power lithium-ion cells operated under pulse discharges ranging from 10C to 30C generate internal heat dictated by charge transfer impedance and solid electrolyte interphase resistance. A standard production meter measuring 1 kilohertz AC resistance records only the high-frequency ohmic intercept, omitting low-frequency reaction kinetics.
Static testing fails here.

High Power Cell Impedance beyond Single Frequency Tests
Pulse power delivery demands immediate electron and ion transport through porous electrodes. When a high-power cell experiences a rapid current step, the immediate voltage drop reflects the pure ohmic resistance composed of current collector foils, tab welds, liquid electrolyte bulk ionic resistance, and separator tortuosity. Within milliseconds following the current onset, the voltage decay curve steepens as charge transfer resistance and double-layer capacitance govern interfacial kinetics.
Impedance shifts under load.
Broadband electrochemical impedance spectroscopy evaluates cell health across a frequency spectrum spanning 10 kilohertz down to 10 millihertz. Sweeping across this range decouples internal loss mechanisms that conflate single-point direct-current or 1 kilohertz alternating-current measurements. High-power cell qualification relies on isolating these distinct electrochemical phenomena to predict continuous current limits, pulse thermal generation, and accelerated aging behavior under field operation.
At 25 degrees Celsius, charge transfer resistance measured at 1 Hz varies by less than 4 percent across fresh production lots.

Frequency Band Separation across Electrochemical Phenomena
Broadband excitation spreads sinusoidal current across several orders of magnitude, activating different internal relaxation times within the cell. At frequencies above 1 kilohertz, parasitic inductive effects from internal foil windings and tab geometry dominate the response. Between 100 hertz and 1 kilohertz, the real axis intercept yields pure ohmic resistance.
Lower frequencies reveal the electrochemical interphase behavior where thermal runaway and capacity fade originate.
| Frequency Band | Dominant Equivalent Parameter | Physical Cell Mechanism | Acceptance Criteria Window |
|---|---|---|---|
| 10 kHz to 1 kHz | Inductance and Contact Resistance | Tab tab-to-foil ultrasonic welds and terminal connection geometry | Inductance under 15 nanohenries, resistance baseline within 2 percent |
| 1 kHz to 100 Hz | Ohmic Resistance | Electrolyte ionic conductivity and separator pore tortuosity | Tolerance band plus or minus 3 percent from factory baseline |
| 100 Hz to 1 Hz | Interphase Impedance | Solid electrolyte interphase layer ion migration resistance | Maximum deviation under 5 percent across single manufacturing lot |
| 1 Hz to 10 mHz | Charge Transfer Resistance | Faradaic charge transfer kinetics at cathode and anode interfaces | Control limit within plus or minus 4 percent of qualification dossier |
Data reveals internal decay. Measuring the mid-frequency arc allows quality teams to quantify solid electrolyte interphase growth resulting from thermal abuse or improper factory formation cycling. High-power formulations with high nickel chemistries exhibit distinct charge transfer growth when exposed to ambient moisture during electrode slitting.
Broadband sweeps flag these subtle chemical variations before cells move to module integration.
Whether automated fitting routines can isolate charge transfer growth from solid electrolyte interphase thickening without introducing user bias across high-throughput industrial pipelines remains an open challenge.
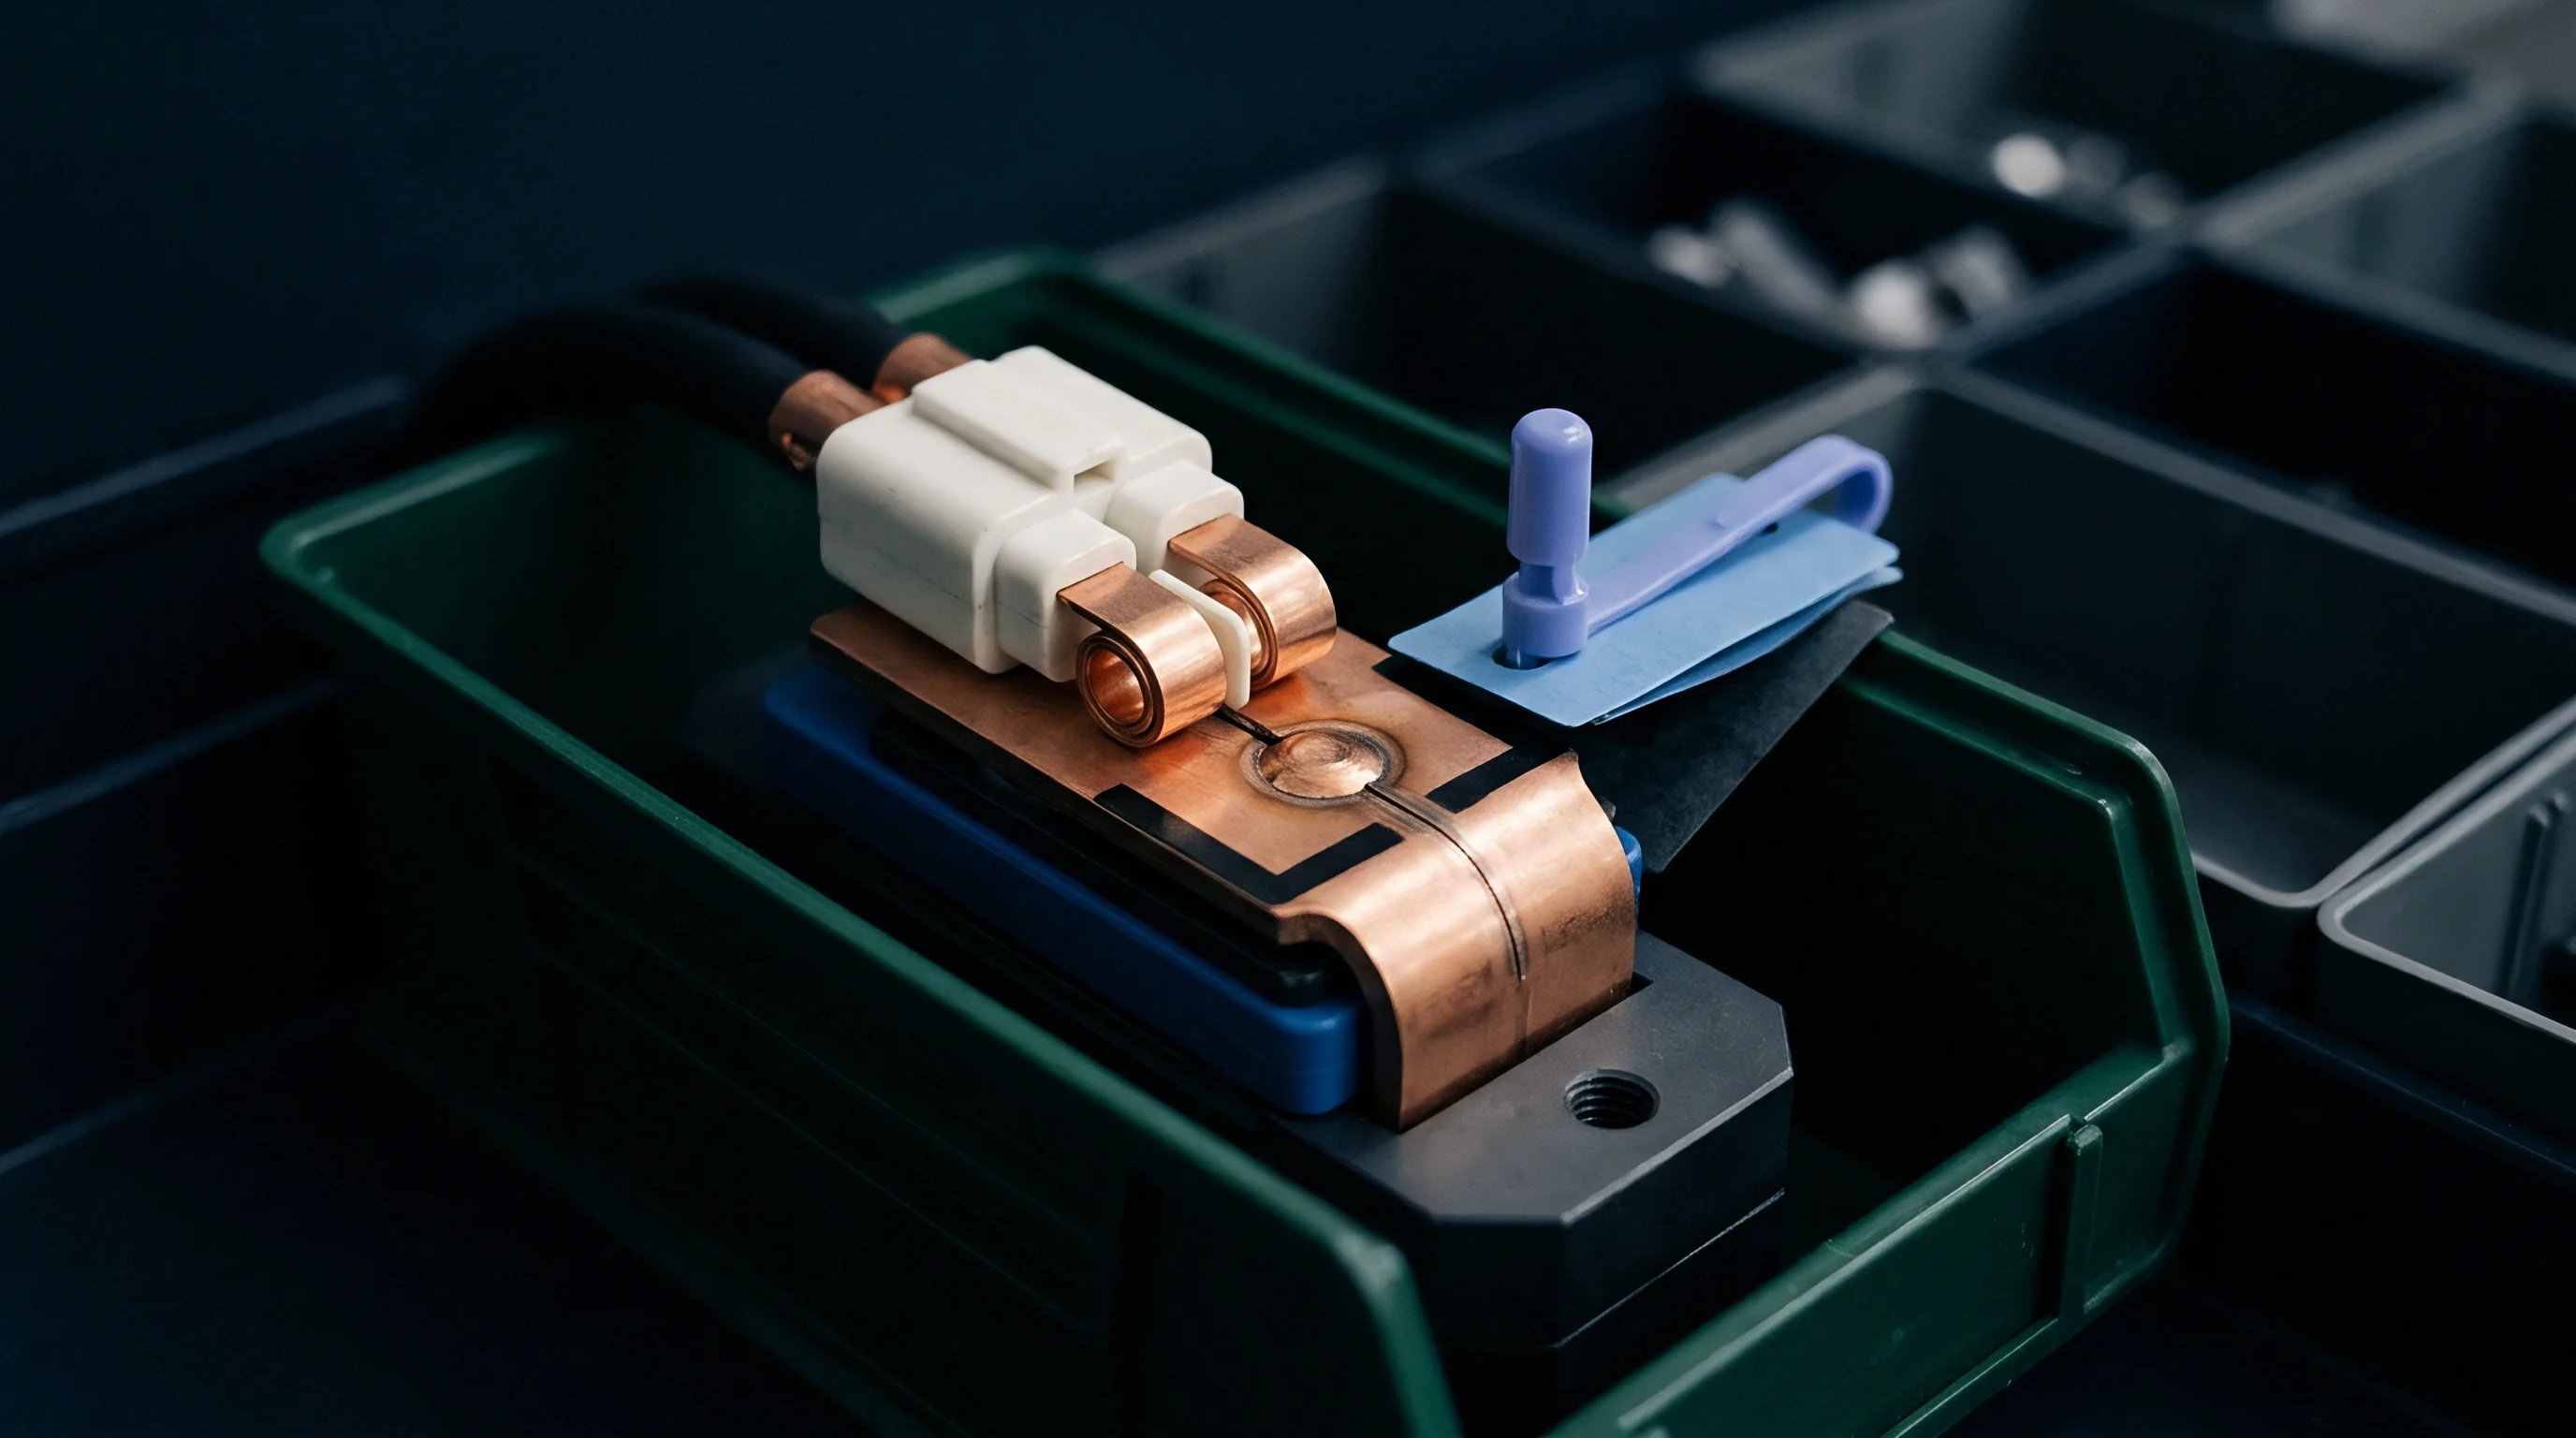

Sorting
Automated incoming inspection pipelines filter incoming shipments using mathematical criteria extracted from Nyquist plot sweeps. Screening high-power cells based on 1 kilohertz resistance alone risks passing units with severely degraded charge transfer kinetics. High-rate applications demand rigorous upper and lower control bounds across multiple frequency nodes to guarantee thermal balance across parallel cell strings.

Extracting Equivalent Circuit Parameters for Quality Control
Parameter extraction maps raw Nyquist plots into distinct circuit components using simplified continuous equivalent circuit modeling. Equivalent circuits combine ohmic resistance, constant phase elements, and charge transfer resistance parameters. The high-frequency real-axis intercept defines the bulk electrolyte resistance, while the mid-frequency semi-circle diameter yields the charge transfer resistance.
Margins determine lot release.
Fitting algorithms evaluate complex impedance spectra by minimizing weighting functions against experimental data. Outlier detection engines flag cells whose charge transfer resistance deviates beyond three standard deviations from the lot median. Yield drops instantly.
Isolating charge transfer resistance prevents high-power battery packs from developing localized hot spots under continuous high-rate discharge.
Clauses conforming to IEC 62660-1 section 6.2 enforce immediate lot rejection when mid-frequency impedance exceeds three standard deviations from baseline.
Statistical Screening Bounds on Charge Transfer Arc
Screening thresholds establish clear boundaries between acceptable statistical variance and abnormal lot degradation. High-power production lines implement process capability index targets exceeding 1.33 for charge transfer parameters. Cells falling outside these boundaries undergo secondary validation or automated triage into lower-power application tiers.
- Non Uniform Solid Electrolyte Interphase Layer Thickness variation across the anode surface increases local charge transfer resistance, causing current concentration and localized lithium plating during fast charging.
- Electrolyte Degradation and Salt Depletion Breakdown of lithium hexafluorophosphate salt lowers bulk ionic conductivity, shifting the high-frequency real axis intercept upward.
- Tab Contact Delamination Micro-fractures within ultrasonic tab welds increase structural resistance and introduce erratic inductive loops above 1 kilohertz.
- Micro Sizing Cathode Cracking Particle fracturing in high-nickel active material increases interfacial surface area while disrupting conductive carbon networks, expanding the charge transfer arc.
Sorting accuracy hinges on selecting specific frequency sampling nodes rather than capturing multi-thousand-point curves. High-speed factory production lines deploy discrete multi-sine excitation signals at three targeted frequencies: 1 kilohertz for ohmic baseline, 10 hertz for interphase analysis, and 1 hertz for charge transfer kinetics. This targeted frequency selection reduces measurement duration from minutes to under three seconds per unit.
| Parameter | Target Frequency | Upper Control Limit | Action on Non-Conformance |
|---|---|---|---|
| Ohmic Resistance | 1 kHz | Baseline plus 0.05 milliohms | Automated quarantine and lot scrap evaluation |
| Charge Transfer Resistance | 1 Hz | Baseline plus 0.12 milliohms | Triage to low-rate energy storage applications |
| Inductive Phase Angle | 5 kHz | Greater than 12 degrees shift | Mechanical weld inspection and teardown audit |
A batch exhibiting trailing Nyquist arcs at mid-frequencies consistently fails long-term thermal run-up tests regardless of passing standard direct-current resistance benchmarks.


Fixture
Test hardware introduces mechanical contact impedance and parasitic inductance if uncalibrated contact rigs connect to high-power cell terminals. Precision impedance measurements require four-point Kelvin wiring configurations to decouple fixture lead resistance from the true internal impedance of the lithium cell. Poor contact force distorts Nyquist plots, creating false indications of charge transfer degradation.
Where Does Thermal Drift Corrupt Sweep Data?
Cell internal temperature alters reaction kinetics across the charge transfer spectrum. The charge transfer resistance of a high-power lithium cell exhibits a temperature sensitivity of approximately 3 to 5 percent per degree Celsius near ambient room temperature. Uncontrolled thermal environments contaminate sweep datasets, masking manufacturing defects behind ambient temperature variations.
Temperature drives drift.
Testing facilities stabilize ambient environments to 25 degrees Celsius within a tolerance band of plus or minus 0.5 degrees Celsius. Resting cells in climate-controlled soak chambers prior to impedance sweeps ensures thermal equilibrium between the outer cell casing and the internal electrode stack. Contact force dictates accuracy.
A probe pin that leaves visible indentations on the terminal surface will produce false impedance spikes.

Contact Pressure Dynamics and Four Pin Kelvin Calibration
Repeatable measurements depend on uniform force applied at the terminal interface. Spring-loaded pogo pins must exert consistent mechanical pressure onto cell busbars or terminals without puncturing nickel plating layers. Pins wear down rapidly.
Calibration prevents costly false rejects.
- Thermal Stabilization Protocol Rest incoming cell trays inside climate-controlled chambers for two hours to reach thermal equilibrium at 25 degrees Celsius.
- Kelvin Pin Contact Force Maintain terminal probe contact force between 15 and 25 newtons to ensure low contact resistance without deforming outer terminal caps.
- Coaxial Cable Shielding Route sense and force cables in twisted shielded pairs to prevent electromagnetic coupling from adjacent power lines during high-frequency sweeps.
- Excitation Amplitude Selection Set sinusoidal current excitation small enough to maintain linear electrochemistry without exceeding a 10-millivolt voltage response amplitude.
Impedance measurement software injects low-amplitude current sinusoids to operate within the linear electrochemical regime. If excitation amplitude forces voltage swings beyond 10 millivolts, non-linear kinetics distort the sinusoidal response, introducing artificial harmonics into the Fourier transform calculation. Rest periods settle chemistry.
Failing to compensate for terminal pin oxidation leads directly to innocent cell lots being returned to suppliers, triggering contract disputes and production line stoppages.


Dossier
Quality documents accompanying incoming shipments provide the baseline reference for incoming validation. Manufacturing plants generate electrochemical impedance curves during final cell grading at factory gate releases. Technical supply agreements demand that digital records contain complete Nyquist sweep arrays rather than single-point resistance metrics.
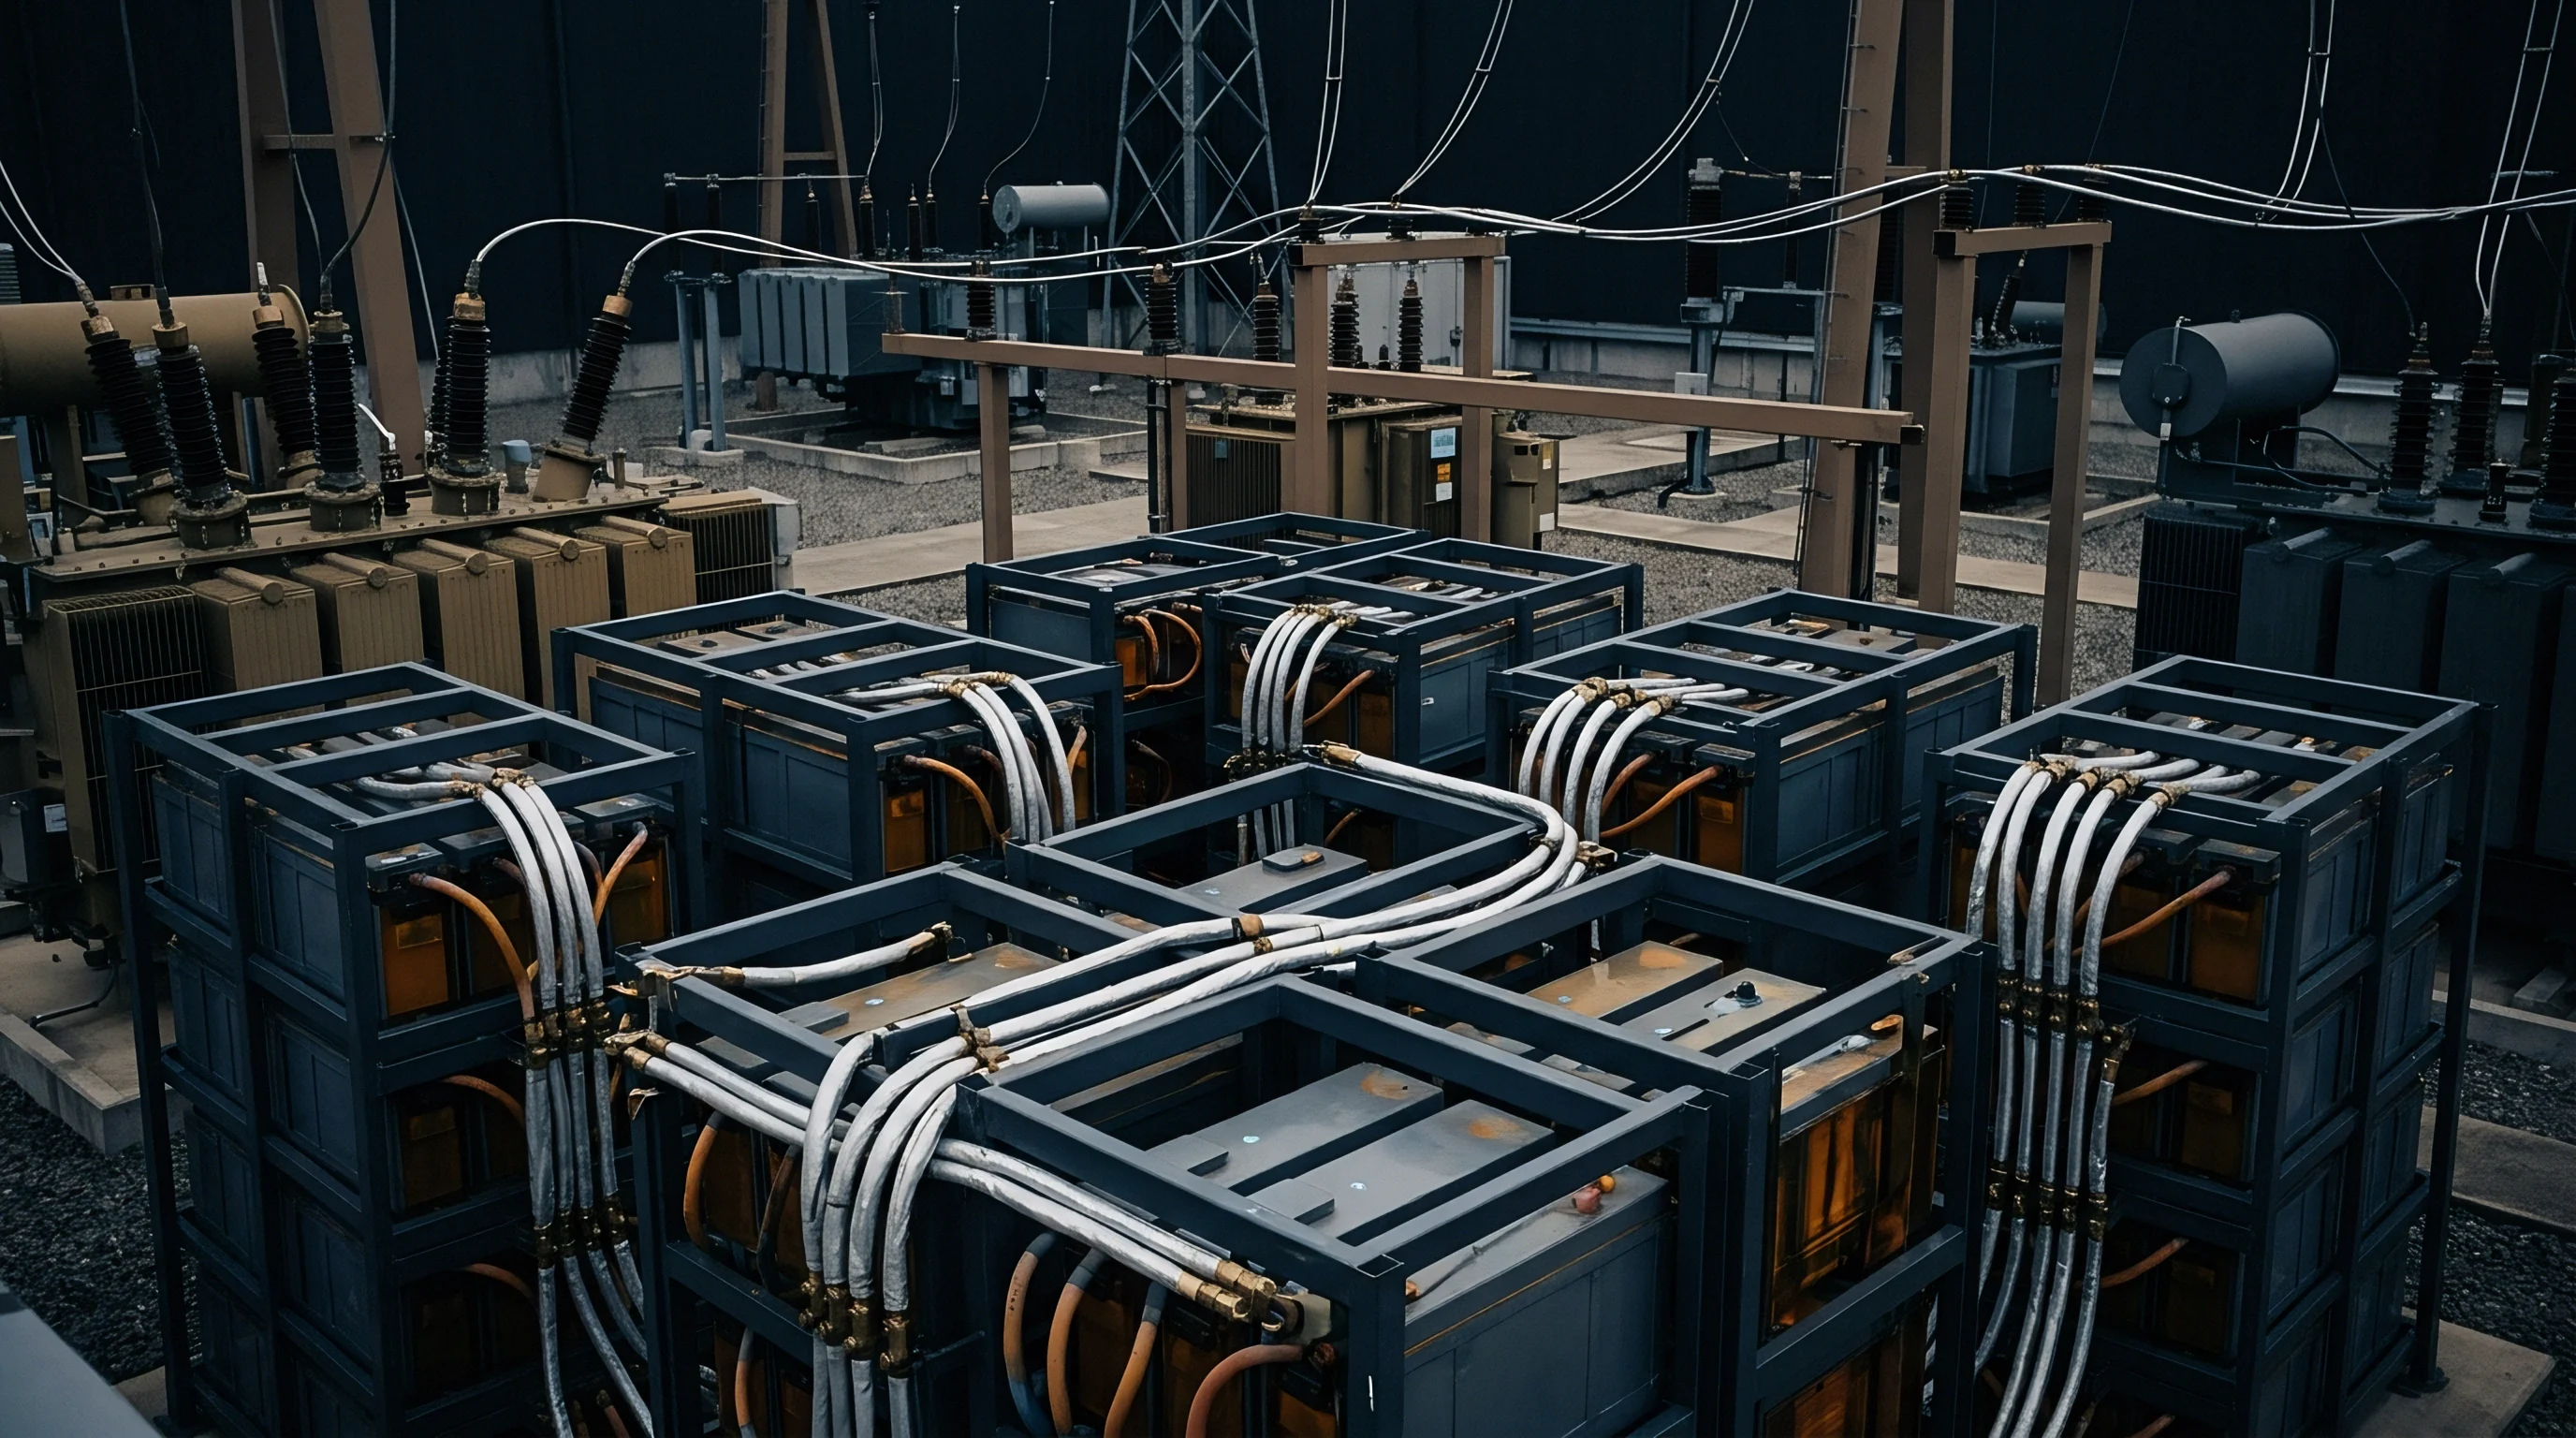
Standardizing Factory Gate EIS Record Exchange
Data formatting rules allow automated software to compare origin factory sweeps directly against receiving sweeps. Standardized export structures capture temperature, state of charge, excitation current, and raw complex impedance coordinates across specified frequency steps. Missing metadata renders origin datasets useless for receiving audits.
Discrepancies between supplier factory sweeps and receiving bench measurements usually trace back to uncalibrated temperature chambers.
Batch Acceptance Workflows for Receiving Inspection
Incoming lots undergo structured sampling protocols to confirm electrochemical consistency before processing.
- Extract ten cells randomly from each pallet layer in accordance with ISO 2859-1 double sampling plans.
- Rest cells in a thermal chamber at 25.0 degrees Celsius for two hours to achieve uniform core temperature.
- Apply a 10 milliamp AC sinusoidal excitation across the 10 kilohertz to 10 millihertz sweep spectrum.
- Overlay measured Nyquist curves against the supplier baseline dataset using automated curve-fitting routines.
- Flag lots exceeding the upper control limit on charge transfer resistance for engineering disposition.
Suppliers frequently claim that measured impedance variations stem from post-shipment storage temperatures rather than factory manufacturing drift.


Ledger
Cost structures for cell qualification balance line speed against test precision. Conducting multi-frequency sweeps across 100 percent of incoming cells guarantees detection of subtle chemical flaws but requires substantial capital outlay for automated test stations. Sample-based acceptance screening coupled with targeted fast-sweep methods optimizes quality protection against incoming inspection budgets.

NRE Amortization against Screening Speed
Tooling expenditures for multi-channel test stations scale directly with channel count and measurement duration. A full electrochemical impedance sweep spanning 10 kilohertz down to 10 millihertz takes approximately 45 seconds per cell. Multiplying this test duration across a 50,000-unit weekly delivery requires 15 parallel test channels operating continuously.
Time consumes profit.
Deploying targeted multi-frequency pulses reduces measurement time to three seconds per unit. A three-second test profile lowers total required channel capacity from 15 channels down to two automated channels on the receiving line. Lowering channel counts cuts non-recurring engineering tooling expenses by over 60 percent while retaining the capability to isolate charge transfer outliers.
Rejection creates waste. Tooling claims priority.

Commercial Yield Impact of Mid Frequency Sorting
Financial risk shifts between cell manufacturer and pack integrator based on acceptance criteria thresholds. Consider a procurement contract for 100,000 high-power 21700 NMC cells priced at $2.80 per unit. Establishing strict charge transfer resistance bounds derived from frequency sweeps yields a 1.5 percent lot rejection rate during initial NPI pilot production.
Rejecting 1,500 cells based purely on 1 kilohertz resistance would identify only 300 non-conforming units, leaving 1,200 defective units containing elevated charge transfer resistance to proceed to pack integration. Defective units in high-power packs lead to premature thermal throttling, reduced power delivery, and field warranty claims costing up to ten times the individual cell purchase price. False failures inflate costs.
Incorporating standard supply agreement addendum 4B shifts non-conforming lot return freight costs onto the manufacturer whenever mid-frequency impedance variance exceeds four percent of baseline.