Three Electrode Cell Setup for Battery Impedance Analysis
Three electrode impedance testing decouples anode and cathode degradation by isolating half cell charge transfer resistance without breaking full cell geometry.

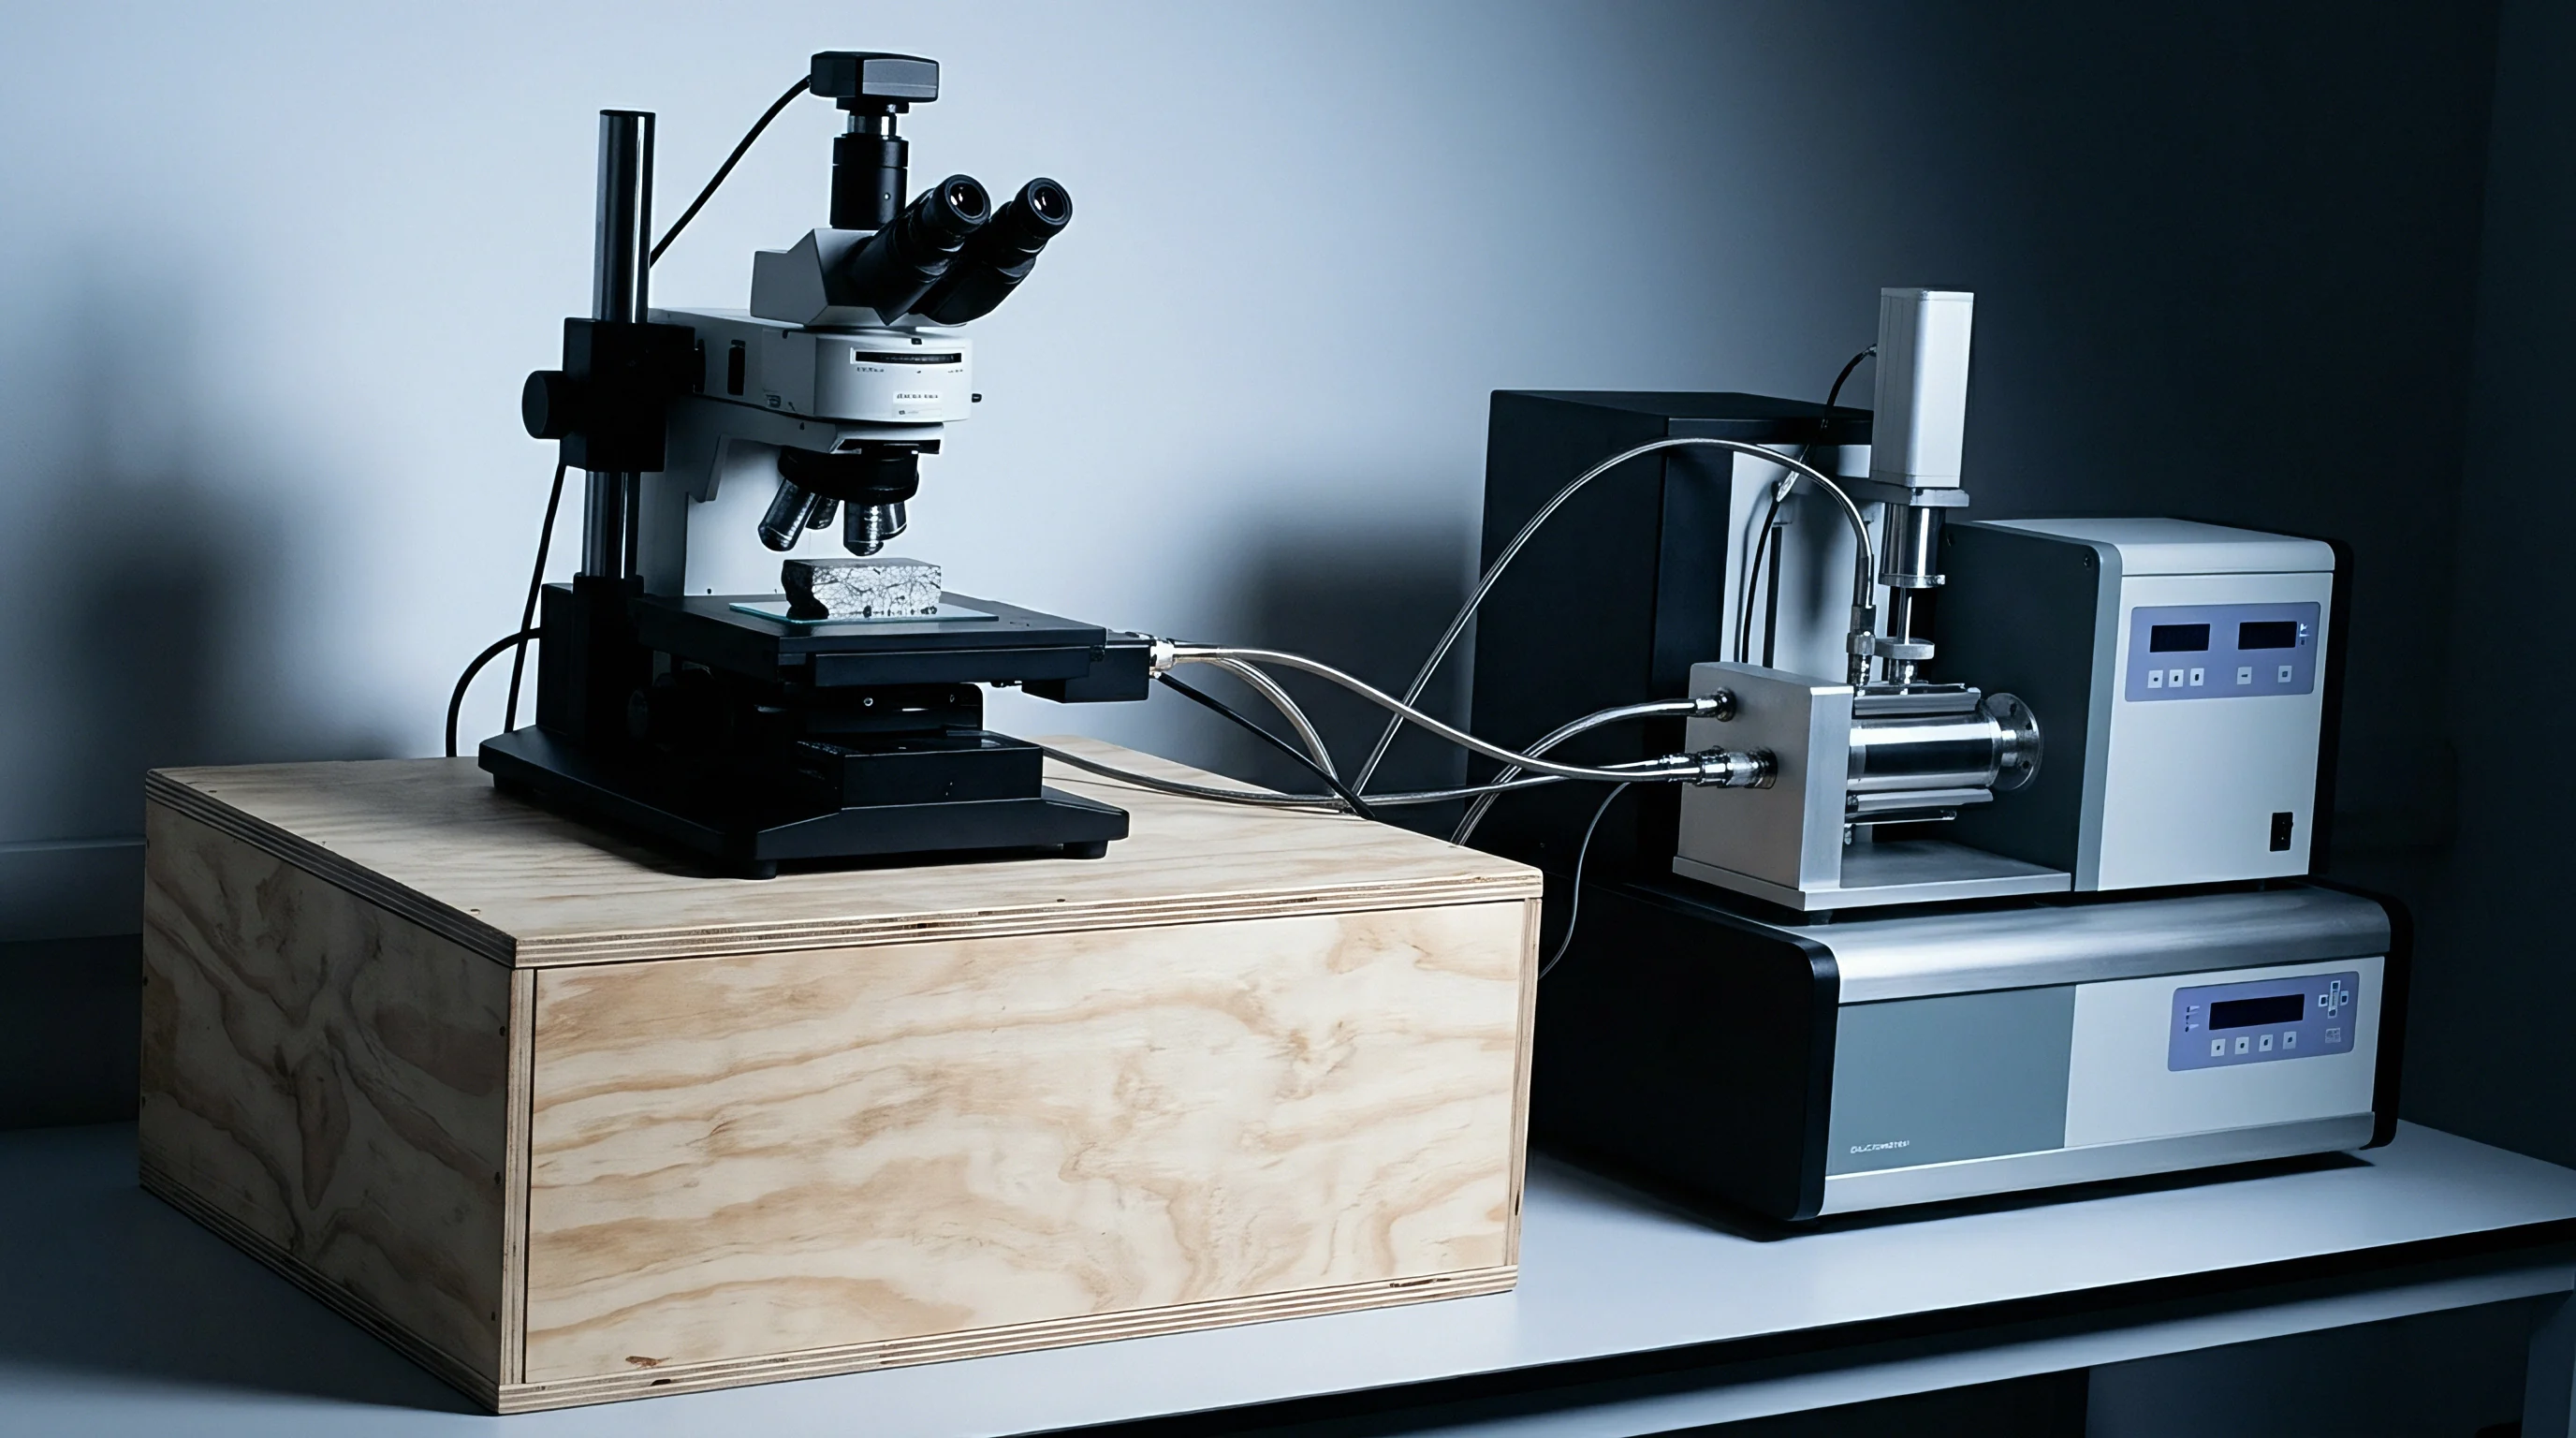
Lead
Potentiostatic excitation of a full lithium-ion cell requires an unperturbed voltage sense point positioned inside the liquid electrolyte bridge. Standard two-terminal impedance spectroscopy measures the lumped sum of working electrode kinetic resistance, counter electrode transfer impedance, separator ionic resistance, and metallic tab contact effects. Isolating cathodic degradation mechanisms from anodic side reactions during cycling demands a neutral sensing element that monitors electrolyte potential without drawing measurable current.
Incorporating a third terminal converts complex spectral arcs into isolated half-cell Nyquist plots, allowing battery test engineers to track solid electrolyte interphase growth on graphite anodes independently from transition metal dissolution on high-nickel cathodes.

Micro-Wire Geometry and Reference Insertion
Placing a probe filament between opposing electrodes disrupts local current density if the conductor cross-section exceeds electrolyte pore dimensions. Electric field distortion occurs when a thick reference probe shields active material surfaces, forcing ionic current around the obstruction. Optimal setups rely on micro-wire geometries with diameters between ten and fifty micrometers.
Insulated copper or nickel core wires coated with electrochemically active material maintain necessary structural rigidity during cell assembly, while placing the sensing tip at the geometric center of the electrode overhang region minimizes edge-effect field gradients during high-frequency sinusoids.
Positioning the reference probe directly between working and counter active coatings minimizes electric field distortion during impedance acquisition.
Cell builders assemble three-electrode setups in specialized pouch designs, split-cells, or modified commercial cylindrical canisters. Pouch formats allow planar insertion of insulated micro-wires between separator layers, with the bare sensing tip extending directly into the flooded region between active electrode coatings. Inadequate wetting around the probe tip causes elevated contact impedance, introducing artificial high-frequency phase shifts.
Automated electrolyte vacuum impregnation ensures complete separator saturation around the micro-wire interface, and mechanical clamping prevents gas accumulation at the probe junction to preserve contact geometry over long cycling schedules.
- Metallic Lithium Filament provides direct electrochemical potential alignment against lithium ions, although soft mechanical properties require ceramic support sleeves during pouch cell assembly.
- Lithium Titanate Coating offers outstanding potential stability under trace oxygen contamination, preventing baseline drift during multi-day impedance sweeps across wide temperature bands.
- Lithium Iron Phosphate Composite delivers a flat open-circuit potential plateau over a broad state-of-charge band, reducing phase noise during low-frequency Warburg interrogation.
- Gold-Plated Tungsten Core yields superior tensile strength for ultra-thin probe fabrication, allowing micro-wire insertion without inducing mechanical tears in thin polymeric separators.
Improper probe positioning distorts the electric potential distribution, corrupting calculated transfer functions and producing negative charge-transfer resistance arcs on half-cell Nyquist plots.


Isolation
Separating cathode kinetic impedance from anode degradation processes depends on clean potential sensing against an unpolarized baseline. When AC perturbation signals sweep across a cell, the reference probe monitors localized liquid-phase potential fluctuations while the potentiostat records two simultaneous voltage responses: working-to-reference and counter-to-reference. Summing both half-cell impedance responses reconstitutes the total full-cell spectrum to confirm measurement validity.
This deconvolution enables direct tracking of charge-transfer resistance growth at the cathode-electrolyte interface without interference from lithium plating occurring on the anode.

Frequency Domain Spectrum Deconvolution
Impedance response recorded across a ten-millihertz to one-hundred-kilohertz bandwidth splits full-cell charge transfer resistance into constituent ionic steps. High-frequency intercepts yield pure ohmic resistance, encompassing electrolyte conduction, separator tortuosity, and tab collection losses. Mid-frequency semicircles differentiate solid-electrolyte interphase resistance from interphase kinetic charge transfer, while low-frequency linear tails measure solid-state diffusion kinetics within host particle crystal lattices.
Decoupling these regimes across individual electrodes reveals whether total cell impedance growth stems from active lithium inventory loss or interfacial cathode degradation.
| Probe Chemistry | Equilibrium Potential vs Li/Li+ (V) | Potential Drift Rate (mV/24h) | Impedance Contribution (Ω) | Operational Temperature Range (°C) |
|---|---|---|---|---|
| Pure Lithium Metal Wire | 0.00 | 1.45 | 120 to 350 | -10 to 45 |
| Lithium Titanate (LTO) | 1.55 | 0.08 | 45 to 110 | -30 to 60 |
| Lithium Iron Phosphate (LFP) | 3.42 | 0.12 | 60 to 180 | -20 to 55 |
| Alloyed Li-In Wire | 0.62 | 0.25 | 85 to 210 | -10 to 50 |

Reference Alignment and Potential Drift
Potential offsets shift baseline measurements when active material cross-talk modifies electrolyte composition near the third terminal. Exposure to reactive carbonate solvents causes continuous solid electrolyte interphase formation on raw lithium sensing wires, generating baseline drift over extended testing. Pre-passivating lithium filaments or employing stable two-phase reference compounds like lithium titanate prevents continuous potential slippage, suppressing artifact shifts during long-term cycle testing.
- Connect working, counter, reference, and sense leads to high-impedance potentiostat channels using double-shielded coaxial cables.
- Perform zero-current open-circuit potential stabilization for sixty minutes until voltage drift falls below 0.05 millivolts per minute.
- Apply a ten-millivolt potentiostatic AC amplitude across the full cell while monitoring reference channel voltage response.
- Sweep frequency spectrum from one hundred kilohertz down to ten millihertz taking ten logarithmic steps per decade.
- Validate full-cell spectrum sum against isolated half-cell spectra across every frequency point to confirm geometric symmetry.
High transfer impedance at the reference probe channel skews high-frequency phase angles whenever sense line input impedance falls below one gigohm.


Distortion
Measurement error manifests as false high-frequency inductive loops or artificial charge-transfer arcs when spatial positioning breaks electrical symmetry. Asymmetric positioning places the reference probe closer to one active coating edge, capturing non-uniform equipotential lines during high-frequency excitation. Using short, shielded cables lowers lead inductance and noise, whereas stray capacitance between lead lines introduces secondary phase shifts that obscure true charge-transfer kinetics above ten kilohertz.
Correcting geometric distortion requires precise spatial alignment within the separator plane alongside high-input-impedance electrometers on reference channels.

Current Line Asymmetry and Inductive Coupling
Equipotential surfaces within a pouch cell compress near edge boundaries, creating phase delays across high-frequency interrogation sweeps. When current density lines bow around an off-center probe, the sensed voltage includes a fraction of the ohmic drop across the primary current path, generating artificial negative resistance artifacts at high frequencies. Tab geometry and parallel lead routing introduce mutual inductive coupling, adding spurious loops to Nyquist spectra that require differential sensing configurations and twisted-pair coaxial wiring to resolve.
UN 38.3 transport certification tests confirm structural cell integrity but omit reference electrode phase angle calibration verification.

Unbalanced Field Geometry Detection Checklist
Diagnostic criteria expose placement anomalies before equivalent circuit fitting transfers spatial artifacts into kinetic parameters. Evaluating spectral validity requires checking for consistency between full-cell impedance and the mathematical sum of both half-cell responses across the complete frequency window.
- Asymmetric High-Frequency Intercepts indicate spatial misalignment of the reference probe relative to active electrode coating edges.
- Negative Real Impedance Arcs signal significant current shielding or severe electrolyte displacement caused by oversized probe filaments.
- Phase Angle Overshoot Above Ninety Degrees highlights uncompensated mutual inductance between power supply leads and sense voltage channels.
- Continuous Low-Frequency Spectrum Drift reveals chemical degradation or active passivation layer growth directly on the reference electrode surface.
Cell manufacturers frequently attribute non-physical high-frequency semicircles on half-cell spectra to inherent interface kinetics rather than admitting reference probe placement asymmetry within pouch prototypes.


Deconvolution
Equivalent circuit modeling transforms raw frequency response spectra into discrete kinetic parameters for individual electrode interfaces. Full-cell impedance models lump anode and cathode processes together, forcing parameter optimization algorithms to estimate overlapping time constants. Three-electrode impedance spectra decouple these overlapping networks.
Fitting an inductor-resistor-constant phase element circuit to isolated cathode data yields explicit values for cathode charge-transfer resistance and double-layer capacitance, while fitting the corresponding anode spectrum isolates solid electrolyte interphase resistance from anode charge-transfer kinetics.
A fifty-micron lithium wire insertion increases high-frequency ohmic resistance by less than 0.2 milliohms at 25 degrees Celsius.
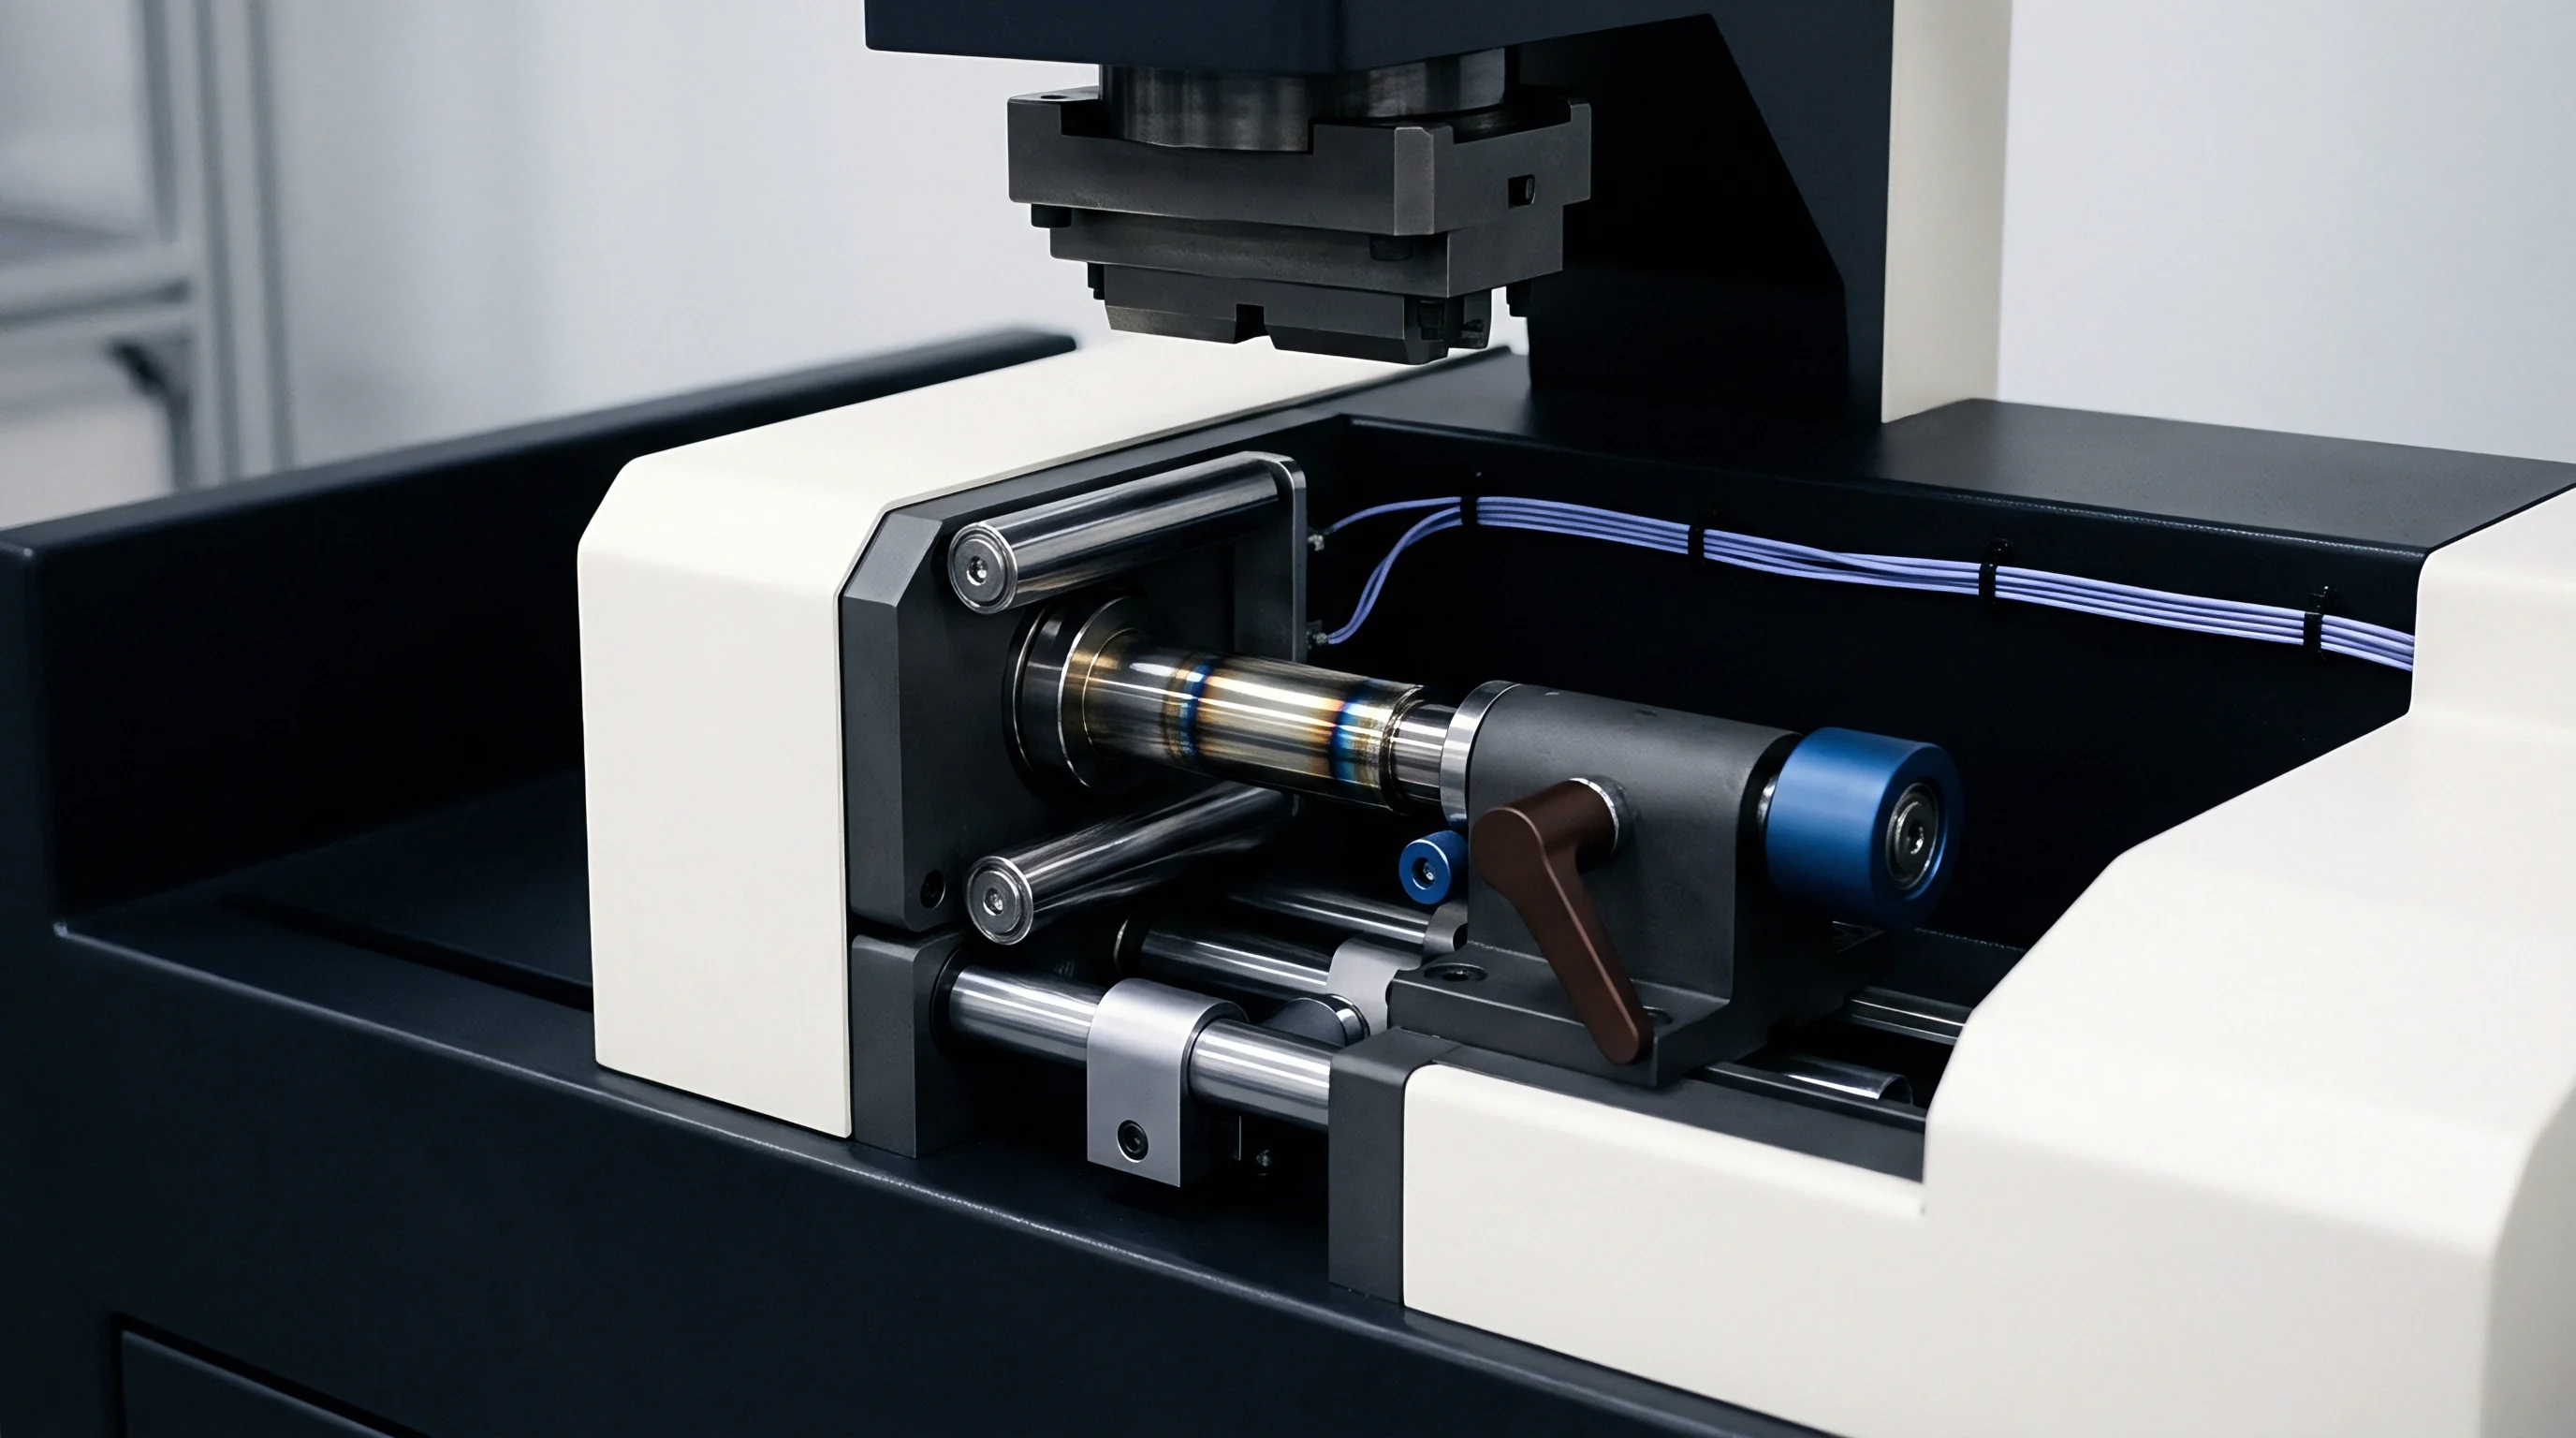
Parametric Fitting across State of Charge
Modulating battery capacity in ten percent increments reveals distinct impedance evolution curves for positive and negative active materials. Graphite anodes exhibit substantial charge-transfer resistance variations near zero percent state of charge due to low stage-index intercalation conductivity. High-nickel cathodes show pronounced charge-transfer growth above eighty percent state of charge, driven by surface structural phase transformations and transition metal reduction.
Mapping individual electrode parameters across voltage windows isolates specific degradation modes during cycle life qualification.
| State of Charge (%) | Full Cell Ohmic R_Ω (mΩ) | Cathode R_ct (mΩ) | Anode R_ct (mΩ) | Anode R_sei (mΩ) |
|---|---|---|---|---|
| 10 | 1.24 | 8.45 | 14.20 | 2.10 |
| 30 | 1.21 | 6.80 | 5.15 | 2.08 |
| 50 | 1.19 | 5.92 | 3.10 | 2.12 |
| 70 | 1.20 | 5.65 | 2.85 | 2.09 |
| 90 | 1.22 | 7.35 | 2.60 | 2.15 |

Thermal Coefficients for Half-Cell Spectra
Varying test channel temperatures from minus ten to forty-five degrees Celsius drives exponential shifts in charge-transfer resistance. Arrhenius plotting of isolated half-cell charge-transfer values yields individual activation energies for cathodic and anodic charge transfer steps. Lithium ion desolvation at the graphite-electrolyte interface presents higher activation energy than insertion kinetics inside NMC crystal lattices at sub-zero temperatures.
Quantifying these activation energies establishes lower thermal bounds for fast-charging protocols without risking localized metallic lithium deposition.
Local variations in separator tortuosity near inserted micro-wire probes modify the effective ionic pathway, skewing calculated Warburg diffusion coefficients during low-frequency sweeps.


Validation
Integrating three-electrode prototype testing into commercial procurement contracts prevents reliance on aggregated full-cell datasheets. Standard specification sheets report combined cell internal resistance, obscuring early cathode dissolution or anode passivation degradation. Requiring suppliers to provide three-electrode impedance dossier reports during batch qualification provides early verification of cell aging trends, and identifying which electrode drives overall impedance growth guides pack-level thermal design and battery management system firmware parameter tuning.
Separate anode impedance monitoring isolates solid electrolyte interphase growth without relying on post-mortem teardown.

Qualification Protocol Integration
Verification schedules require baseline impedance deconvolution on batch samples prior to signing volume supply agreements. Automated test stations run standardized three-electrode qualification protocols on custom pouch samples taken from production line pilot runs. Establishing acceptable charge-transfer resistance growth limits for both anode and cathode individually protects buyers from hidden chemistry modifications, ensuring unannounced electrolyte reformulations or binder substitutions show up as unexpected half-cell resistance shifts long before full-cell capacity degradation appears.

Commercial Warranty and Sourcing Dossier Requirements
Technical annexes attached to cell purchase orders specify maximum allowable charge-transfer impedance growth for both electrodes individually. Standard supply contracts bind capacity retention metrics to overall cycle count, leaving buyers unprotected against rapid low-temperature power capability losses. Inserting explicit three-electrode impedance thresholds into quality assurance agreements establishes legal grounds for shipment rejection whenever cathode degradation rates exceed design parameters.
Supply contract clause 14.3 mandates that any batch displaying a two-fold increase in isolated anode charge-transfer resistance over five hundred standard cycles shall trigger immediate lot rejection at the supplier’s expense.