Standardizing Acceptance Quality Limit Metrics for Prismatic Cell Procurement
Standardizing prismatic cell procurement requires defining critical AQL thresholds, dynamic sampling plans, and precise metrology for lot acceptance.


Criterion

Defect Threshold Categorization in Cell Manufacturing
Procurement agreements for large-format prismatic lithium-ion batteries depend on explicit quality boundaries. When high-capacity cells enter pack assembly, physical or electrochemical defects can lead directly to safety incidents, line stoppages, or accelerated field degradation. Setting acceptance standards requires separating potential failure modes into operational tiers before executing a contract.
Industry practice divides non-conformances into three severity classes: critical, major, and minor, with each reflecting specific risks to product safety, mechanical assembly, or operational lifespan.
A critical classification applies to non-conformances that pose an immediate hazard or compromise safety during assembly, testing, transit, or field operation. Internal short circuits, thermal runaway risk, electrolyte leakage, major housing breaches, and inverted polarity fall under this category. In large prismatic formats using nickel-manganese-cobalt or lithium-iron-phosphate chemistries, an internal short circuit can trigger rapid exothermic breakdown.
The resulting gas generation threatens pack enclosure integrity and adjacent cell stability. A single critical failure in an incoming batch halts acceptance, triggering immediate quarantine of the entire production lot.
A major non-conformance includes attributes that prevent a cell from meeting performance targets or mechanical integration tolerances. While these defects do not immediately cause thermal runaway, they disrupt automated pack assembly or lead to premature capacity loss. Out-of-spec terminal coplanarity, excessive thickness swelling prior to cycling, elevated direct current internal resistance, accelerated self-discharge, and compromised insulation resistance all count as major defects.
If terminal studs exceed geometric runout limits, laser welding fixtures fail to achieve consistent weld penetration, producing high joint resistance and localized heating. Acceptance Quality Limit values for major defects typically range from 0.10 to 0.40 percent, depending on module design complexity and thermal margins.
Minor non-conformances involve cosmetic or non-functional discrepancies that do not affect electrochemical performance, structural integrity, or mechanical fitment. Slight scuffs on the aluminum casing sleeve, laser marking legibility errors that remain machine-scannable, or minor paint blemishes on non-insulating surfaces constitute minor defects. These variations do not impair amp-hour delivery or thermal performance.
Standard procurement terms assign a higher threshold to this tier, frequently between 1.0 and 2.5 percent. Procurement teams establish these defect limits before issuing cell purchase orders.
A critical defect threshold of 0.010 percent AQL on prismatic cells requires zero failures in a sample size of 1,250 units drawn from a production batch of 50,000 cells.

Statistical Basis of Acceptable Quality Limit Standards
Evaluating large cell production batches relies on statistical sampling theory defined under standards like ISO 2859-1 and ANSI/ASQ Z1.4. Buyers cannot conduct destructive or time-intensive testing on every individual cell in a fifty-thousand-unit shipment. Instead, sampling protocols establish the maximum allowable percentage of non-conforming units in a batch that can be considered acceptable as a process average.
These definitions anchor on the Operating Characteristic curve, which calculates the probability of lot acceptance across varying actual defect rates.
The math balancing producer risk and consumer risk governs these probability distributions. Producer risk, designated as alpha, is the probability that a conforming cell batch is incorrectly rejected at incoming inspection. Consumer risk, designated as beta, is the probability that a non-conforming batch is accepted into the assembly facility.
Statistical parameters align the acceptable quality boundary with a ninety-five percent probability of lot acceptance at the target defect rate. Conversely, the Lot Tolerance Percent Defective, or Limiting Quality, defines the defect level where consumer risk beta is fixed at ten percent. Standardizing these values eliminates ambiguity when receiving factory shipments.
Sampling plans shift between normal, tightened, and reduced inspection modes depending on supplier history and batch consistency. Normal inspection serves as the baseline for new suppliers or ongoing orders with demonstrated stability. Tightened inspection increases the sample size or lowers the allowable defect count when consecutive lots fail.
Reduced inspection lowers sample size requirements once a supplier demonstrates sustained process capability over ten consecutive lots. Switching between these states follows clear rules, removing subjective negotiation from incoming quality verification.
| Defect Severity Tier | Target AQL (%) | Sampling Level (ISO 2859-1) | Primary Test Method | Impact on Assembly / Operation |
|---|---|---|---|---|
| Critical Safety Defect | 0.010 | Special Inspection Level S-4 | OCV, Insulation Resistance, CT Scan | Thermal runaway hazard, internal shorts, casing rupture |
| Major Functional Defect | 0.150 | General Inspection Level II | DCIR, 1C Capacity, Dimensions | Automated weld failure, early pack degradation, module misalignment |
| Major Physical Defect | 0.400 | General Inspection Level II | Terminal Coplanarity, Pin Gauge | Busbar installation failure, structural clamp interference |
| Minor Cosmetic Defect | 1.500 | General Inspection Level I | Visual Inspection, Barcode Scanner | Non-functional visual flaws, sleeve abrasions |
Mechanical dimensional variance in prismatic cell manufacturing stems from aluminum deep-drawing tolerances, jellyroll winding tension, and cap-to-can laser welding alignment. Electrochemical variance originates in slurry coating thickness, solvent drying profiles, electrolyte fill weight accuracy, and formation cycling schedules. Standardizing quality metrics mandates that suppliers provide statistical process control data ~ specifically Process Capability Index numbers exceeding 1.33 for key characteristics.
This ensures that the natural process spread remains comfortably within drawing tolerances before lot acceptance sampling begins.
Inconsistent failure definitions between cell manufacturers and system integrators lead directly to disputed batch rejections, delayed assembly lines, and unallocated inventory costs during peak production runs.

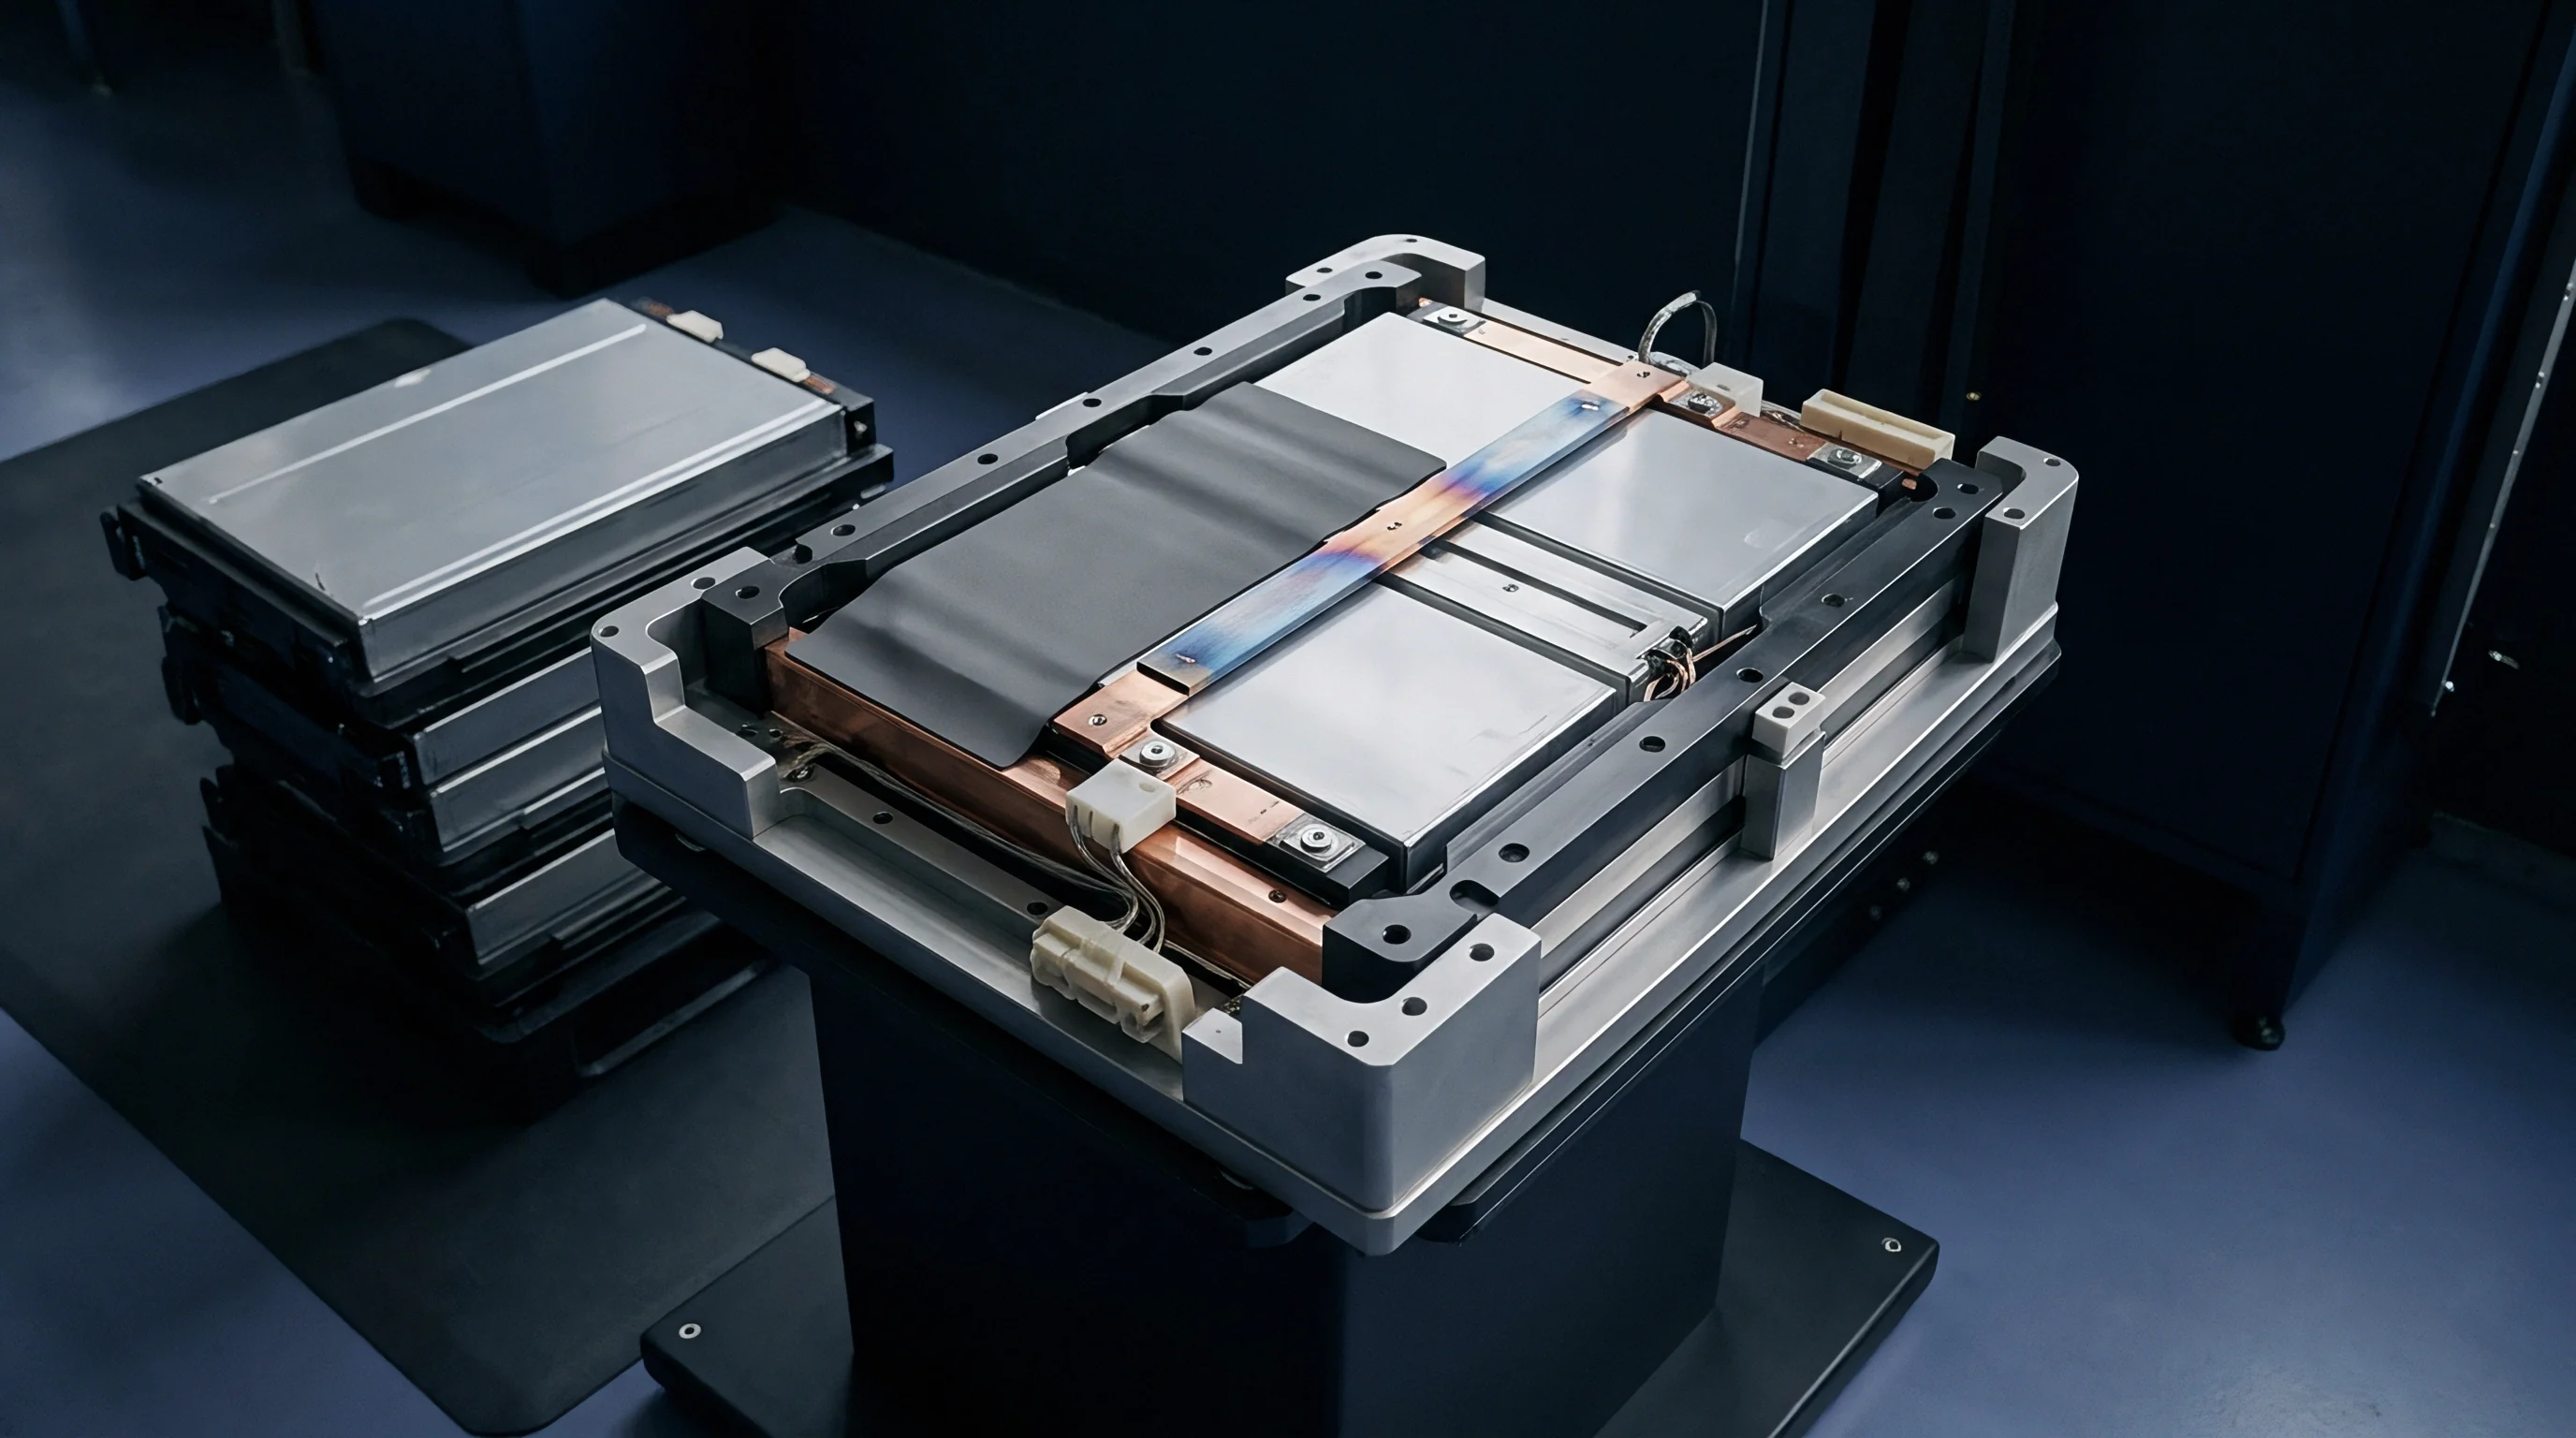
Swell

Metrology for Case Deformation and Dimensional Creep
Mechanical verification of prismatic cells demands specialized gauging fixtures because thin-walled aluminum enclosures are inherently flexible. Unrestrained cells show thickness variations from internal gas pressure, electrode swelling during lithiation, and structural relaxation after electrolyte injection. Standardizing thickness measurements requires setting precise clamping pressures during incoming inspection.
Measuring cell thickness without a defined constraint yields inconsistent data that fails to correlate with module pack geometry.
Common lithium-ion chemistries ~ particularly graphite anodes paired with high-nickel cathodes ~ expand anisotropically along the electrode stack axis. During charging, lithium intercalation into graphite increases the crystallographic c-axis lattice parameter, causing volumetric expansion of three to ten percent at the electrode level. Over repeated charge-discharge cycles, gas generation from solid electrolyte interphase growth adds internal pneumatic pressure.
Housing wall deflection occurs mainly on the broad face of the aluminum can. Measuring this deformation requires planar pressure plates that apply a standard load, typically 300 to 500 kilopascals, to mirror the structural preload of the module enclosure.
Terminal coplanarity and height must also be inspected relative to baseline datum surfaces. Prismatic cells incorporate positive and negative terminal posts ~ often copper-aluminum composite rivets ~ protruding through top cap insulating seals. Out-of-plane terminal tilts prevent continuous contact with rigid copper or aluminum busbars during laser welding.
Laser tracking systems detect height variations, but coordinate measuring machines with touch probes establish definitive mechanical compliance. Pin gauges then confirm cap vent clearance, fill-port plug protrusion, and locating pin fitment.
Measuring prismatic cell swelling under active thermal cycling yields reliable creep data only when mechanical restraint fixtures simulate final pack stack pressure.

Electrical and Electrochemical Screening Protocols
Electrochemical incoming inspection isolates latent defects that bypass visual or mechanical checks. Open circuit voltage, AC internal impedance at one kilohertz, direct current internal resistance, and insulation resistance form the core diagnostic battery. Together, these parameters reveal internal structural anomalies, poor electrolyte wetting, and separator damage before cells enter automated assembly lines.
Open circuit voltage measurements indicate state of charge and self-discharge behavior. Comparing voltage upon receipt against factory dispatch readings yields the self-discharge rate, expressed as the K-value in millivolts per day. Accelerated self-discharge signals microscopic metallic contamination, such as iron or copper particulates introduced during electrode slitting.
These contaminants form micro-dendrites that bridge the separator, creating localized current leakage channels. A cell exhibiting an elevated K-value poses a high risk of field failure and belongs in the critical or major non-conformance category.
Direct current internal resistance reflects the total voltage drop under a high-current load pulse, combining ohmic, charge transfer, and mass transport polarization resistance. Testing involves applying a 1C or 3C discharge pulse for ten seconds at a controlled temperature of 25 degrees Celsius, accurate within plus or minus 0.5 degrees. High resistance indicates poor tab-to-terminal weld integrity, inadequate electrolyte fill, or degraded active material coatings.
AC impedance at one kilohertz provides a rapid check of electronic and ionic conductivity across current collectors, tabs, and electrolyte, serving as a high-speed screening metric.
Insulation resistance testing evaluates the dielectric integrity of the outer PET sleeve and internal insulation barriers between the electrode stack and aluminum case. A high-voltage DC potential, typically 500 to 1,000 volts, is applied between the positive terminal and the outer aluminum housing. Leakage current exceeding a few microamperes, or insulation resistance falling below 100 megohms, points to a breached sleeve or internal cap-seal fault.
Damaged insulation allows stray currents to flow through the pack chassis, triggering ground-fault alarms in the battery management system.
Executing quality verification on prismatic cell shipments involves a defined sequence of mechanical and electrochemical steps upon receipt at the integration facility.
- Verify freight seal integrity, inspect shock indicators on pallet packaging, and record ambient temperature logging data from transport data loggers.
- Uncrate pallets in an ESD-safe, clean-room environment held at 25 degrees Celsius and 45 percent relative humidity, allowing cells to thermally equilibrate for 24 hours.
- Perform visual inspection on the drawn sample lot, checking for sleeve scratches, cap deformation, electrolyte residue around vent discs, and terminal oxidation.
- Mount the target cell into a calibrated pneumatic plate fixture, applying 300 kilopascals of uniform surface pressure across the broad face before measuring thickness with digital indicators.
- Measure terminal-to-terminal coplanarity, terminal height relative to the top cap datum, and locating hole dimensions using a automated coordinate measuring machine.
- Record open circuit voltage using a 6.5-digit digital multimeter and measure one-kilohertz AC impedance with an LCR meter.
- Apply a ten-second discharge pulse at 1C rate on a high-precision cell cycler to calculate direct current internal resistance from the instantaneous voltage drop.
- Conduct insulation resistance testing at 500 volts DC between the terminal contacts and the uninsulated aluminum case bottom to confirm dielectric barrier integrity.
Impedance drift signals internal damage long before volumetric swelling shows up on physical measurement tools.


Sieve

Sampling Level Selection and Producer Risk Curves
Selecting inspection levels determines the balance between statistical rigor and throughput in high-volume cell receiving. Standards divide inspection into General Inspection Levels I, II, and III, alongside Special Inspection Levels S-1 through S-4. General Level II serves as the default for non-destructive cell testing.
Choosing Level III expands the sample size, sharpening the Operating Characteristic curve to reduce consumer risk, but it increases test channel usage and labor overhead. Level I reduces sample size when quality history confirms sustained supplier capability.
Special Inspection Levels cover tests that are destructive, complex, or extremely time-consuming. Full 1C capacity testing, nail penetration, thermal abuse exposure, and CT scan cross-sections consume substantial laboratory capacity. Level S-3 or S-4 allows quality engineers to draw a smaller sub-sample while maintaining statistical control.
The smaller sample size increases the producer risk of lot rejection from isolated outliers, forcing suppliers to maintain tight process capability before agreeing to small-sample acceptance criteria.
Switching rules enforce dynamic shifting between normal, tightened, and reduced sampling modes based on real-time performance. If two out of five consecutive incoming lots are rejected under normal inspection, the protocol demands an immediate transition to tightened inspection. Under tightened inspection, the allowable defect number for a given sample size is reduced or the sample size is expanded.
This shift protects the plant from accepting substandard batches during periods of process instability. Returning to normal inspection requires five consecutive lots to pass without non-conformance under tightened rules.
Double and multiple sampling plans offer operational flexibility when evaluating marginal batches. In a double sampling scheme, an initial smaller sample is evaluated. If the defect count falls between the first acceptance and rejection thresholds, a second sample is drawn.
Cumulative defects across both samples determine final lot disposition. This method minimizes testing for exceptionally clean or obviously defective lots while maintaining statistical rigor for borderline shipments.
| Lot Size Range (Units) | Sample Code Letter | Sample Size (Cells) | AQL 0.010 (Ac / Re) | AQL 0.15 (Ac / Re) | AQL 0.40 (Ac / Re) | AQL 1.50 (Ac / Re) |
|---|---|---|---|---|---|---|
| 3,201 to 10,000 | L | 200 | 0 / 1 | 0 / 1 | 2 / 3 | 7 / 8 |
| 10,001 to 35,000 | M | 315 | 0 / 1 | 1 / 2 | 3 / 4 | 10 / 11 |
| 35,001 to 150,000 | N | 500 | 0 / 1 | 2 / 3 | 5 / 6 | 14 / 15 |
| 150,001 to 500,000 | P | 800 | 0 / 1 | 3 / 4 | 7 / 8 | 21 / 22 |

Worked Lot Acceptance Calculation for Mass Shipments
To demonstrate how statistical lot acceptance works in practice, consider a shipment of 40,000 units of 280-ampere-hour prismatic lithium-iron-phosphate cells delivered to a pack manufacturing plant. The master supply contract specifies ISO 2859-1 General Inspection Level II, Single Sampling Plan for Normal Inspection, with designated AQL targets: Critical Defect at 0.010%, Major Functional Defect at 0.15%, Major Physical Defect at 0.40%, and Minor Cosmetic Defect at 1.50%.
Consulting standard inspection tables for a lot size of 40,000 units under General Level II yields Sample Size Code Letter N. This code mandates a primary sample size of 500 cells drawn randomly across all delivered pallets. The 500 units undergo non-destructive electrical and mechanical screening, while a sub-sample of 32 cells selected under Special Inspection Level S-3 undergoes full 1C capacity verification and high-current pulse testing.
Standard procurement audits evaluate sample sizes over consecutive delivery cycles. Out of the primary sample of 500 cells, zero critical safety defects are detected, satisfying the 0.010% threshold where the acceptance number is zero and the rejection number is one. Mechanical inspection reveals two cells with out-of-spec broad-face thickness exceeding the 71.5-millimeter limit under 300 kilopascals of pressure, and one cell with a terminal height coplanarity error exceeding 0.3 millimeters.
These three instances fall under Major Physical Defects. For AQL 0.40% at sample size 500, the acceptance criteria table sets the accept number at 5 and reject number at 6. Since 3 non-conformances were found, the shipment passes the Major Physical category.
Electrochemical testing reveals two cells with direct current internal resistance values exceeding the maximum spec limit of 0.35 milliohms, and one cell showing an accelerated voltage drop indicating a high self-discharge K-value. These three failures represent Major Functional Defects. For AQL 0.15% at sample size 500, table values dictate an acceptance number of 2 and a rejection number of 3.
Because 3 defects were identified, the lot reaches the rejection threshold, and the entire shipment of 40,000 prismatic cells is formally rejected at incoming inspection.
Statistical sampling plans protect buyers against systemic factory drift while bounding the supplier risk of lot rejection from isolated measurement variance.
What specific secondary screening or localized sorting protocols should be legally permitted when an incoming cell lot fails its primary AQL limit but immediate production schedules prevent total batch rejection?


Quarantine

Commercial Cost Consequences of Substandard Shipments
When an incoming shipment of prismatic cells fails lot acceptance criteria, the financial impact extends far beyond the direct purchase price of the rejected units. A rejected batch disrupts manufacturing schedules, idling automated laser welding lines, module assembly equipment, and specialized labor. Unmitigated cell shortages then cause downstream delays in delivering finished energy storage systems or electric vehicle battery packs, triggering severe late-delivery penalties from customers.
Holding rejected cell inventory creates substantial warehouse and logistics expenses. Large prismatic cells are Class 9 Hazardous Materials under UN 3480 regulations, requiring specialized, climate-controlled quarantine storage equipped with fire suppression and thermal monitoring. Holding dangerous goods in isolation costs significantly more than standard dry storage.
Administrative overhead also climbs as quality teams generate non-conformance reports, compile test logs, and open root-cause investigations with cell manufacturers.
Scrap allocations and rework expenses represent a major point of financial exposure. If a supplier refuses to accept a full batch return, arguing that damage occurred during ocean transit or customs delays, the buyer faces unrecoverable material costs. Reworking prismatic modules by disassembling laser-welded busbars or replacing individual defective cells within glued cell stacks is rarely viable; the mechanical bond strength of structural polyurethane adhesives tears adjacent cell sleeves during extraction.
Rejection at the incoming cell level remains the only practical boundary.
| Non-Conformance Severity | Direct Financial Liability | Operational Remediation Path | Freight and Customs Duty Allocation | Default Resolution Timeframe |
|---|---|---|---|---|
| Critical Safety Defect | 100% Supplier Reimbursement + Consequential Claims | Immediate Lot Quarantine, Full Shipment Return or On-Site Destruction | 100% Supplier Liability including Return Freight | 5 Business Days |
| Major Functional Defect | Full Batch Replacement or Credit Note | Lot Quarantine, Supplier 100% Sorting, Replacement Order Trigger | Supplier Pays Replacement Transport and Import Tariffs | 10 Business Days |
| Major Physical Defect | Batch Replacement or Sorting Labor Cost Recovery | On-site Third-Party Sorting, Rework of Acceptable Units | Split Liability based on Transit Damage Root Cause Analysis | 15 Business Days |
| Minor Cosmetic Defect | Commercial Discount or Line-Item Credit | Accept Under Concession, Line Utilization with Visual Monitoring | Buyer Absorbs Freight, Supplier Issues Fee Concession | 30 Business Days |

Root Cause Arbitration and Liability Seams
Resolving commercial disputes over rejected cell batches requires clear contractual terms defining where supplier liability ends and buyer risk begins. The point of risk transfer usually anchors on Incoterms, such as Delivered Duty Paid or Free Carrier at foreign ports. However, electrical degradation and latent defects like elevated K-values or internal short circuits cannot be caught during visual checks at port clearance.
The warranty window must remain open until formal incoming inspection is complete at the integration plant.
Determining whether capacity loss or impedance growth occurred during factory production or marine transport relies on sensor logs from environmental monitoring equipment. Packaging crates must incorporate calibrated multi-axis shock sensors and temperature data loggers. If cells experience temperatures exceeding 50 degrees Celsius or drops exceeding structural threshold limits during transit, the supplier can attribute separator degradation or casing leakage to transport mishandling.
Conversely, if transport logs show stable thermal conditions below 25 degrees and shock levels within specification, financial liability rests with the cell manufacturer.
When a tier-one shipment failed dimensional checks, the buyer recovered 184,000 dollars in freight and rework costs through standardized RMA documentation. That recovery depended entirely on presenting unambiguous CMM dimension traces cross-referenced against factory lot certificates. Without standardized AQL metrics and calibrated receiving test equipment, vendors can dispute local measurements, claiming calibration offset or improper clamping technique.
Structured incoming inspection protocols provide the objective evidence required to secure commercial adjustments, credit notes, or air-freighted replacement inventory.
Systematic disposition of non-conforming prismatic cell lots relies on strict procedural steps to control financial exposure and prevent compromised units from entering module production.
- Quarantine Segregation Rule dictates that failed cell lots must be physically isolated immediately in a dedicated, locked ESD safe area equipped with thermal cameras and automatic aerosol fire suppression systems.
- Formal Non-Conformance Issuance requires generating a detailed digital ticket within twelve hours of test failure, attaching raw CMM data, voltage logs, and high-resolution optical imagery.
- Joint Counter-Testing Provision gives the cell manufacturer five business days to send an authorized field application engineer to re-verify measurements using calibrated secondary standards on-site.
- Return Material Authorization Trigger obligates the vendor to supply return shipping labels or authorize certified local hazardous material disposal within ten business days of confirmed failure.
- Consequential Cost Recovery Clause enforces direct invoicing of warehouse hold fees, third-party laboratory verification costs, and production line downtime charges to the cell supplier.
Receiving facility test channels can introduce parasitic lead resistance that inflates measured internal impedance beyond factory gate specifications.


Paperwork
Master Supply Agreement Metric Harmonization
Legal contracts governing battery cell procurement must reference concrete technical measurement standards rather than vague quality guarantees. Standardizing Acceptance Quality Limit terms requires embedding engineering drawings, test procedures, and statistical tables directly into Master Supply Agreement annexes. When a contract relies on generic phrases like high reliability or market-grade quality, arbitration tribunals struggle to resolve technical disputes over marginal cell batches.
Harmonizing technical definitions requires aligning supplier factory gate testing with buyer receiving inspection. Discrepancies routinely arise when cell manufacturers measure capacity using a C/3 charge-discharge rate at 30 degrees Celsius while the buyer’s receiving protocol uses a 1C rate at 22 degrees Celsius. Higher discharge rates and lower ambient temperatures reduce measured capacity through ohmic voltage drops and slower lithium-ion diffusion kinetics in the electrolyte.
The master agreement must specify identical C-rates, cut-off voltages, ambient temperatures, and thermal soak times for both factory release certification and incoming inspection.
Procurement teams structure supply contracts around verifiable test protocols rather than vendor datasheets. Datasheets list typical performance achieved under idealized laboratory conditions, whereas incoming quality controls enforce minimum guaranteed thresholds. Explicit contractual definitions prevent suppliers from claiming that capacity distributions falling three percent below nominal rating remain acceptable because they meet typical marketing averages.
The contractual annex must stipulate that every delivered cell meet or exceed the minimum guaranteed amp-hour capacity under specified AQL sampling levels.
Incorporating IEC 62660-2 incoming test conditions into the master supply agreement eliminates disputes regarding cell capacity degradation during transit.

Dossier Architecture for Traceability and Warranty Claims
Defensible quality enforcement relies on a complete technical data dossier accompanying every cell shipment. Each prismatic cell must carry a high-density, laser-etched Data Matrix code on its top cap, encoding its unique serial number, factory location, line number, manufacturing date, and raw material batch identifiers. Scanners integrated into test fixtures read these codes, automatically linking physical test results to individual cell serial numbers inside the buyer’s manufacturing execution system.
The Certificate of Analysis issued by the cell manufacturer must be delivered digitally before freight arrives, containing full statistical distributions for open circuit voltage, internal resistance, fill weight, and baseline capacity for the lot numbers in the shipment. Automated receiving software cross-checks factory gate data against incoming sample test data. If variance between factory release distributions and receiving inspection distributions exceeds predefined control limits, the system triggers an automatic hold, even if absolute values fall within drawing tolerances.
This early warning flags potential transit degradation or undisclosed factory process changes.
Traceability data structures safeguard long-term warranty rights once battery packs enter field operation. If a specific cell batch exhibits accelerated capacity fade or thermal failure after twelve months of customer operation, battery management system logs are cross-referenced against the original procurement dossier. Precise serial-number-level traceability limits recalls to specific, verified cell production lots rather than forcing global recalls across entire product lines.
Comprehensive documentation standardizes technical quality, protects corporate capital, and enforces accountability across the global battery supply chain.
Section 14.2 of the standardized master supply agreement stipulates that incoming lot acceptance testing conducted in accordance with ISO 2859-1 General Inspection Level II shall serve as the binding legal basis for material acceptance, shifting all freight, testing, and quarantine expenses to the seller upon formal issuance of a Notice of Rejection.