Statistical Process Control Procedures for Zero Acceptance Incoming Cell Screening Protocols
Implement C=0 incoming cell sampling with four-wire Kelvin metrology and temperature-corrected K-value SPC to reject defect lots before pack assembly.
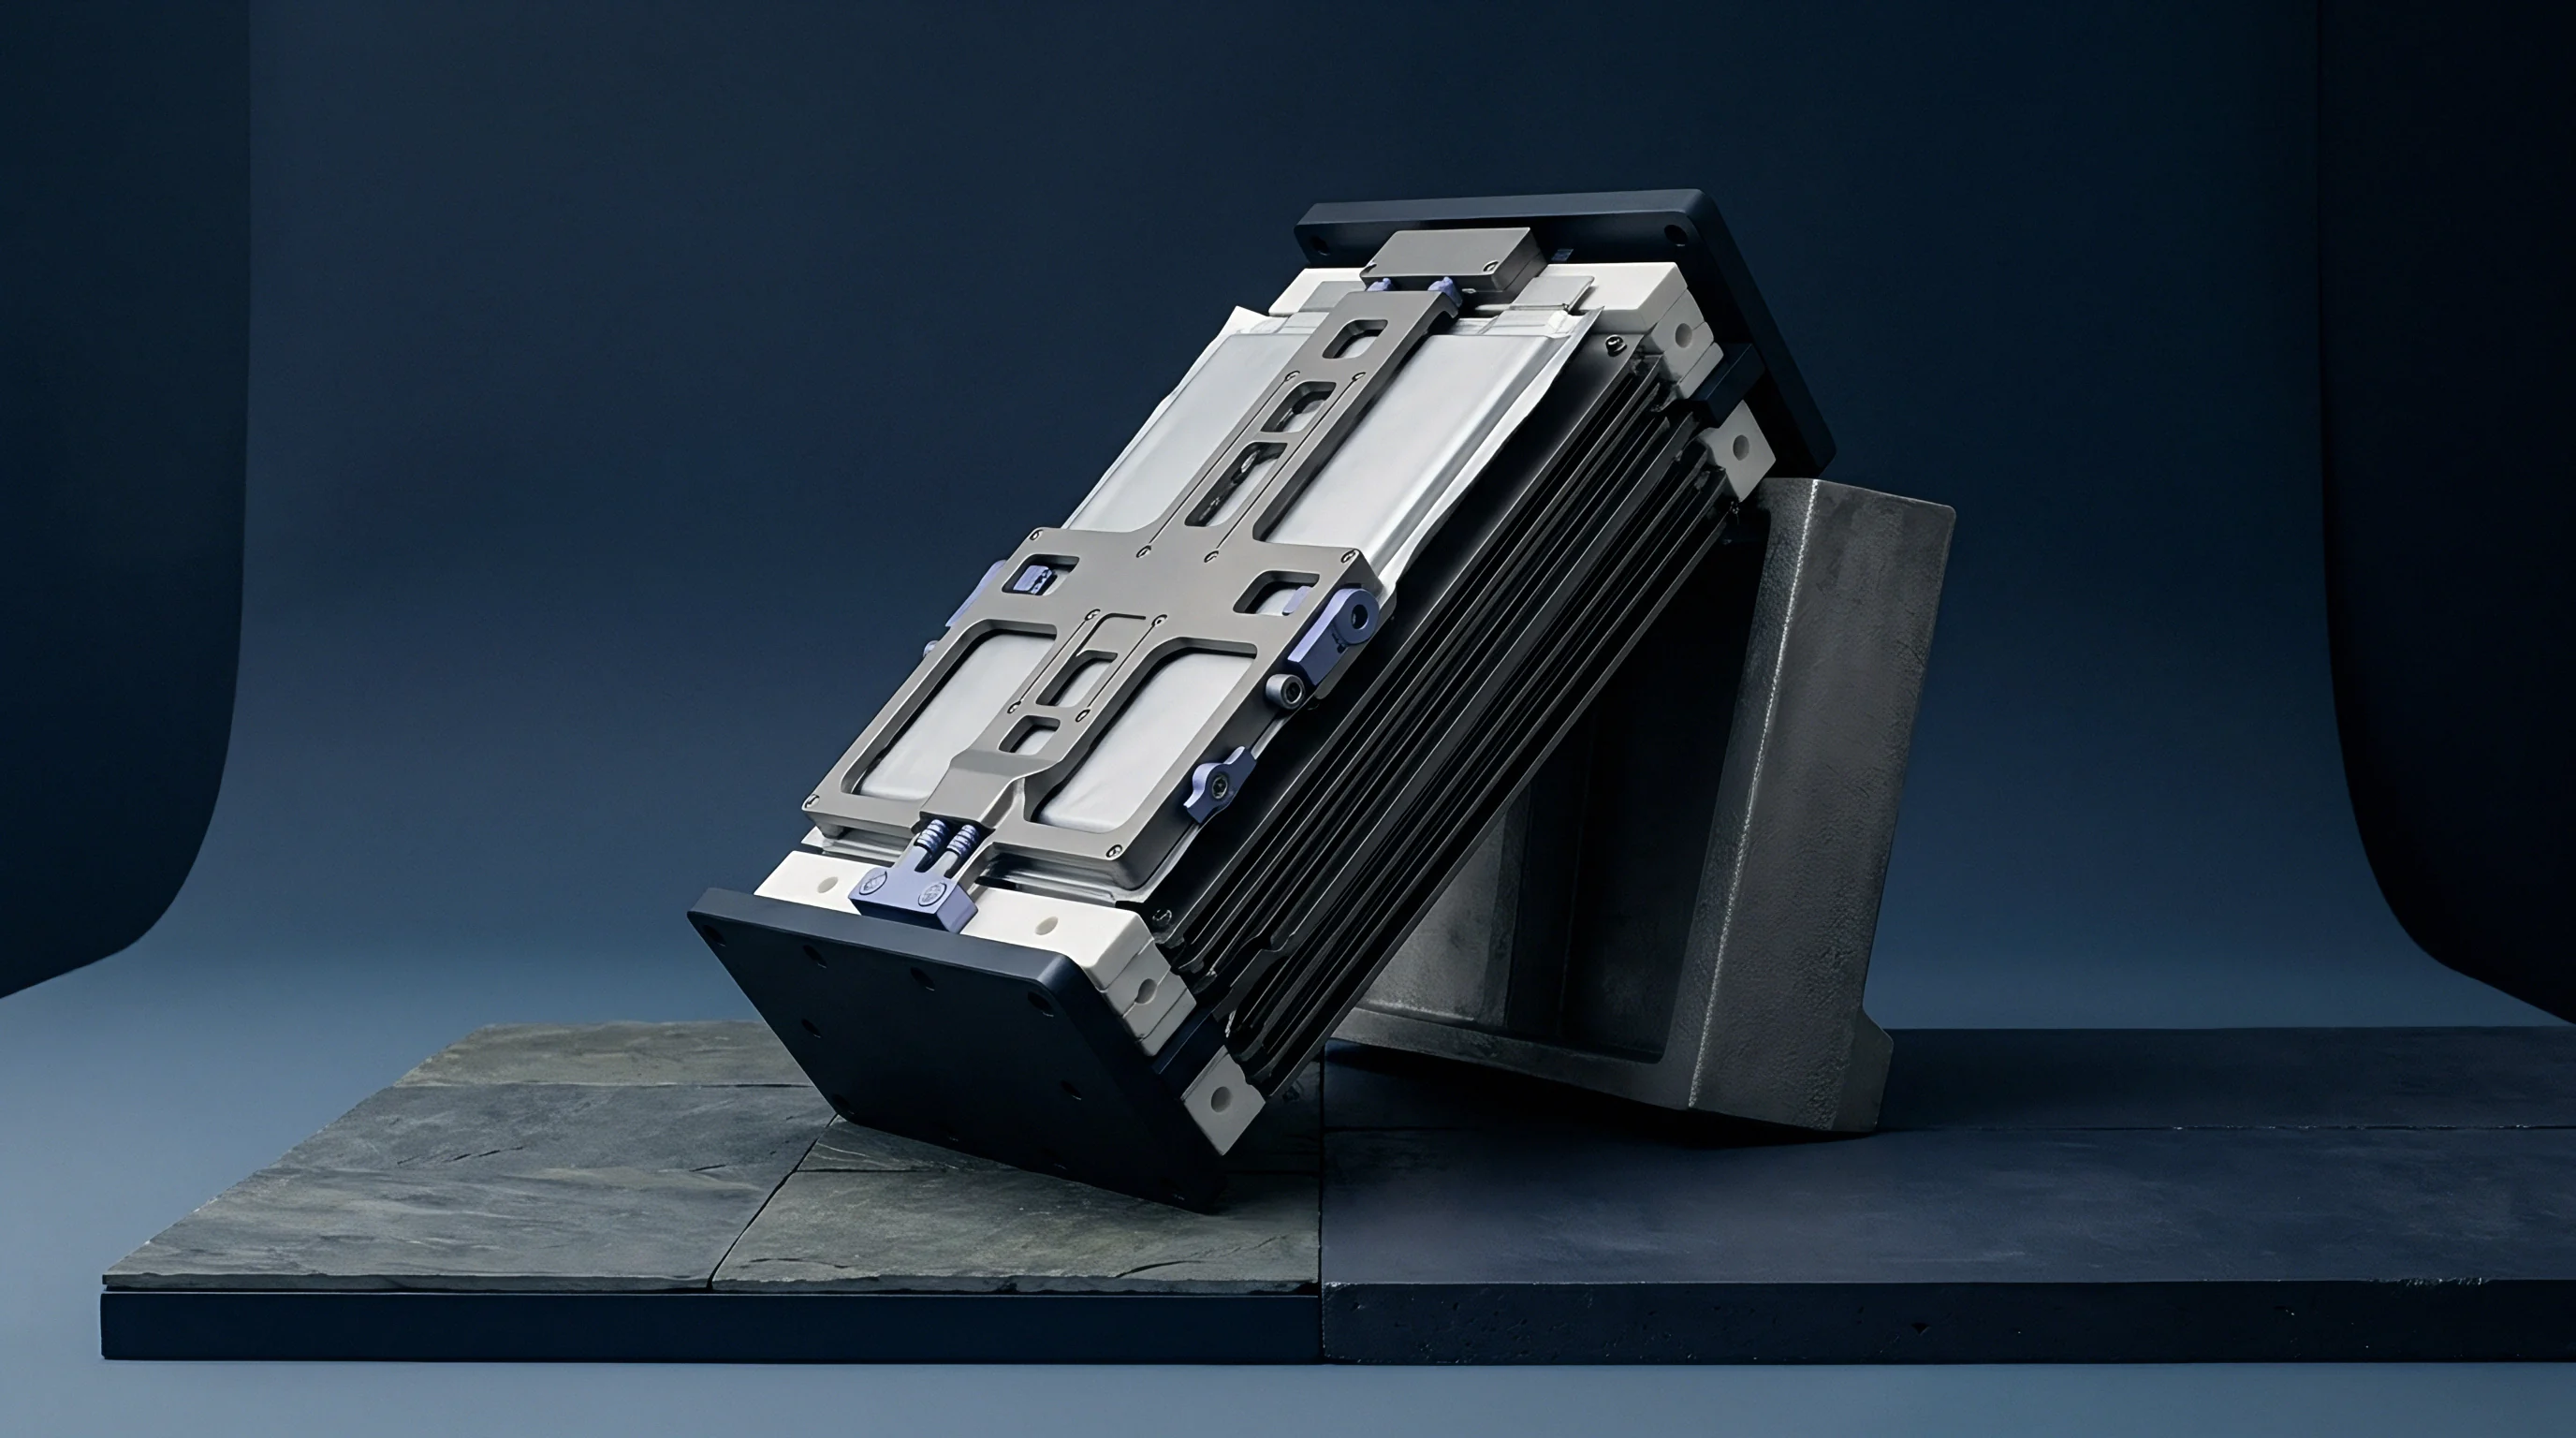

Dock
Incoming shipments of lithium-ion cells reach receiving bays under varied transit histories, pallet layouts, and charge levels. Transferring cells from a shipping container into climate-controlled storage marks the first critical boundary in a zero-acceptance screening program. Under a zero-acceptance protocol built on Nicholas L. Squeglia’s C=0 methodology, a single non-conforming cell in a sample lot forces immediate quarantine and rejection of the entire shipment.
Standard MIL-STD-105E or ANSI/ASQ Z1.4 sampling tables allow non-zero acceptance numbers, which lets a calculated fraction of defective parts pass into inventory. For direct integration into high-voltage battery modules, non-zero acceptance is financially unworkable: one high-resistance cell or micro-shorted electrode pair threatens an entire series string, causing premature pack teardowns or thermal runaway.
Forming proper inspection lots maintains statistical validity across the workflow. A valid lot must consist of cells produced under uniform manufacturing conditions ~ defined by identical electrode slurry batches, separator coating runs, electrolyte fill lots, and formation cycling schedules. Mixing multiple lot codes into a single sample breaks the underlying probability distribution assumptions.
When receiving fifty thousand 21700 cylindrical cells or three thousand 300 Ah prismatic cells, verification begins by segregating the shipment into discrete master lots using supplier traceability codes on the cell sleeves or matrix barcodes. Environmental stabilization must precede electrical testing. Cells pulled from cold air-freight holds or warm trailers develop non-uniform thermal gradients across their electrode stacks.
Testing before reaching internal thermal equilibrium adds artificial variance to open-circuit voltage and internal impedance, distorting the capability index for the whole sample.

Thermal Equilibrium Limits and Sample Allocation
Precision screening requires a minimum thermal dwell of twenty-four hours inside an environmental chamber set to twenty-three degrees Celsius, plus or minus two degrees. Thermal stabilization curves indicate that a large-format prismatic cell over five kilograms needs up to eighteen hours for core-to-skin temperature convergence when starting from a ten degree offset. Probes attached to thermally unstable cells measure transient open-circuit voltages shifted by localized temperature coefficients ~ typically negative zero point2 millivolts to negative zero point5 millivolts per degree Celsius for nickel-manganese-cobalt lithium chemistry.
The sample size n drawn from a lot size N under a C=0 plan depends strictly on the specified Lot Tolerance Percent Defective and the associated supplier risk producer level. Unlike traditional AQL sampling where the acceptance number c exceeds zero, C=0 plans set sample sizes to guarantee a ninety percent confidence level of rejecting any lot whose defect rate hits the target Lot Tolerance Percent Defective.
| Lot Size Range (N) | Sample Size (n) for AQL 0.10 | Sample Size (n) for AQL 0.25 | Sample Size (n) for AQL 0.65 | LTPD / P0.10 Equivalent (%) |
|---|---|---|---|---|
| 1 to 150 | 13 | 8 | 5 | 15.8 |
| 151 to 500 | 50 | 20 | 12 | 4.5 |
| 501 to 1,200 | 80 | 32 | 20 | 2.8 |
| 1,201 to 3,200 | 125 | 50 | 32 | 1.8 |
| 3,201 to 10,000 | 200 | 80 | 50 | 1.1 |
| 10,001 to 35,000 | 315 | 125 | 80 | 0.72 |
| 35,001 to 500,000 | 500 | 200 | 125 | 0.46 |
Rigorous randomization protects the physical pull from selection bias. Pulling only from the top tier of a pallet skews results by ignoring vibration settling or transit impacts that hit bottom crates hardest. A stratified random sampling strategy pulls cells from across the full spatial volume of the stack.
Technicians assign sequential numbers to all shipping cartons and draw specific boxes using a random number generator. Within each selected box, cell selection follows a predefined spatial matrix. If visual checks reveal crushed corner posts, compromised moisture-barrier seals, or tripped desiccant indicators before extraction, the shipment is rejected on the spot.
- Receiving Registration logs pallet barcode identifiers, transit temperature recorder data, bills of lading, and supplier certificate of analysis records into the quality management database.
- Pallet Depalletization Quarantine moves crates directly into climate-controlled receiving holding bays operating at twenty-three degrees Celsius and forty-five percent relative humidity.
- Thermal Dwell Verification tracks surface temperatures on representative outer and core cells using calibrated contact thermistors until thermal equilibrium tolerance holds for four continuous hours.
- Stratified Random Selection calculates sample locations across top, middle, bottom, outer, and inner pallet positions according to the target C=0 sample size table.
- Visual Packaging Audit checks primary cell bags, terminal protective covers, and tray dividers for mechanical scuffs, electrolyte leakage stains, or broken vacuum seals.
- Metrology Queue Transfer places identified sample cells into insulated transport totes to preserve thermal equilibrium while moving them to the electrical test channel.
Statistical process control relies on the complete independence of every sampled unit. When inspecting high-density cells, physical handling risks surface contamination or terminal oxidation. Automated pick-and-place systems with vacuum cups prevent local casing deformation during sample transfer.
Technicians handling cells manually wear cleanroom nitrile gloves to keep skin oils off nickel-plated or aluminum terminal pads, avoiding increases in electrical contact resistance during four-wire Kelvin probing. Each sampled cell receives a temporary tracking barcode linked directly to its original master pallet coordinates and factory serial number.
The statistical mathematics underlying C=0 sampling reliance rests on the hypergeometric probability distribution, expressed as:
P(x = 0) = fracbinomD0 binomN – DnbinomNn le 0.10
where N represents total lot size, D represents the total number of non-conforming units in the lot, and n represents the sample size drawn. Setting the upper limit for lot acceptance probability P(x=0) at zero point10 ensures that if the true defect rate exceeds the Lot Tolerance Percent Defective threshold, the probability of rejecting the lot remains at least ninety percent. Standard AQL plans allow c values above zero, shifting the operating characteristic curve to the right and allowing marginal lots to pass when supplier production volumes are high.
C=0 plans force the operating characteristic curve down sharply from the origin, leaving no margin for vendor defects.
A shipping container holding forty thousand cells evaluated under a C=0 plan at a target AQL of zero point10 requires a sample size of five hundred units. If all five hundred clear visual, dimensional, voltage, and impedance checks, the lot is accepted into stock. If cell four hundred and ninety-nine exhibits an internal resistance exceeding upper specification limits by just zero point05 milliohms, testing halts immediately.
That single defect rejects the whole lot, locking the remaining thirty-nine thousand five hundred cells out of production. The vendor receives an immediate quarantine notice alongside complete metrology traces for the failed unit.
Lot boundaries extend past physical pallet groups into temporal production shifts at the plant. On continuous high-volume lines, lot codes tie back to the electrode coating lot, electrolyte batch ID, and formation aging tray index. Quality engineers audit supplier batch records against incoming tags.
If a shipment bridges two separate electrode slurry batches, it is split into two distinct inspection lots, with independent C=0 sample sizes calculated for each. Failing to separate slurry lots hides localized variations in coating thickness and invalidates baseline control charts.
In incoming cell inspection, a mixed lot always behaves like its worst performing cell batch.


Gauge
Electrical and physical metrology at receiving demands measurement systems where total gauge repeatability and reproducibility accounts for less than ten percent of the engineering tolerance. Measuring open-circuit voltage with sufficient short-term accuracy requires seven-and-a-half-digit digital voltmeters calibrated against primary voltage standards. For instance, a cell specification from three point six zero zero volts to three point six five zero volts leaves a tolerance window of fifty millivolts.
Keeping the precision-to-tolerance ratio under ten percent means the voltmeter and test leads must maintain a combined uncertainty below zero point five millivolts across the ambient operating temperature range. Standard two-wire leads are unsuitable here because contact resistance varies at the probe interface, making four-wire Kelvin fixtures mandatory for all voltage and impedance tests.
Four-wire Kelvin setups isolate current-carrying drive lines from sense lines, removing lead resistance and probe contact drops from the reading. Spring-loaded pogo pins applied to nickel-plated cylindrical caps or laser-welded aluminum prismatic terminals can introduce uneven contact pressure. If spring force drops below four Newtons per contact point, local contact resistance spikes, introducing artificial milliohms into measured AC internal resistance.
Automated inspection stations use pneumatic fixtures that hold probe contact force at eight Newtons plus or minus zero point two Newtons, relying on gold-plated crown-point tips to pierce surface oxides without damaging the terminal base metal.
Measuring cell internal resistance with four-wire Kelvin probes at eight Newtons actuation force limits contact impedance variance to less than zero point zero one milliohms across ten thousand repeated insertions.
AC internal resistance screening operates at a nominal frequency of one kilohertz using sinusoidal current excitation. This one-kilohertz measurement isolates the cell’s pure ohmic resistance ~ governed by electrolyte conductivity, separator ionic resistance, current collector foil resistance, and weld contact points. It bypasses the slower charge-transfer resistance and diffusion dynamics of low-frequency electrochemical behavior.
A high AC IR value indicates mechanical weld fractures, incomplete tab welding, electrolyte dry-out, or poor foil coating contact. Test equipment applies a controlled zero point one ampere AC excitation and logs the real part of the complex impedance Z’ to a resolution of zero point zero zero one milliohms.

DC Resistance Pulse Dynamics and Thermal Offsets
DC internal resistance testing complements AC impedance measurements by capturing electrochemical charge-transfer resistance alongside ohmic impedance. The test applies a high-current discharge pulse ~ typically one or two times rated nominal capacity ~ for ten seconds while logging voltage decay at one hundred Hertz. Calculating DC IR follows Ohm’s law, dividing the voltage drop Δ V between the pre-pulse rest voltage and the end of the ten-second step by the applied current step Δ I. This ten-second pulse forces lithium ions through the solid electrolyte interphase layer and active materials, making DC IR sensitive to SEI degradation, gas formation, and active material dissolution.
Thermal control during DC IR testing must be strict. A twenty-ampere pulse through a small pouch cell generates localized I2 R Joule heating at internal tab-to-foil connections. Testing cells sequentially on a single fixture without proper heat sinking warms the fixture, causing later cells to register artificially low internal resistance due to increased electrolyte ionic mobility.
Screening stations use temperature-controlled copper contact blocks cooled by thermoelectric Peltier elements, holding terminal interface temperatures at twenty-three degrees Celsius plus or minus zero point one degree during high-current pulses.
| Metrology Parameter | Measurement Range | Instrument Resolution | System Accuracy Spec | Target %GRR (of Tolerance) |
|---|---|---|---|---|
| Open Circuit Voltage (OCV) | 2.5000 V to 4.3000 V | 0.0001 V (100 µV) | ± 0.0005 V (500 µV) | < 6.5% |
| AC Impedance (1 kHz) | 0.100 mΩ to 50.000 mΩ | 0.001 mΩ (1 µΩ) | ± 0.005 mΩ (5 µΩ) | < 8.0% |
| DC Internal Resistance (10s) | 0.50 mΩ to 100.00 mΩ | 0.01 mΩ (10 µΩ) | ± 0.02 mΩ (20 µΩ) | < 9.0% |
| Prismatic Thickness (300 kPa) | 10.000 mm to 100.000 mm | 0.001 mm (1 µm) | ± 0.005 mm (5 µm) | < 5.0% |
| Cylindrical Height / Outer Dia | 10.000 mm to 150.000 mm | 0.001 mm (1 µm) | ± 0.003 mm (3 µm) | < 4.5% |
| Cell Mass | 10.00 g to 10,000.00 g | 0.01 g | ± 0.02 g | < 3.0% |
Dimensional screening requires test fixtures that reflect the physical constraints of an assembled battery module. Prismatic and pouch cells expand and contract during cycling, showing viscoelastic creep under sustained load. Measuring envelope thickness without controlling face compression produces inconsistent results.
Standard protocols use an automated mechanical press with calibrated load cells to apply three hundred kilopascals of uniform compression across the broad faces of the pouch or prismatic casing. Laser displacement sensors mounted on rigid granite bases scan the surface profile, calculating maximum, minimum, and average thickness across nine designated grid points.
For cylindrical cells, dimensional metrology measures total axial height, button-top protrusion height, outer diameter concentricity, and bottom seal roll depth. Non-contact optical telecentric inspection systems measure outer profiles without mechanical deformation. A telecentric lens projects a parallel light beam across the cell body, casting its shadow onto a high-resolution CMOS array.
Algorithms analyze diameter profiles across two hundred vertical slices in under five hundred milliseconds, catching ovality, canister swelling, and shoulder bulging from gas pressure built up during formation.
Structural and electrical screening failures reveal specific internal battery defect mechanisms:
- Tab Weld Intermetallic Degradation drives elevated AC internal resistance values at one kilohertz due to micro-cracking or insufficient laser penetration at the internal current collector copper and aluminum junction points.
- Separator Pin-Holes and Delamination lead to high localized self-discharge rates, causing accelerated open-circuit voltage drop profiles over time due to low-resistance internal leakage pathways.
- Electrolyte Under-Filling manifests as simultaneous high DC internal resistance, depressed discharge rate capability, and reduced cell mass below low control limits due to insufficient ionic pathway coverage across the separator matrix.
- Electrode Alignment Skew generates localized current density concentration, visible through non-uniform face swelling under three hundred kilopascals compression, increasing long-term lithium plating risks at electrode edges.
- Incomplete Formation Passivation yields active micro-cracking of the solid electrolyte interphase, causing erratic voltage drift and continuous internal gas evolution that deforms prismatic soft-pouch packaging walls.
Gage Repeatability and Reproducibility studies must precede formal incoming cell screening operations. A standard ten-by-three-by-three Gage R&R trial requires ten representative cells covering the full range of process variation, three trained inspection operators, and three trial replicates per operator. Analysis of variance techniques decompose total observed measurement variance σ2total into distinct components:
σ2total = σ2part + σ2equi±ent + σ2operator + σ2interaction
Where equipment variance σ2equi±ent represents repeatability and operator variance σ2operator represents reproducibility. Gauge R&R expressed as a percentage of total process variation or tolerance must stay below ten percent. If it falls between ten and thirty percent, system capability is marginal, requiring immediate probe cleaning, improved fixture rigidity, or operator retraining.
Any measurement system showing Gauge R&R above thirty percent is disqualified immediately, as measurement error would mask real lot non-conformances.
High contact resistance in test leads corrupts control charts by artificially depressing process capability metrics. An uncalibrated fixture that adds zero point two milliohms of random contact noise to a cell with a target resistance of one point two milliohms increases measured variance by over three hundred percent. Under a zero-acceptance protocol, that measurement noise triggers false lot rejections, stopping module assembly lines and generating costly disputes over non-existent defects.


Filter
Applying statistical process control at receiving requires converting raw metrology data into capability indices and real-time control limits. While C=0 sampling gives an immediate pass/fail filter for incoming lots, long-term SPC tracks supplier manufacturing stability across shipments. Shewhart control charts ~ specifically individual and moving range (I-MR) charts or sample average barX and standard deviation S charts ~ track each lot’s mean and dispersion.
Setting baseline control limits requires at least twenty-five consecutive historical lots to set upper and lower control limits at three standard deviations from the grand process mean.
Process capability calculation differentiates short-term capability Cpk from long-term performance Ppk. Cpk estimates process capability using pooled within-sample standard deviation hatσwithin = barS / c4, isolating intrinsic process noise from lot-to-lot baseline drift. Ppk uses total sample standard deviation soverall across all combined lots, capturing overall long-term variation including raw material lot swaps, machine wear at the cell plant, and transit environmental shifts.
The mathematical definitions follow:
Cpk = min left( fracUSL – μ3 hatσwithin, fracμ – LSL3 hatσwithin right)
Ppk = min left( fracUSL – barbarX3 soverall, fracbarbarX – LSL3 soverall right)
Where USL represents Upper Specification Limit, LSL represents Lower Specification Limit, μ represents the sample mean, and barbarX represents the grand mean. Critical parameters like AC IR, DC IR, and dimensions require a minimum Cpk threshold of one point six seven, which equates to a theoretical defect rate under zero point five seven parts per million for normal distributions.
Contractual specification agreements requiring a process capability index Cpk of one point six seven force suppliers to operate with process margins where total spread consumes under sixty percent of allowable tolerance bands.

Non Normal Parameter Distributions and Mathematical Transformations
Electrochemical measurements for open-circuit voltage and internal resistance rarely follow a normal Gaussian distribution. Open-circuit voltage in fully formed, rested cells typically shows positive skewness with a heavy tail toward lower voltages caused by trace self-discharge. Applying Gaussian equations to skewed data distorts capability calculations, overestimating capability and masking defects in the tails.
Box-Cox transformations or Weibull fits convert non-normal data into a statistically valid form before applying capability thresholds.
The Box-Cox transformation transforms non-normal parameter Y into normalized parameter W(λ) using the transformation parameter λ:
W(λ) = begincases fracYλ – 1λ · dotYλ – 1 & if λ ≠ 0 \ dotY ln(Y) & if λ = 0 endcases
Where dotY represents the geometric mean of the observations. Automated SPC software tests λ values between negative two and positive two, choosing the value that minimizes the Anderson-Darling statistic against a normal distribution. Transformed control limits UCLtrans and LCLtrans are then calculated normally and converted back into original units ~ millivolts or milliohms ~ for enforcement on the receiving dock.
Can Non Normal Voltage Distributions Pass Control Limits?
Raw non-normal open-circuit voltage distributions cannot be evaluated against standard control limits without explicit non-parametric analysis or mathematical normalization. When self-discharge creates a long tail toward lower voltages, the sample standard deviation inflates artificially. This widens the three-sigma control limits, allowing out-of-control outliers to hide inside false control boundaries.
To prevent these escapes, non-normal datasets are evaluated using percentile tolerance limits or a 2-parameter Weibull probability density function. Under a Weibull fit, scale parameter η and shape parameter β define lower percentile cutoffs. Any unit falling below the zero point one percentile value of the fitted distribution is rejected automatically, even if it sits inside raw three-sigma limits.
Extreme value theory helps evaluate tail risk in incoming lots, focusing specifically on extreme low-voltage or high-resistance outliers. In large energy storage systems with thousands of series-connected cells, module performance is limited by the weakest cell in the string. A single cell with an AC internal resistance four standard deviations above the mean generates localized heat spikes during high-rate discharge, accelerating degradation in neighboring cells.
Extreme value probability plots expose outlier subpopulations that point to latent manufacturing defects ~ like welding spatter contamination or slitting burrs that partially pierce the polymer separator.
To systematically evaluate statistical lot disposition during incoming inspection, quality inspectors execute the following decision checklist:
- Sample Size Verification confirms that the drawn sample count n meets or exceeds the C=0 table requirement for the given lot size N.
- Data Normality Screening runs the Anderson-Darling test on OCV and AC IR data, triggering Box-Cox transformation if the p-value drops below zero point zero five.
- Zero-Defect Scan checks every sample parameter against absolute Upper and Lower Specification Limits, flagging any out-of-spec unit to reject the lot immediately.
- Statistical Capability Check calculates Cpk and Ppk for all distributions, sending lots with capability indices below one point six seven to engineering review.
- Western Electric Zone Rules Scan checks control charts for non-random patterns, such as eight consecutive points on one side of the mean or six points trending steadily upward.
- Outlier Isolation Index measures the distance of extreme data points from the sample median using Median Absolute Deviation metrics, rejecting lots with severe tail dispersion.
Applying Western Electric pattern rules to screening charts catches subtle process shifts at the supplier factory before they cause outright specification failures. For instance, a steady decline in average open-circuit voltage across four consecutive lots suggests changes in supplier formation resting times or degrading calibration on electrolyte fill pumps. When software flags a run rule violation, incoming inspection halts lot intake and requests root-cause investigation records from the supplier’s quality team.
Suppliers often dispute rejections by pointing out that out-of-spec values still sit within broad master datasheet limits. They argue that datasheets set the true safety boundaries and that minor baseline shifts won’t affect module life. This argument misses the point of statistical process control.
A lot that stays within broad datasheet limits while showing a shifted mean or double-peaked distribution has lost manufacturing process control. That introduces structural variability that impairs automated cell balancing and shortens pack lifespan.

Drift
Open-circuit voltage degradation in rested cells provides a direct window into internal electrochemical stability and parasitic leakage currents. After cell formation and initial aging, a healthy cell displays a predictable logarithmic voltage decay as the solid electrolyte interphase layer passivates and reaches thermodynamic equilibrium. Internal metallic impurities, copper slitting burrs, separator pinholes, or active material defects create parallel conduction paths between electrodes.
These micro-shorts accelerate self-discharge, driving voltage down faster than normal passivation kinetics.
Isolating true electrochemical self-discharge from micro-shorting leakage requires calculating the voltage decay rate, termed the K-value. The K-value quantifies voltage drop over a precise resting time interval, expressed in millivolts per day:
K = fracOCV1 – OCV2t2 – t1
Where OCV1 represents open-circuit voltage measured at time t1 following initial factory formation rest, OCV2 represents open-circuit voltage measured at incoming inspection time t2, and t2 – t1 represents total elapsed transit and holding time in days. Measuring K-values accurately mandates precise logging of timestamps recorded in factory end-of-line birth certificates alongside local incoming metrology time tags.
Temperature variations during shipping and dock storage distort raw K-value calculations. Because self-discharge kinetics follow Arrhenius temperature dependence, self-discharge accelerates rapidly at higher temperatures. The corrected value K25 normalizes drift rates to a standard reference temperature of twenty-five degrees Celsius:
K25 = Kmeasured · exp left
Where Ea represents the activation energy of the primary self-discharge parasitic reaction typically ranging between forty and sixty kilojoules per mole, R represents the universal gas constant, and Tactual represents absolute temperature in Kelvin during the holding interval. Skipping temperature correction causes false rejections in summer and risks accepting micro-shorted cells during cold winter ocean transit.
Temperature correction of cell voltage decay rate metrics using Arrhenius activation energy equations prevents false acceptance of micro-shorted units during cold-weather freight transit.
Identifying micro-shorts relies on dual-threshold statistical filters on K-value distributions. Normal lots show a tight Gaussian distribution centered around baseline passivation decay rates. Micro-shorted cells produce an extended, asymmetrical tail toward higher millivolt-per-day losses.
Screening protocols set the Upper Control Limit for K-value at the sample median plus four times the Median Absolute Deviation, which prevents outliers from distorting the baseline.
Required dwell time depends on cell chemistry and capacity. Lithium iron phosphate (LFP) cells have flat OCV curves between twenty and eighty percent state of charge, where tiny voltage changes correspond to large shifts in state of charge. Detecting micro-shorts in LFP requires resting intervals of fourteen to twenty-eight days to produce voltage drops above measurement noise floors.
High-nickel NMC chemistries have steeper OCV curves, allowing reliable K-value measurement within seven to fourteen days.
State of charge during storage directly influences self-discharge kinetics and micro-short growth. High state of charge elevates potential differences between electrodes, driving parasitic side reactions and accelerating transition metal precipitation onto separators. Standard screening protocols specify receiving and holding cells within a thirty to fifty percent state-of-charge window, minimizing passivation decay while leaving enough voltage potential to detect electronic leakage.
The fundamental electrochemistry governing micro-short progression leaves an open technical question: can high-precision delta-OCV measurement algorithms, applied over condensed 48-hour thermal dwell windows, reliably isolate sub-micron copper dendrite growth before microscopic shorts bridge separator layers under mechanical pack compression?

Clause
A zero-acceptance screening program requires legal and commercial alignment through formal Vendor Quality Agreements signed before issuing purchase orders. Contracts that lack explicit statistical terms for lot acceptance leave buyers open to disputes when rejecting substandard shipments. Vendor Quality Agreements convert technical specifications into enforceable contract terms, defining exact metrology methods, thermal dwell conditions, C=0 sampling matrices, and process capability targets (Cpk ge 1.67) required for acceptance.
When a lot fails a C=0 screen due to a single non-conforming parameter or capability shortfall, quarantine protocols lock it out of ERP inventory. The buyer issues a Notice of Lot Rejection alongside a complete incoming inspection dossier. Contracts specify response timelines ~ typically giving vendors five business days to review inspection data, request referee testing, or issue a Return Material Authorization.
Under standard zero-defect agreements, handling costs, quarantine storage fees, testing expenses, and return freight shift entirely to the supplier.
An incoming rejection dossier must contain comprehensive metrology and statistical proof to sustain commercial claims:
- Master Certificate of Analysis Cross-Check maps supplier factory birth-certificate metrics against local incoming screening readings across identical cell serial barcodes.
- Environmental Traceability Logs record environmental chamber temperature and humidity logs during the twenty-four hour thermal dwell period prior to testing.
- Calibrated Gauge R&R Audit Reports provide calibration certificates and recent Gage R&R test results proving measurement system precision below ten percent of tolerance.
- Raw Metrology Parameter Datasets document individual measured values for OCV, AC IR, DC IR, dimensions, and mass across all drawn sample units.
- Statistical Process Control Output Charts display histograms, Anderson-Darling normality calculations, fitted capability charts (Cpk/Ppk), and control boundary lines highlighting out-of-spec or non-controlled distributions.
Referee testing resolves technical disputes when vendor data contradicts incoming inspection results. Quality agreements name an independent, ISO/IEC 17025 accredited electrochemical laboratory agreed upon by both parties. The referee lab receives quarantined sample units in sealed, tamper-evident containers and tests them on equivalent, calibrated equipment.
Their physical measurements serve as binding arbitration, deciding whether the lot is returned to the supplier or conditionally released.
Standard Vendor Quality Agreements establish that referee laboratory metrology findings obtained under ISO 17025 accredited procedures serve as commercially binding lot disposition evidence.
Sorting allowances offer a commercial compromise when rejecting an entire shipment would shut down an assembly line. Under a concession agreement, the buyer performs a one-hundred-percent automated screen of the quarantined lot on buyer test stations. The vendor pays an agreed hourly labor rate and machine fee for the run, taking back all non-conforming units while conforming units are released into production inventory.
Sorting concessions require formal sign-off from the buyer’s head of quality engineering to prevent marginal lots from slipping through.
Formal lot rejections require mandatory corrective action using the Eight Disciplines (8D) framework. The vendor must submit an interim containment plan within twenty-four hours of receiving a rejection notice, followed by a full 8D report covering root causes, permanent corrective actions, and verification within thirty calendar days. Failing to deliver a verified 8D report revokes Approved Supplier Status, freezing open purchase orders and triggering commercial indemnity clauses.
A representative zero-defect compliance clause in a high-volume cell supply agreement states: “The seller warrants that all delivered battery cells strictly conform to master engineering specifications and exhibit a statistical process capability index Cpk equal to or exceeding one point six seven for critical parameters including open-circuit voltage and internal resistance. Delivery of a lot containing one or more non-conforming units under the designated C=0 sampling plan entitles the buyer to immediate lot rejection, full credit adjustment, and recovery of all quarantine storage, testing, and return logistics expenses incurred.”
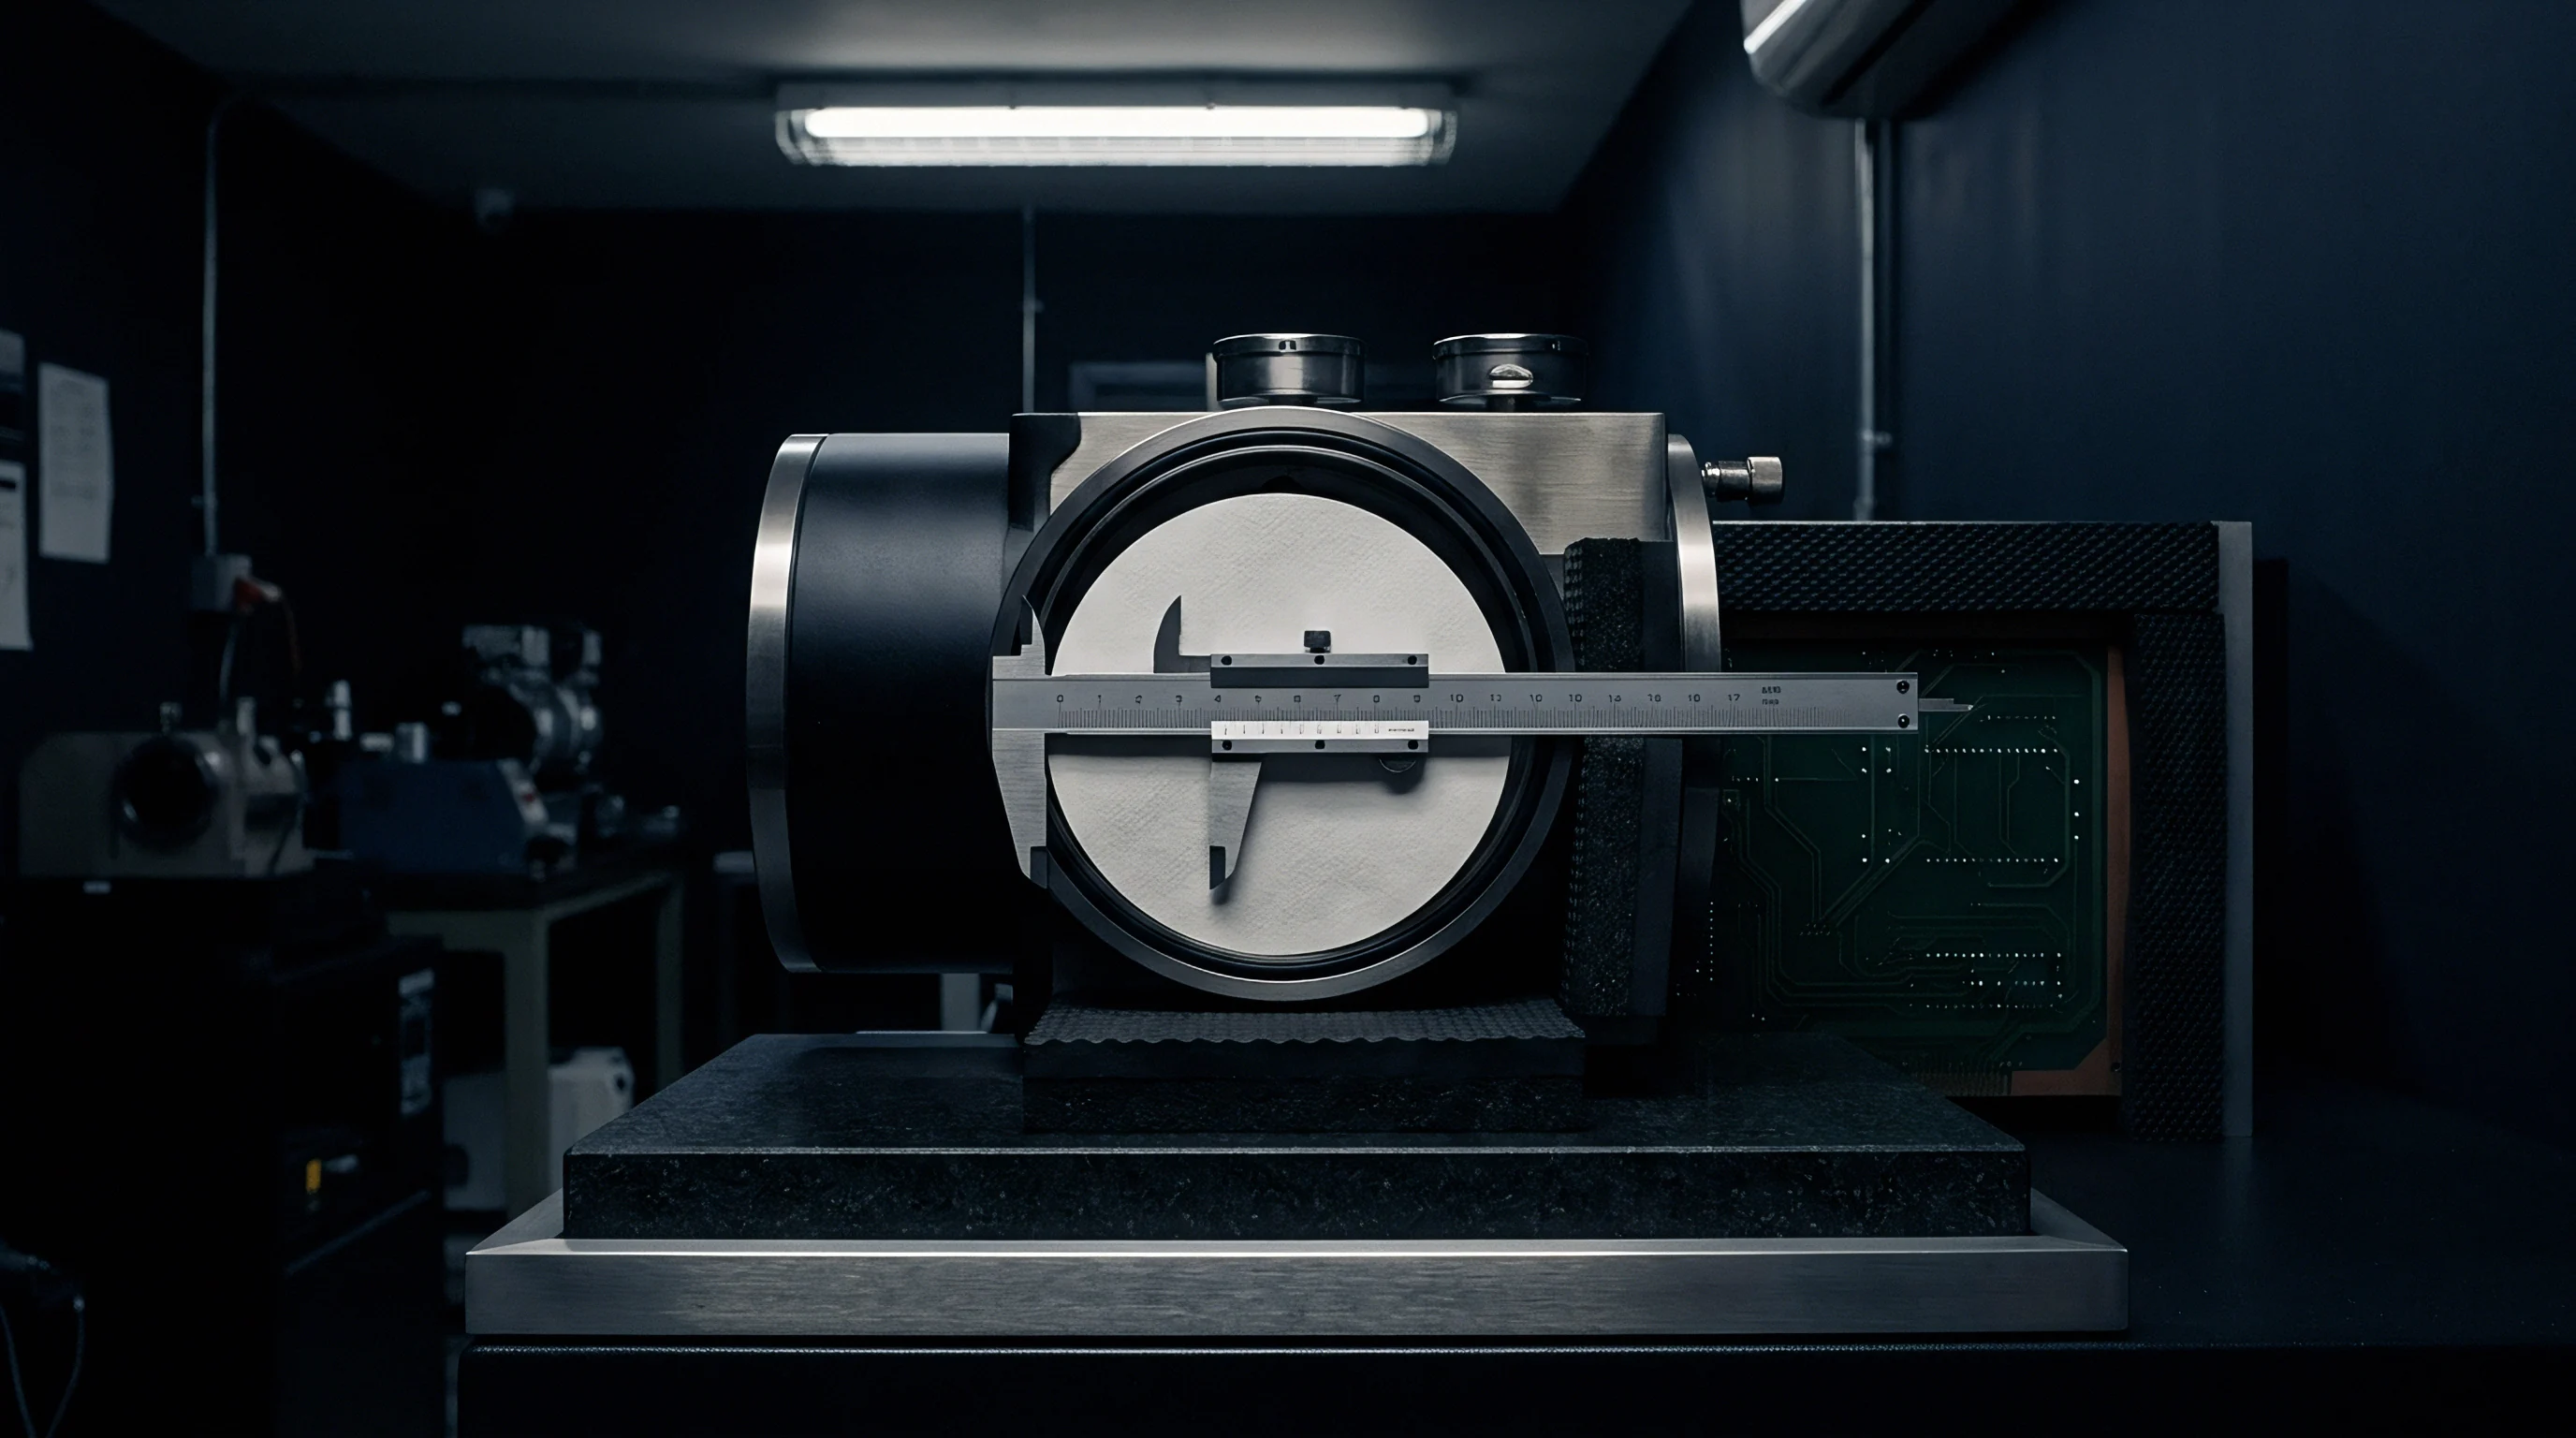
Landed
Deploying SPC and C=0 screening requires balancing capital investment against the operational cost of defect escapes. Defective cells that bypass incoming inspection enter module welding lines, where finding a high-resistance or swollen cell during pack teardown causes severe rework penalties. Worse, an escaping micro-shorted cell can survive pack assembly and reach the field, triggering recalls or safety liabilities that dwarf the cost of setting up a screening line.
The total cost of quality model breaks expenses into four categories: prevention, appraisal, internal failure, and external failure. Capital spent on automated four-wire Kelvin test stations, optical thickness scanners, environmental dwell chambers, and real-time SPC software falls under appraisal costs. The financial justification for incoming screening comes from shifting chaotic external failure costs (recalls, warranty claims, liability) and internal failure costs (line stoppages, scrap, teardowns) into predictable appraisal expenses.
| Production Volume Band (Packs/Year) | Screening NRE Capital Investment | Appraisal Cost per Cell | Estimated Defect Escape Rate (No SPC) | Projected Annual Escape Failure Cost | Net Annual Cost Savings (with SPC) |
|---|---|---|---|---|---|
| 1,000 (Low Volume) | $45,000 | $0.42 | 500 PPM | $125,000 | $75,200 |
| 10,000 (Mid Volume) | $120,000 | $0.18 | 350 PPM | $875,000 | $701,000 |
| 50,000 (High Volume) | $350,000 | $0.08 | 200 PPM | $2,500,000 | $2,030,000 |
| 200,000 (Mass Production) | $850,000 | $0.04 | 150 PPM | $7,500,000 | $6,410,000 |
Economic sensitivity equations calculate the net financial benefit Bnet of incoming zero acceptance screening by analyzing defect escape probabilities and downstream impact costs:
Bnet = Ncells · Pdefect · left( Cexternal · γ + Cinternal · (1 – γ) right) – left( CNREamortized + Ncells · Ctestingunit right)
Where Ncells represents total annual cell consumption, Pdefect represents supplier baseline defect fraction, Cexternal represents average cost of a field defect escape, Cinternal represents average cost of an internal module rework, γ represents the proportion of escaping defects that reach field deployment, CNREamortized represents annual equipment depreciation, and Ctestingunit represents direct labor and energy cost per screened sample unit.
High-volume module lines with fast takt times cannot rely on manual sampling. Automated metrology stations ~ equipped with robotic tray handling, barcode readers, optical vision, and four-wire Kelvin probe arrays ~ cost between two hundred thousand and eight hundred thousand dollars depending on throughput. Amortizing that capital investment across three million cells per year drops appraisal costs below ten cents per cell, while protecting against multi-million dollar field recalls.
The total landed quality equation calculates true financial impact per accepted unit by adding inspection overhead, quarantine holding capital costs, and scrap allocation fees to the base FOB cell purchase price:
Clandedquality = fracCFOB + Cfreight + Cappraisal + (thold · icaπtal · CFOB)1 – Ylotyield
Where CFOB represents freight-on-board cell price, Cfreight represents unit shipping cost, Cappraisal represents per-unit incoming inspection cost, thold represents quarantine storage time in years, icaπtal represents corporate annual cost of capital rate, and Ylotyield represents historical lot acceptance yield fraction. Factoring these in shows that buying cheaper cells from suppliers with poor Cpk stability inflates overall landed quality costs through frequent lot rejections, extended quarantine holds, and assembly line downtime.
A purchasing team that picks a cell supplier based strictly on low FOB price makes a costly accounting mistake if the vendor’s Cpk hovers near one point zero. A Cpk of one point zero produces a baseline defect rate around twenty-seven hundred parts per million. Under a C=0 plan sampling five hundred units, the chance of finding at least one defective cell in an incoming lot reaches nearly seventy-four percent.
The constant cycle of lot rejections, quarantine handling, and commercial disputes pushes the true landed cost per accepted cell far higher than quotes from suppliers operating at Cpk levels above one point six seven.