Evaluating Battery Module Structural Integrity under UN 38.3 Vibration Parameters
UN 38.3 T.3 vibration testing validates battery module integrity by applying 7 to 200 Hz sinusoidal sweeps to detect structural and interconnect failures.

Profile
Section 38.3.4.3 of the United Nations Manual of Tests and Criteria defines the mechanical excitation required for lithium-ion battery transport approval. The procedure runs a logarithmic sinusoidal sweep from 7 Hz to 200 Hz, repeated 12 times across three mutually perpendicular axes. Each 15-minute sweep subjects the module to dynamic displacement and acceleration that mirror transport conditions aboard cargo vessels, railcars, and heavy trucks.
The test profile shifts at a twelve-kilogram mass threshold. Modules with a gross mass up to 12 kg encounter a constant peak acceleration of 1 g from 7 Hz to 18 Hz, where peak displacement caps at 0.8 mm. Beyond 18 Hz up to 200 Hz, acceleration ramps to a constant 8 g peak.
Modules over 12 kg follow a milder profile that caps peak excitation at 2 g between 18 Hz and 200 Hz while retaining the 0.8 mm displacement limit at lower frequencies, reflecting the higher structural inertia of heavy industrial packs.

Frequency Sweeps and Mass Threshold Mechanics
Sweeping logarithmically through these frequencies excites structural modes in the chassis over 3 hours per axis, totaling 9 hours of dynamic vibration exposure. To pass the T.3 test, a module must show no mass loss, leakage, venting, disassembly, rupture, or fire during or after testing. Electrical continuity is also mandatory: post-test open-circuit voltage must not drop below 90 percent of its pre-test baseline.
| Standard Designation | Mass Regime | Frequency Band | Waveform Type | Peak Acceleration / PSD |
|---|---|---|---|---|
| UN 38.3.4.3 T.3 Small | Up to 12 kg | 7 Hz to 200 Hz | Sinusoidal Log Sweep | 8 g peak (above 18 Hz) |
| UN 38.3.4.3 T.3 Large | Greater than 12 kg | 7 Hz to 200 Hz | Sinusoidal Log Sweep | 2 g peak (above 18 Hz) |
| ISO 16750-3 Commercial | Engine / Chassis | 10 Hz to 2000 Hz | Random Vibration | 0.05 g²/Hz to 0.1 g²/Hz PSD |
| UN ECE R100 Annex 8A | Vehicle Traction Pack | 7 Hz to 50 Hz | Sinusoidal Log Sweep | 1 g to 4.8 g peak |
Harmonic Loading versus Random Vibration Spectrum
While operational vehicle standards rely on broad-spectrum random vibration profiles, UN 38.3 sinusoidal testing isolates discrete structural resonances. Sweeping through individual frequencies forces every internal component through its specific natural response point. If a busbar, cell retaining clip, or wire bond has a natural frequency between 7 Hz and 200 Hz, continuous sinusoidal excitation concentrates cumulative fatigue damage directly at that mode.
Under Section 38.3.4.3.2 of the UN Manual of Tests and Criteria, modules over twelve kilograms drop to a 2 g peak acceleration ceiling, substantially altering the resulting structural stress calculations.

Rib
Structural housing elements inside a battery assembly keep cell stacks under uniform compression during dynamic loading. End plates, side extrusions, and internal stiffeners absorb kinetic energy from the shaker table. Without enough flexural rigidity, the frame transfers peak acceleration forces straight into individual cell casings and internal electrical interconnects.
Frames built from extruded 6061-T6 aluminum or stamped high-strength steel offer the baseline stiffness needed to push structural natural frequencies past 200 Hz. If the primary bending mode of the chassis stays above 200 Hz, the assembly behaves as a rigid body during UN 38.3 T.3 testing, avoiding internal harmonic magnification. Meanwhile, structural adhesives applied between pouch or prismatic cells add viscoelastic damping that lowers the quality factor of internal resonance peaks.
Module natural frequencies designed above the excitation ceiling eliminate harmonic amplification during transport certification.

Stiffness Optimization in Module Housing Structures
Clamping mechanisms must accommodate cell expansion while maintaining structural restraint. Because prismatic cells swell during charge cycles, side plates and tie rods need sufficient static pre-stress to prevent gapping, even while enduring dynamic shear forces during an 8 g sweep. If side plates lack stiffness, transverse cell oscillation can degrade thermal interface material bonds and shear lower cooling plate seals.
Transmissibility Peaks and Damping Dynamics
Transmissibility describes the ratio of response acceleration at an internal component relative to input acceleration at the shaker fixture. A rigid frame keeps this ratio near unity at lower frequencies. When internal components have little mechanical damping, transmissibility factors at resonance regularly exceed five, transforming an 8 g shaker input into a localized 40 g dynamic load on busbar joints.
Matching damping layers to chassis stiffness prevents structural isolation failures across swept frequency bands.

Joints
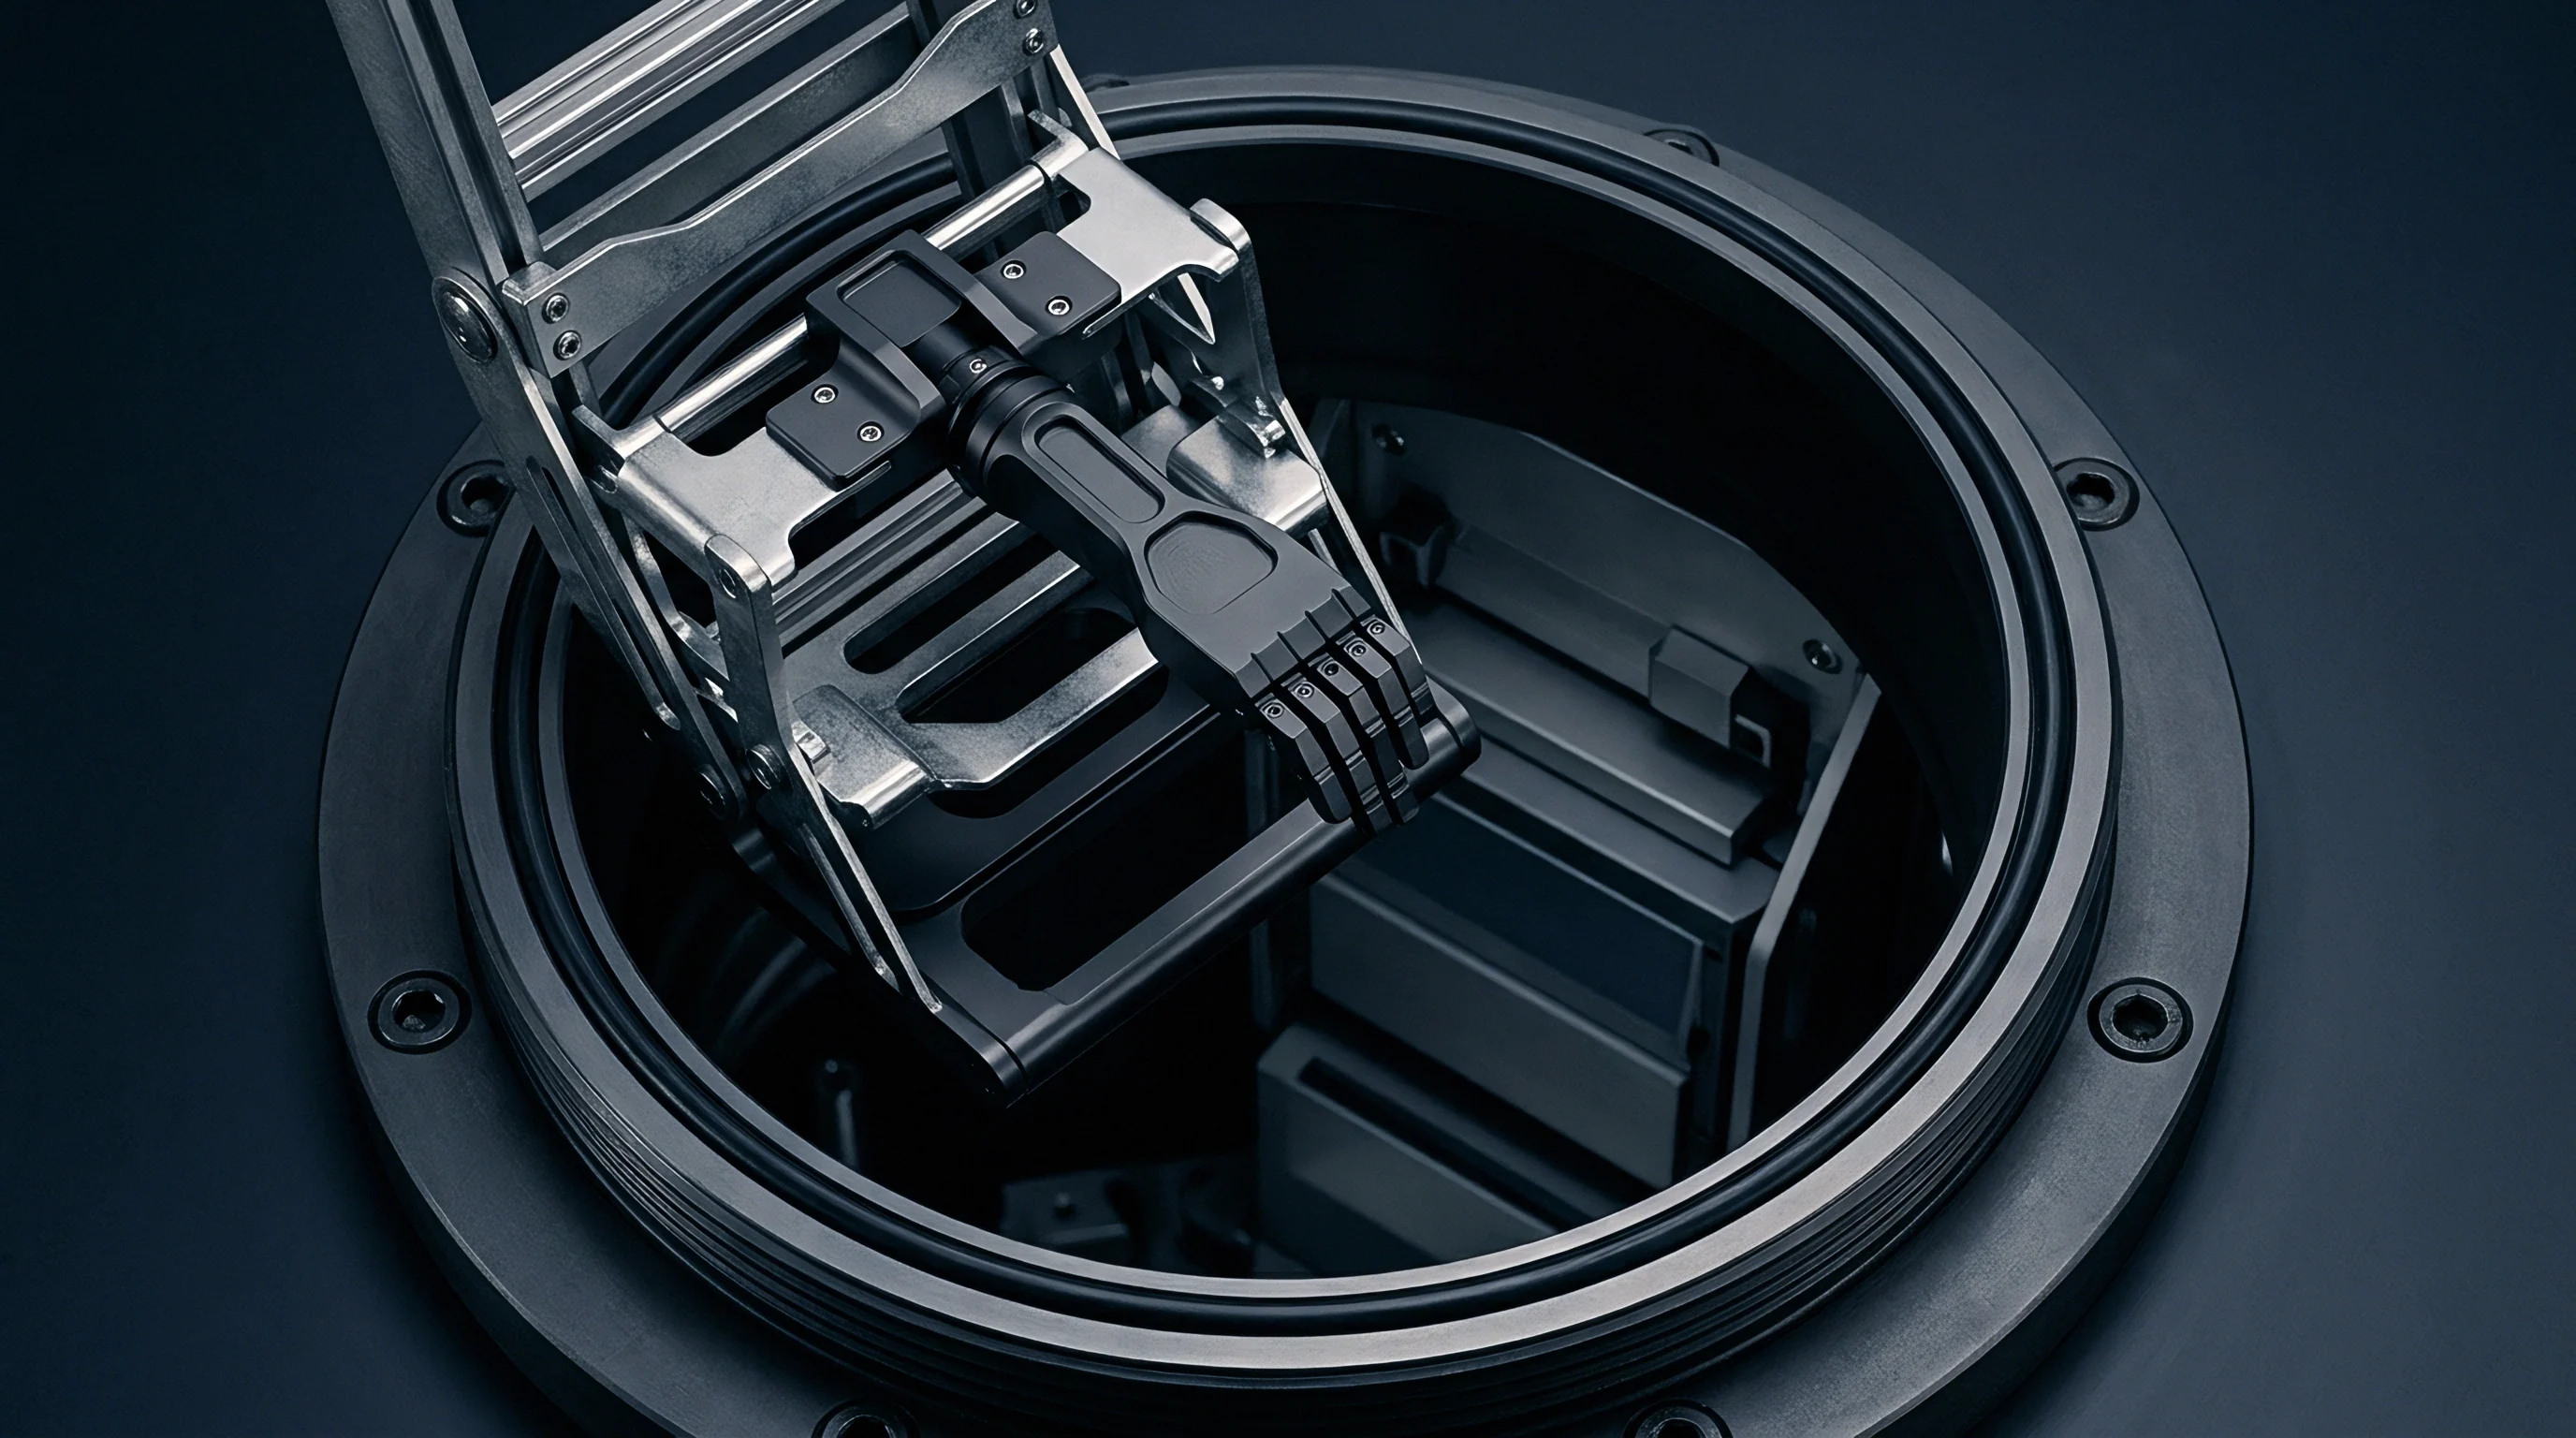
Harmonic forces on cell terminals subject internal electrical interconnects ~ including ultrasonic aluminum wire bonds, laser-welded copper busbars, and flexible printed circuits ~ to severe cyclic shear strain. Differential motion between adjacent cells concentrates mechanical fatigue at weld roots and heel zones.

Mechanical Fatigue in Laser Welded Busbars
Laser welds joining copper or aluminum busbars to cell terminals endure multi-axial fatigue loading during vibration sweeps. Rigid busbars without flexural relief loops transfer relative displacements directly into the weld interface. Micro-cracking typically begins at weld boundaries where heat-affected zones alter the base metal’s grain structure, reducing fatigue resistance under cyclic bending moments and raising electrical resistance.

Which Structural Weld Profiles Resist Fatigue Failure?
Overlap laser welds with stress-relief slots or S-bend flexures absorb differential cell motion without exceeding yield strength limits. Under transverse shear loading, continuous linear welds create lower stress concentrations than spot welds, whereas porosity and incomplete penetration serve as primary crack initiation sites during high-frequency sweeps.
| Interconnect Type | Dominant Load Vector | Failure Mechanism | Diagnostic Indicator |
|---|---|---|---|
| Laser Welded Copper Busbar | Transverse Shear | Weld root fatigue cracking | Milliohm resistance creep |
| Ultrasonic Aluminum Wire Bond | Axial Flexure | Heel fracture at wedge terminal | Instantaneous open circuit drop |
| Bolted Mechanical Lug | Rotational Torque | Thread loosening under vibration | Terminal voltage noise and heating |
| Flexible Printed Circuit | Out-of-Plane Bending | Copper trace fatigue cracking | Intermittent signal loss |
- Laser Weld Root Shearing occurs when differential cell movement forces tab flexure beyond yield limits.
- Ultrasonic Heel Cracking develops near wire bond wedge terminations under high-frequency flexural harmonics.
- Threaded Fastener Back-Off emerges when cyclic axial vibration overcomes bolt clamp friction without mechanical locking features.
- Adhesive Interface Debonding separates structural potting compounds from cell casings, concentrating structural loads directly onto busbars.
Undetected fatigue micro-cracks from transport testing create resistive hotspots that can trigger premature thermal events once deployed in the field.


Telemetry
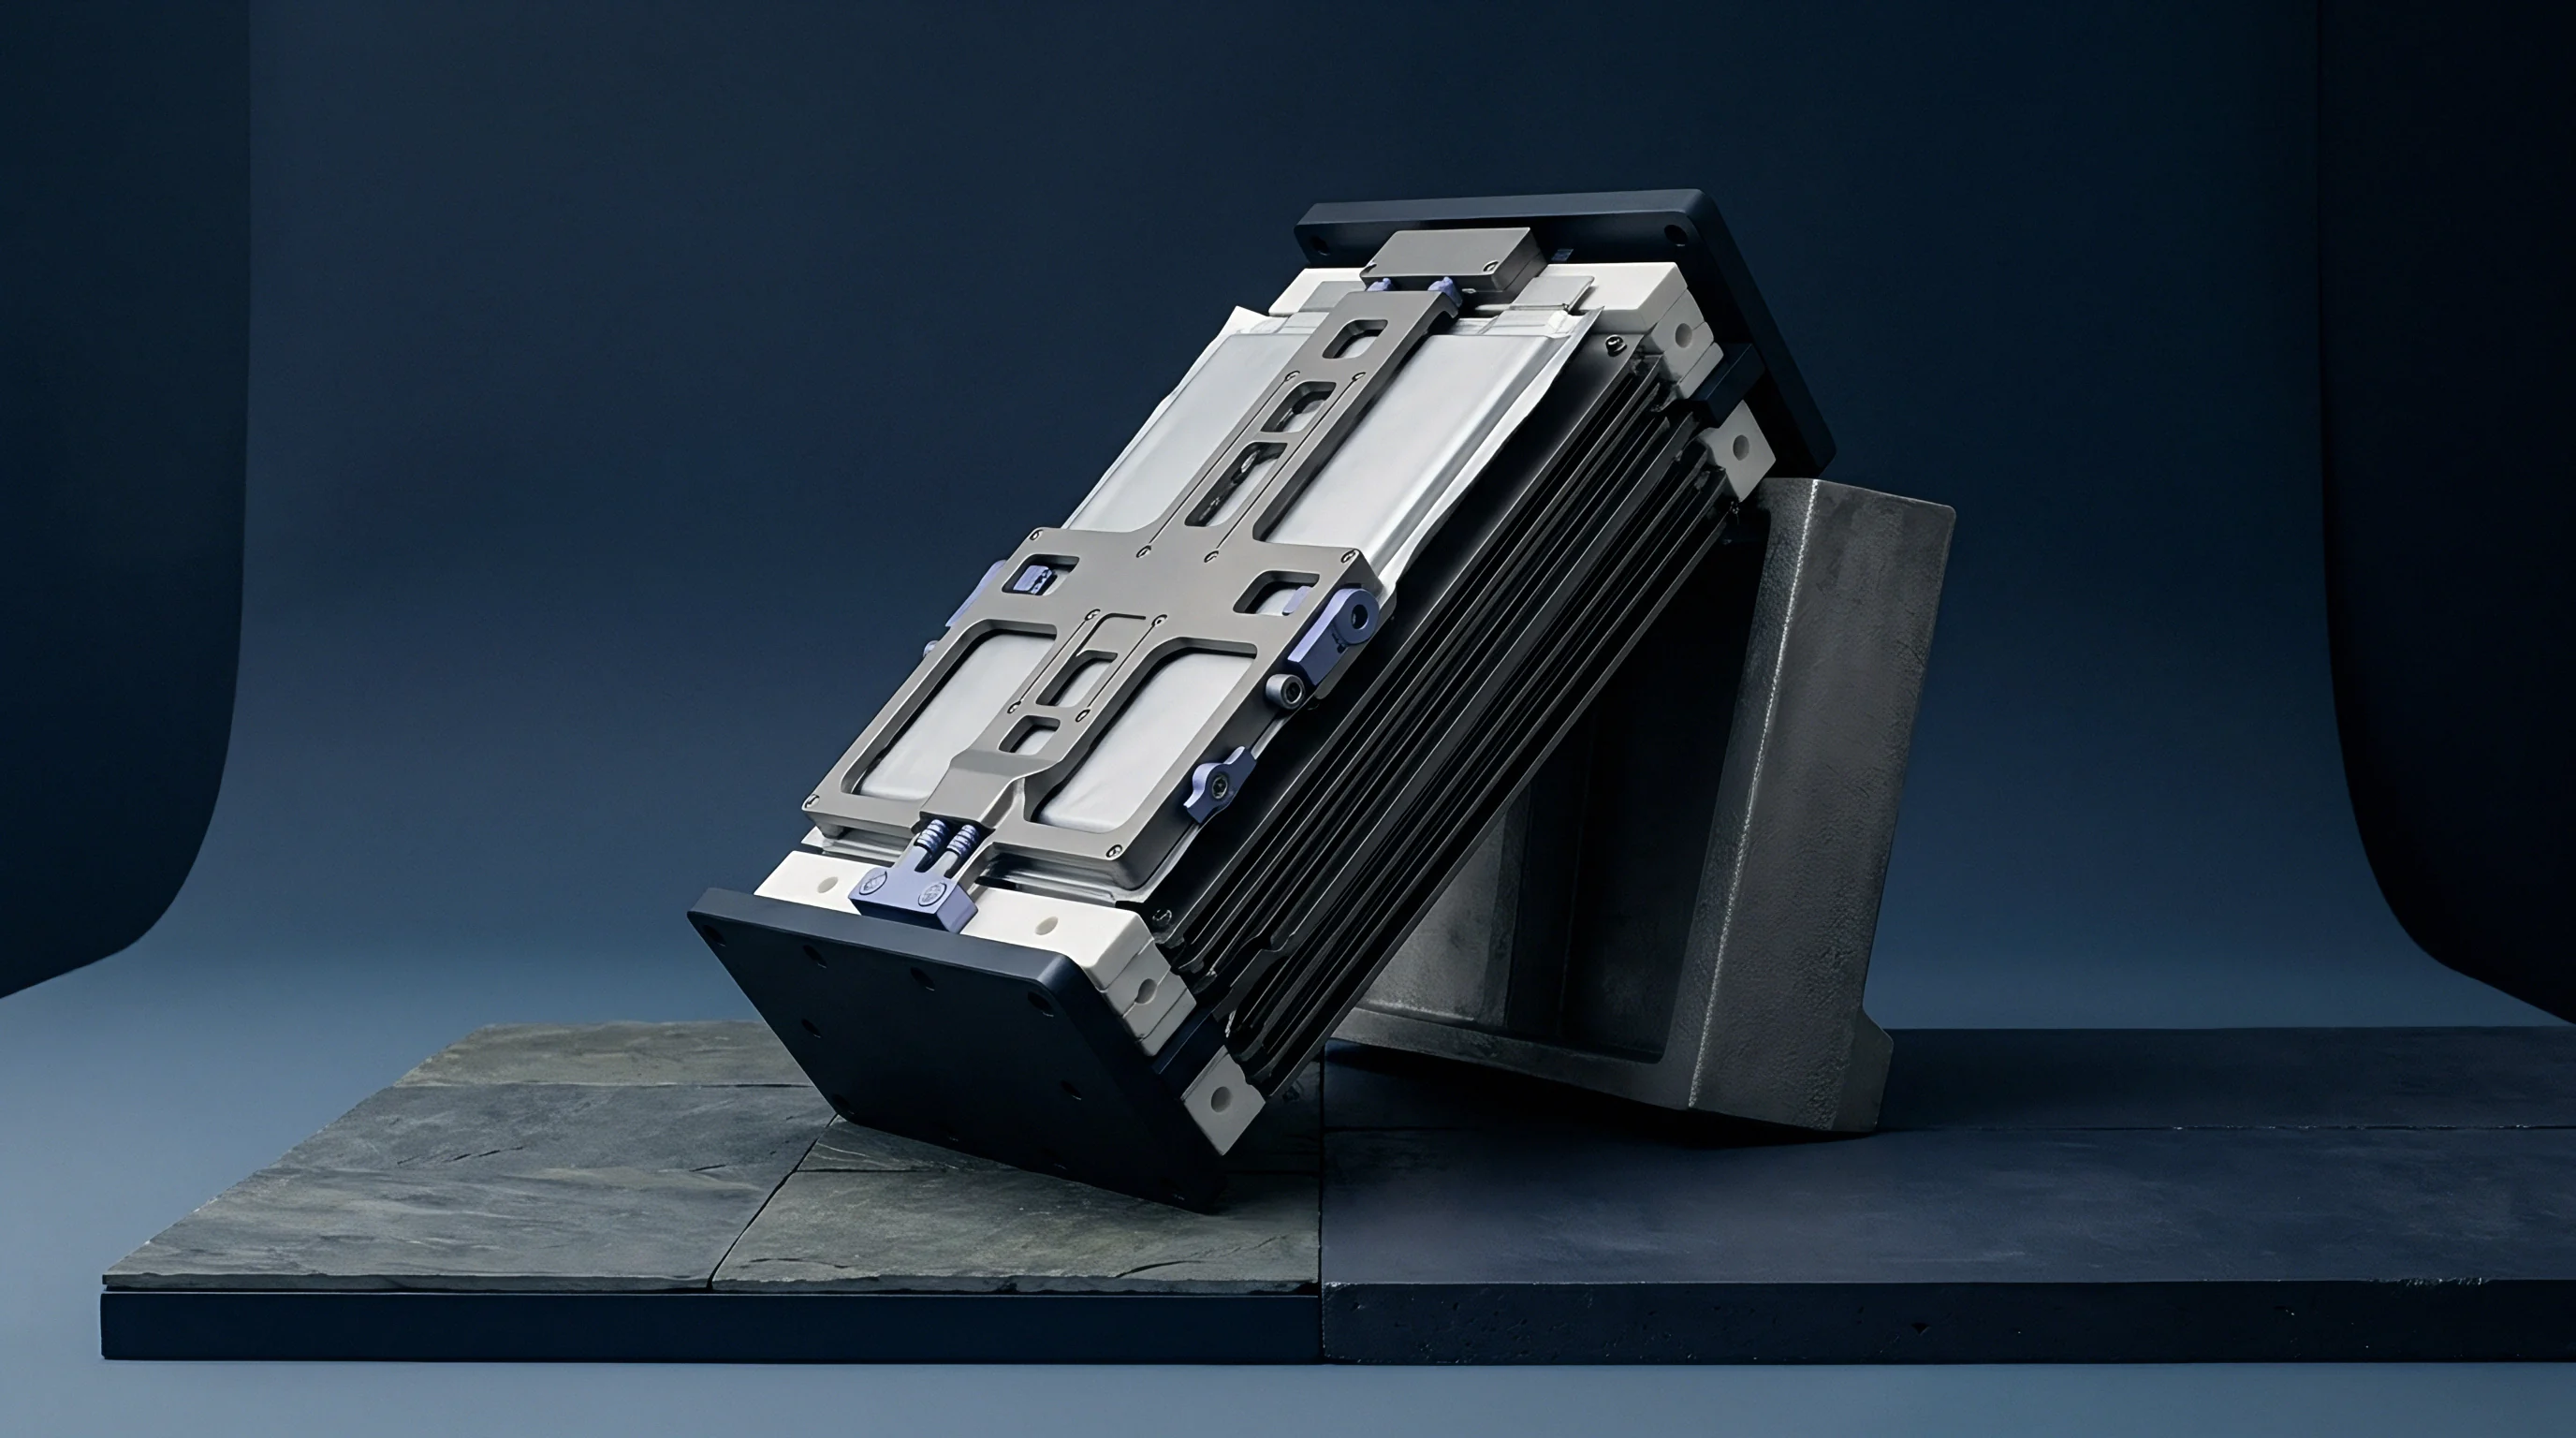
Instrumenting test specimens with tri-axial accelerometers and strain gauge arrays exposes internal structural amplification during shaker runs. Sensors placed on module end plates, center cell bridges, and main busbars log real-time responses to map structural nodes and anti-nodes across the 7 Hz to 200 Hz range.
High-speed, multi-channel data acquisition systems capture instantaneous voltage fluctuations across module terminals during sweeps. A transient voltage drop lasting less than one microsecond points to physical contact loss or micro-cracking in electrical interconnects ~ qualifying as a test failure even if post-test open-circuit voltage checks out normal.
A transmissibility factor exceeding four at twenty hertz indicates severe internal resonance within module end plates.

Accelerometer Placement across Critical Load Paths
Strategic sensor mapping separates structural deflection modes from rigid chassis motion. Mounting lightweight miniature accelerometers along the centerline of flexible busbars exposes out-of-plane flapping modes that finite element models often under-predict. Sensor mass must remain negligible relative to the component being measured to avoid shifting its resonant frequency.

Strain Gauge Monitoring during Sweep Cycles
Biaxial strain gauge rosettes bonded to high-stress joints track dynamic strain fields in real time. Converting this data to equivalent von Mises stress reveals local fatigue consumption over the 9-hour UN 38.3 test. Dynamic stresses exceeding 60 percent of material yield strength during harmonic resonance represent an unacceptable fatigue risk.
- Attach tri-axial accelerometers to the geometric center of the module housing and directly onto the central busbar bridge.
- Calibrate continuous open-circuit voltage acquisition channels to detect instantaneous microsecond electrical disconnections during shaker table sweeps.
- Execute a baseline low-amplitude sine sweep at 0.5 g to map initial resonant frequencies before applying full T.3 acceleration limits.
- Record structural response data across all three orthogonal axes while inspecting post-test specimens for physical deformation or electrolyte leakage.
Stable post-test voltage readings do not guarantee mechanical integrity when unmonitored internal busbars develop fatigue micro-cracks.

Variance
Finite element models frequently underestimate physical deflection because idealized boundary conditions ignore manufacturing tolerances. Discrepancies between simulated resonant frequencies and actual shaker observations typically stem from non-linear material behavior, uneven adhesive thickness, and joint compliance in fasteners.
Fresh cells tested at low state-of-charge exhibit different internal mechanical damping than aged cells with internal gas build-up and compressed separators. Models that treat cells as rigid monolithic blocks miss internal jelly-roll motion, which acts as a secondary mass-spring system inside the canister.
Clause 38.3.4.3 of the UN Manual invalidates test summaries when structural module geometry differs from the tested specimen.

Finite Element Boundary Conditions versus Shaker Realities
Accurately simulating module vibration requires realistic structural contact definitions. Fixed boundary conditions at mounting bolt locations overestimate stiffness if fixture flexure is ignored. Factoring measured shaker table compliance into the boundary conditions brings simulated natural frequencies within 5 percent of physical bench measurements.

Pre-Stress Influence on Module Resonances
Assembly pre-stress alters overall chassis natural frequencies. On a 48V, 18.5 kg industrial module housed in a 6061-T6 aluminum frame, static bolt torque exerts an axial clamping force of 4.5 kN per tie rod. Under a 2 g sweep from 18 Hz to 200 Hz, an unstressed model predicts primary bending resonance at 112 Hz. Accounting for 30 kPa of internal cell swelling pressure alongside bolt pre-stress shifts that physical resonance to 134 Hz, driving local stress at corner mounting points from 42 MPa up to 78 MPa.
Debate continues over whether regulatory revisions will eventually swap fixed sinusoidal sweeps for multi-axis random vibration profiles without invalidating existing compliance dossiers.

Clearance
Dangerous goods desks require verified compliance documentation before accepting international freight shipments. Every commercial battery module shipped under UN 3480 classification must trace back to a valid UN 38.3 test summary created under sub-section 38.3.5. Freight forwarders reject cargo when module serial numbers fail to match certified design records.
Physical damage or mass loss sustained during transport testing invalidates the safety file, blocking clearance for sea and air transport. Responsibility for compliance verification rests entirely with the shipper of record, making incoming lot checks and drawing audits essential risk controls for integrators.

Verification Files for Transport Acceptance
Dangerous goods regulations prescribe specific fields for the standardized UN 38.3 test summary. Documents must list laboratory credentials, test report reference numbers, battery mass, cell configuration, and explicit confirmation of passing tests T.1 through T.8. Omitting mechanical vibration logs gives port authorities grounds to impound containers at entry points.

Commercial Liability for Latent Vibration Damage
Vibration damage during transport often shows up as latent field defects rather than immediate catastrophic failures. Micro-cracking in internal wire bonds leads to localized resistive heating, thermal imbalance, and early pack degradation in service. Supply contracts need clear boundary conditions assigning liability for structural failures caused by gaps in transport vibration standards.
| Dossier Item | Required Content | Verification Method | Acceptance Criterion |
|---|---|---|---|
| UN 38.3.5 Test Summary | Manufacturer details, lab ISO 17025 accreditation, report IDs | Documentary audit | Complete 10-point standard format matching pack model |
| Vibration Test Profile | Frequency logs, 7-200 Hz sweep axis records, mass band confirmation | Raw test log cross-check | Confirmed 9-hour total sweep duration per T.3 parameters |
| Post-Test Mass Audit | Pre-test vs post-test mass measurement logs | Gravimetric analysis | Mass loss less than 0.1% for units over 75 grams |
| Electrical Integrity Log | Pre-test vs post-test open-circuit voltage records | Precision DMM log audit | Post-test OCV greater than 90% of initial baseline |
| Note: Verification documentation must remain retrievable for the full commercial lifetime of the certified module architecture. | |||
- Test Summary Validation requires cross-referencing module part numbers and mass specifications against signed laboratory report credentials.
- Structural Change Auditing identifies physical alterations in busbar thickness, casing alloys, or adhesive formulations that demand re-testing under regulatory rules.
- Transit Damage Indemnification assigns financial responsibility for latent mechanical degradation occurring between factory gate release and customer receipt.
- Batch Conformity Verification evaluates incoming production lots against original type-tested structural baseline specimens.
A complete compliance dossier ~ containing verified mechanical test logs, laboratory accreditation credentials, and structural drawings ~ protects cell buyers against transit delays and downstream product liability claims.