Evaluating Lithium Plating Risks in Fast Charging Anodes
Fast charging requires negative electrode potential monitoring above zero volts against lithium reference to prevent cell degradation and thermal risks.


Voltage
Thermodynamic equilibrium at the negative electrode determines whether incoming ions enter the host structure or deposit as film. During low-rate charging, the potential of a graphite electrode stays positive relative to a metallic lithium reference electrode, stabilizing around 85 millivolts at full lithiation. As charging currents increase, activation overpotential, ohmic resistance, and concentration gradients combine to drop the local electrode potential.
Once this potential falls below zero volts against the lithium reference, metallic lithium deposition becomes thermodynamically favorable over intercalation into the graphite lattice. Ultimately, the competition between lithium intercalation kinetics and metal deposition governs cell health under high-rate charging.
Mass transport limitations within the electrolyte phase drive local concentration polarization at high charging rates. As lithium ions deplete at the graphite surface faster than liquid-phase diffusion can replenish them, the concentration gradient steepens across the boundary layer. This localized depletion drops the equilibrium potential further into negative values, accelerating metallic nucleation.
Plating onset does not require the entire anode potential to fall below zero volts; micro-scale variations in current density create localized sub-zero potential pockets across the electrode surface long before bulk measurements show negative values.
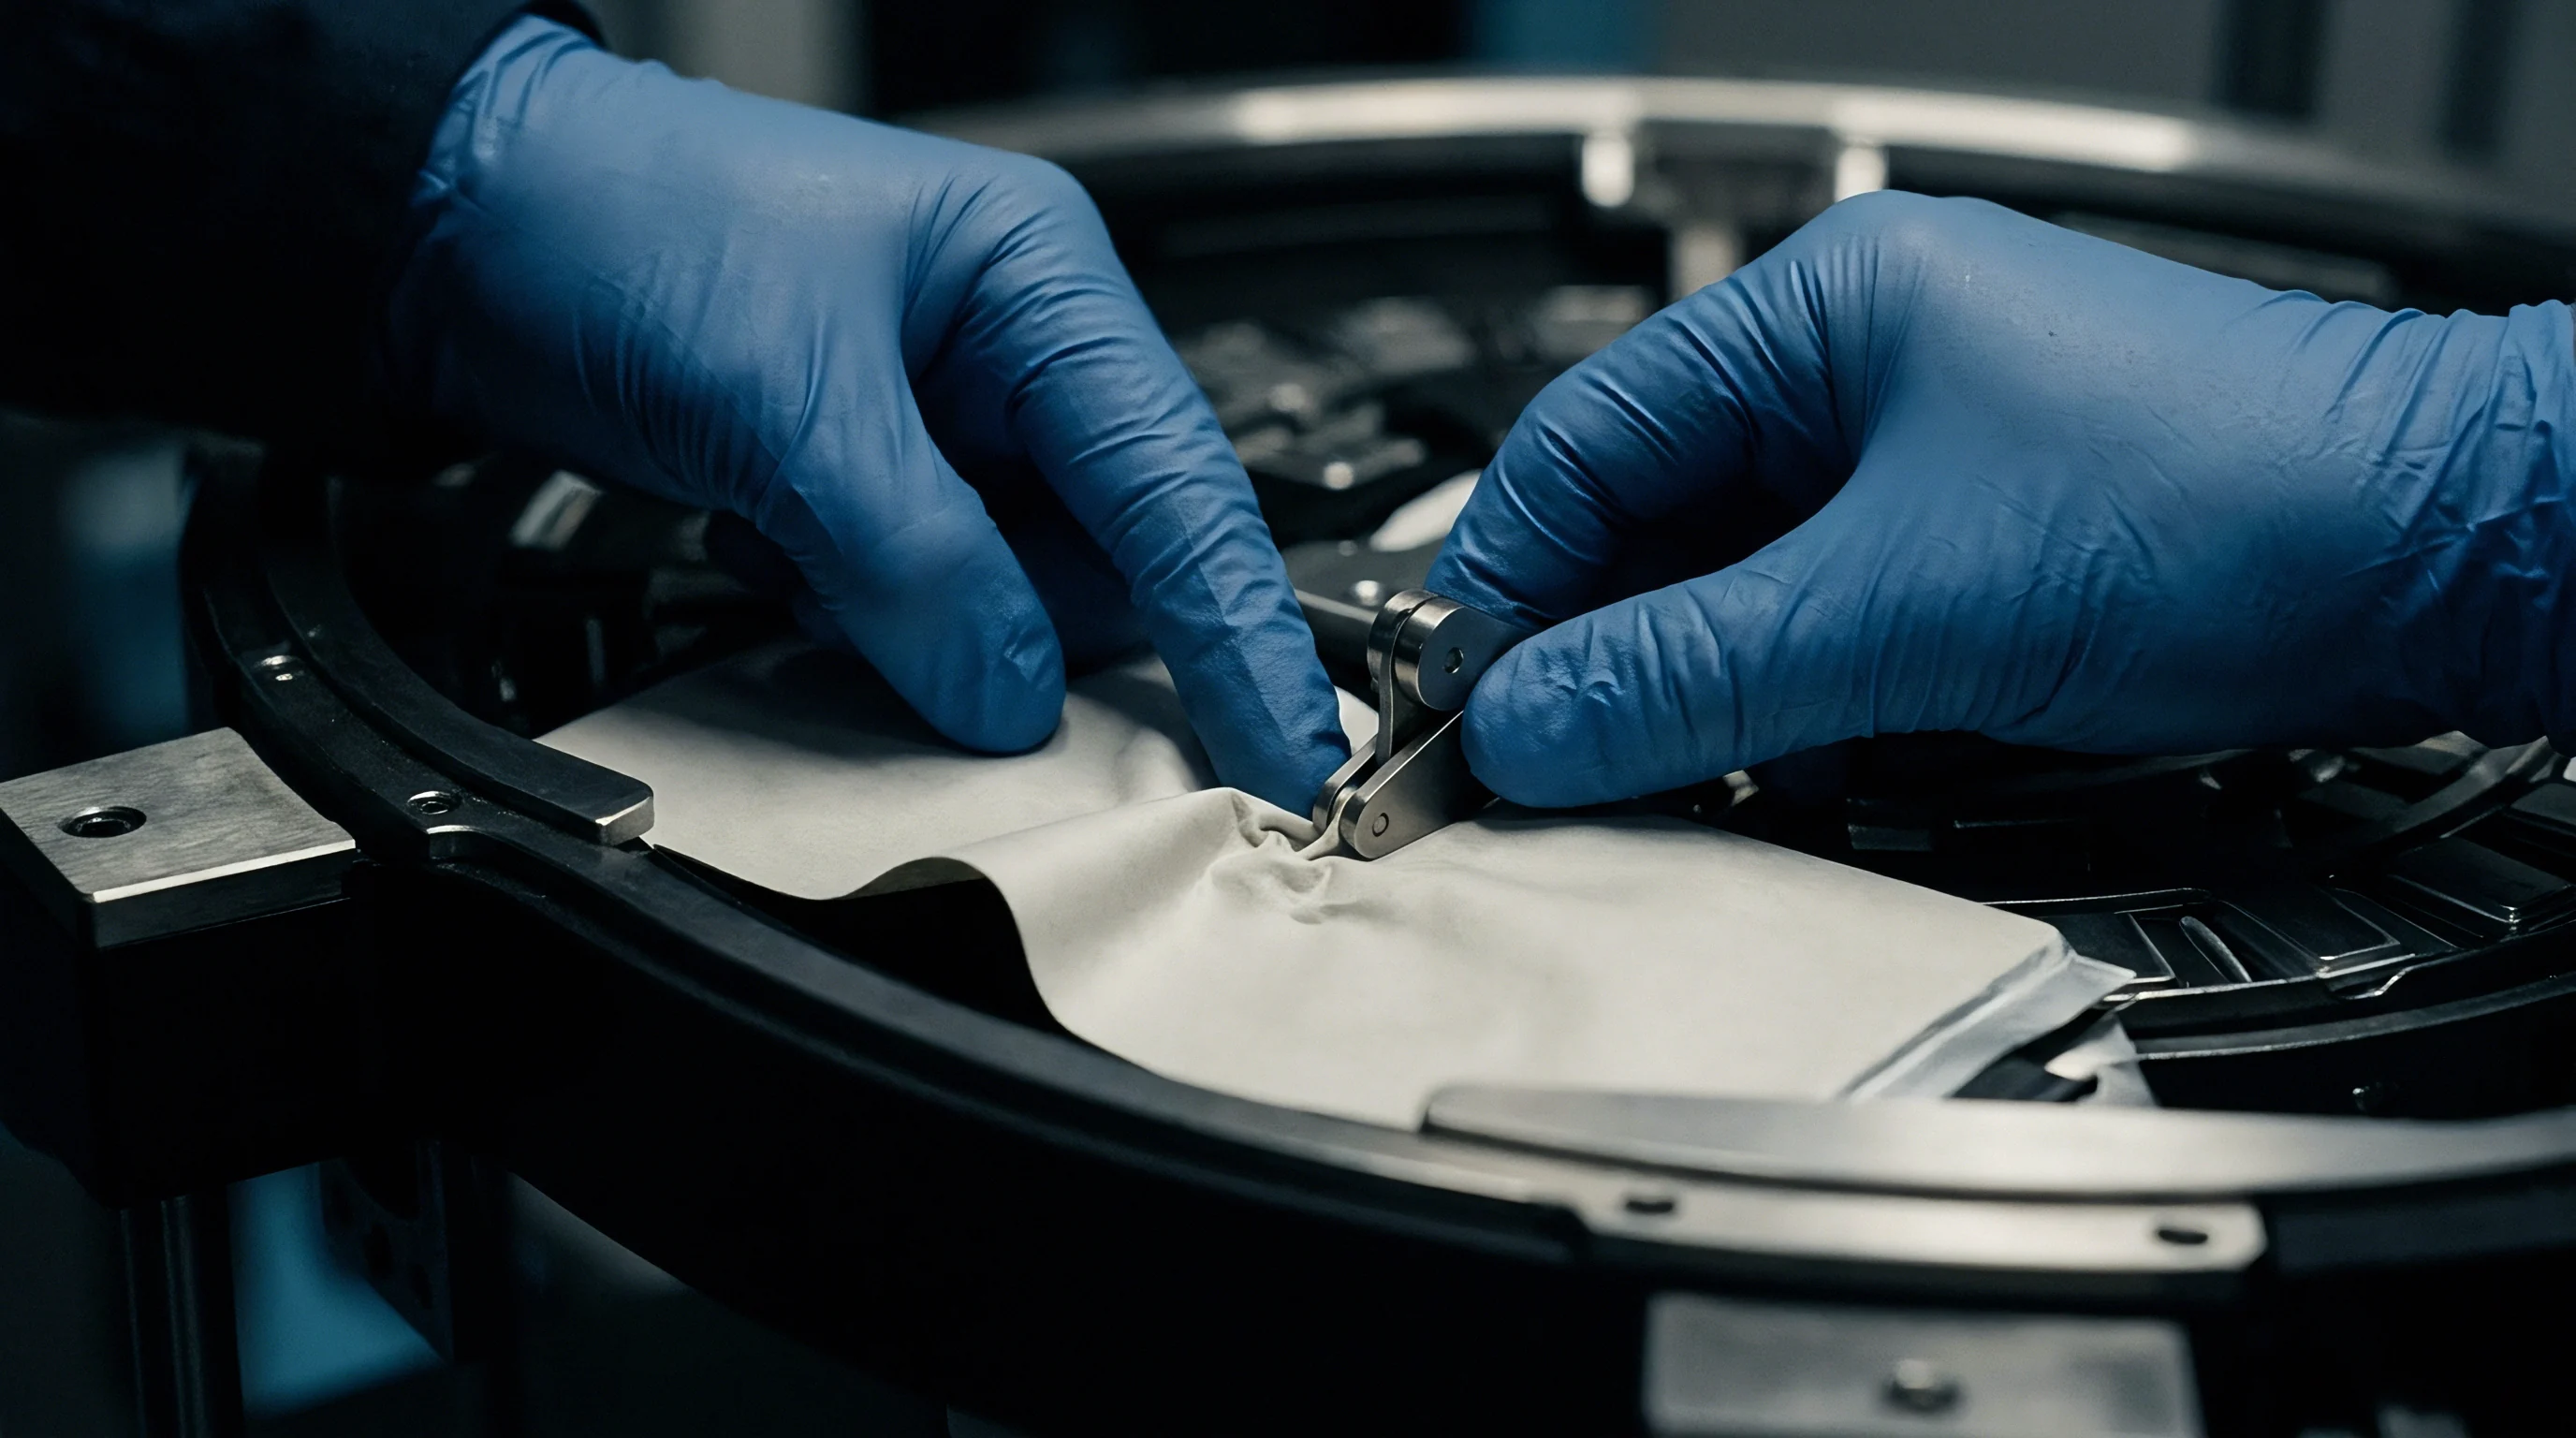
Thermodynamic Principles of Lithium Intercalation
Injecting current shifts the electrical potential of the graphite host relative to the reference ion equilibrium. Intercalation proceeds through distinct structural phases, moving from stage four down to stage one as lithium concentration approaches maximum stoichiometric capacity. Stage one lithiation occurs at roughly 85 millivolts under equilibrium conditions at 25 degrees Celsius.
When external charging circuits drive current densities above three milliamperes per square centimeter, internal resistance generates substantial overpotentials. Charge transfer resistance across the electrode-electrolyte interface combines with mass transport resistance to push the working potential down.
Lithium metal nucleation requires a negative overpotential as its thermodynamic driving force. While local potential remains above zero millivolts, intercalation dominates because its Gibbs free energy change stays lower than that of metal deposition. Once local overpotential turns negative, metallic lithium begins nucleating on active graphite surfaces.
The energy barrier for this nucleation depends heavily on surface morphology, active material coatings, and local current concentration points.
| Operating Temperature (°C) | Applied Charge Rate (C) | Average Anode Potential (mV vs Li/Li+) | Local Plating Risk Level | Dominant Kinetic Limitation |
|---|---|---|---|---|
| -10 | 1.0C | -42 | Severe | Desolvation and electrolyte mass transport |
| 0 | 1.5C | -18 | High | Solid electrolyte interphase charge transfer |
| 15 | 2.0C | 5 | Moderate | Solid-state diffusion within graphite particles |
| 25 | 3.0C | -12 | High | Liquid-phase electrolyte salt depletion |
| 45 | 4.0C | 12 | Low | SEI growth and thermal decomposition |

Kinetic Obstacles at Reduced Temperatures
Transport properties in liquid electrolyte drop significantly as ambient temperatures fall. Lower temperatures increase electrolyte viscosity while depressing ionic conductivity and solid-state diffusion within active graphite particles. At 25 degrees Celsius, the solid-state diffusion coefficient of lithium in graphite ranges between ten to the minus nine and ten to the minus ten square centimeters per second.
Dropping the temperature to zero degrees Celsius lowers this diffusion rate by more than an order of magnitude. This sluggish diffusion causes lithium ions to accumulate at particle surfaces, inflating surface concentration and forcing local potential below zero volts.
Desolvation kinetics at the solid electrolyte interphase pose an even greater barrier at lower temperatures. Solvated lithium ions must shed their solvation sheaths before passing through the passivation layer. With an activation energy between 50 and 70 kilojoules per mole, desolvation becomes the primary rate-limiting step during cold fast charging.
When desolvation resistance dominates, intercalation cannot keep pace with the applied current, forcing metallic lithium to deposit on the outer edge of the passivation layer.
Plating permanently alters the graphite interface.
Negative electrode potential drops below zero volts against lithium reference when fast-charge rates exceed one point five C at temperatures below fifteen degrees Celsius.
Cell impedance rises rapidly thereafter.

Solid Electrolyte Interphase Transport Dynamics
Passivation layer thickness dictates the energetic barrier encountered by migrating metal ions. A stable solid electrolyte interphase allows selective transmission of lithium ions while blocking electron passage from the conductive host. High charging currents strengthen the electric field across this interface, promoting secondary reduction reactions.
If metallic lithium deposits beneath or within the passivation film, mechanical stress ruptures the inorganic matrix, exposing fresh metal to reactive electrolyte components.
Freshly deposited metallic lithium reacts rapidly with electrolyte solvents such as ethylene carbonate and ethyl methyl carbonate, forming secondary passivating compounds including lithium carbonate, lithium fluoride, and lithium alkyl carbonates. This ongoing reaction consumes active lithium ions and liquid electrolyte, permanently reducing cell capacity. Continuous cycling under plating conditions builds an uneven, high-resistance passivation layer that degrades local current distribution during subsequent charging steps.
Ambient temperature changes the reaction kinetics.
Charging cells past the thermodynamic plating threshold without active overpotential feedback degrades the solid electrolyte interphase, triggers irreversible capacity loss, and elevates thermal runaway probability during subsequent cycling.

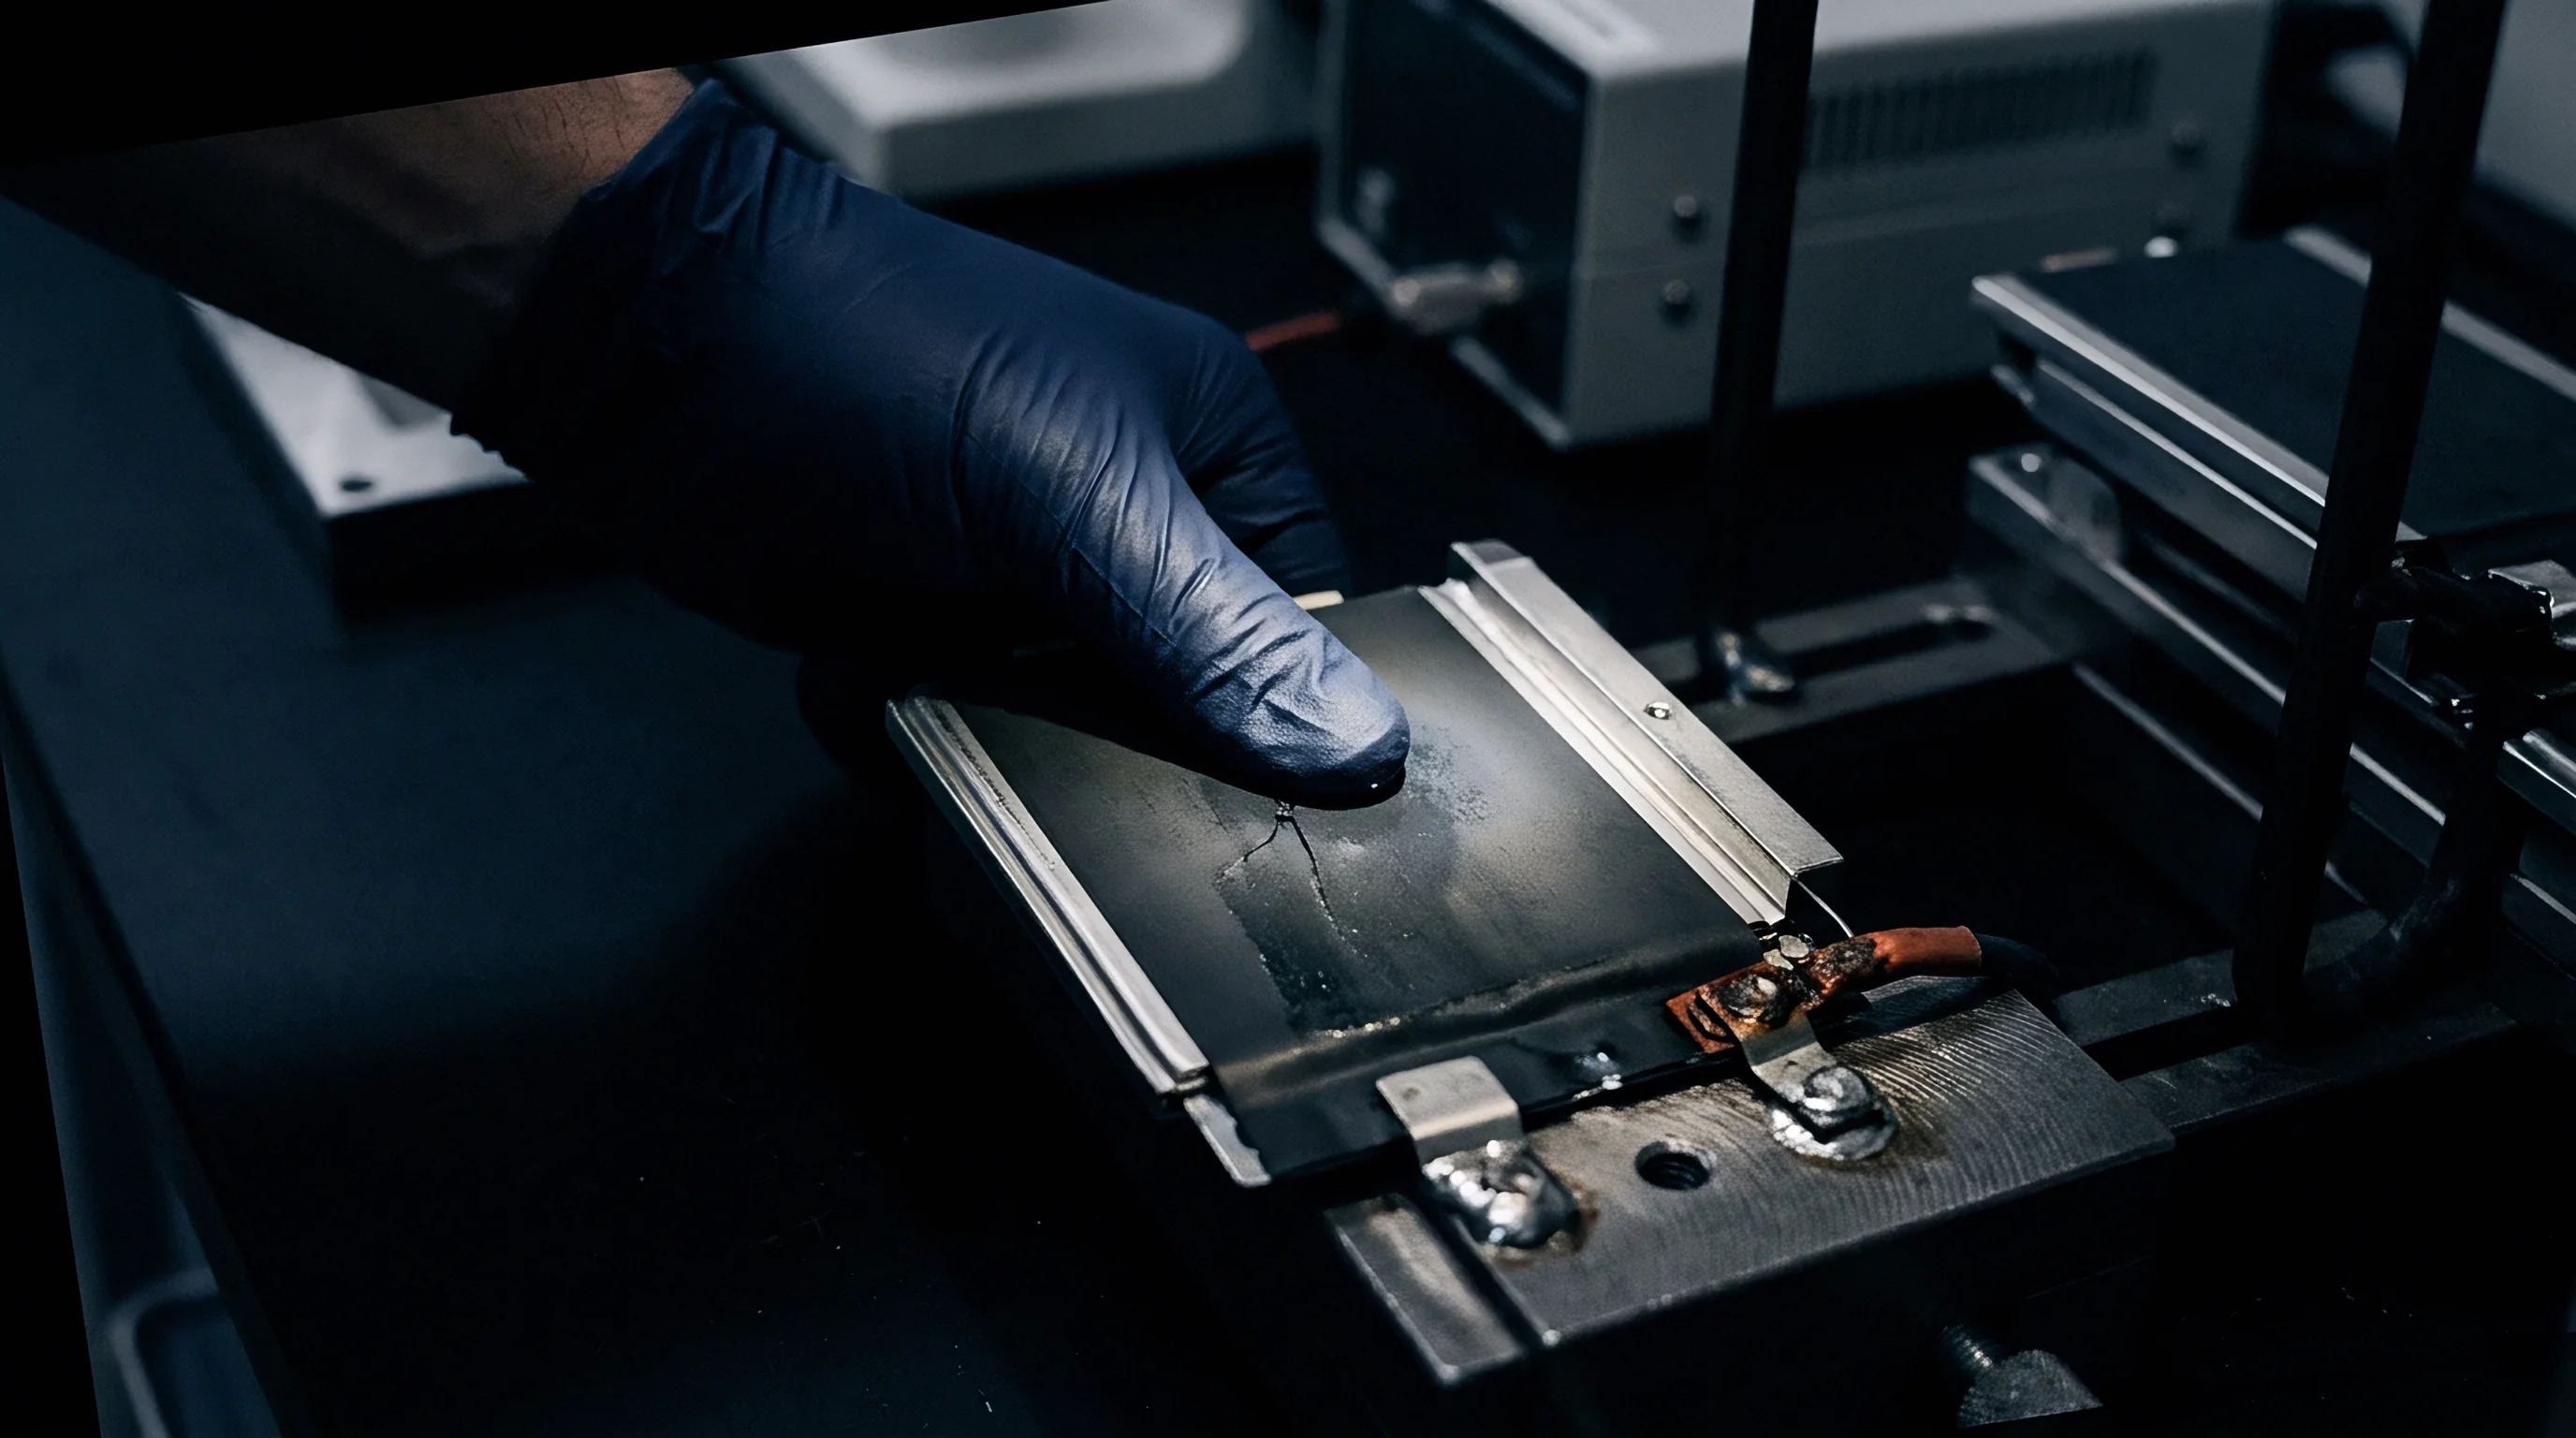
Screening
Non-destructive evaluation techniques isolate the electrochemical signatures produced when metallic deposits oxidize during initial discharge. When a cell containing metallic lithium rests or begins discharging, two parallel processes occur: metallic lithium strips into electrolyte ions, and metallic lithium re-intercalates into adjacent under-lithiated graphite host sites. Stripping happens because metallic lithium rests at a lower potential than partially lithiated graphite, forming a localized internal galvanic cell.
Catching these transient processes requires high-resolution voltage acquisition instruments during early discharge phases.
Production line quality assurance relies on diagnostic methods capable of identifying metallic deposits before cells enter module assembly. Standard capacity checks miss early-stage plating because initial side reactions usually manifest as minor voltage offsets rather than immediate catastrophic capacity drops. Advanced screening relies on differential capacity analysis, high-resolution voltage relaxation profiling, and electrochemical impedance spectroscopy to capture microvolt-level structural signals.
| Diagnostic Technique | Measurement Metric | Detection Limit (% Plated Li) | Test Duration | Production Feasibility |
|---|---|---|---|---|
| Differential Capacity (dQ/dV) | Low-voltage stripping oxidation peak | 0.5% | 1 to 2 hours | High during formation end-of-line |
| Voltage Relaxation Profiling | Inflection point in open-circuit voltage decay | 1.0% | 30 to 60 minutes | Very High in screening channels |
| Electrochemical Impedance | Charge-transfer arc distortion at high frequency | 2.0% | 5 to 10 minutes | Moderate during batch sampling |
| Ultrasonic Reflection Mapping | Acoustic signal attenuation across cell thickness | 1.5% | 1 to 3 minutes | High for pouch cell inline inspection |
| Titration Gas Chromatography | Hydrogen gas evolution upon solvent extraction | 0.1% | Destructive (4+ hours) | Zero (Audit teardown only) |
Differential Capacity Analysis Procedures
Differentiating discharge curves mathematically reveals distinct voltage plateaus corresponding to stripping events. Plated lithium oxidizes at potentials between 50 and 150 millivolts during early discharge. Calculating the derivative of cell capacity with respect to voltage converts subtle plateaus into clear, quantifiable peaks.
The magnitude of this stripping peak correlates directly with how much reversibly plated metallic lithium sits on the negative electrode surface.
To capture these features accurately, testing channels must maintain high voltage resolution and ultra-low noise thresholds. Integrating differential capacity analysis into inline quality control requires specific execution steps during cell grading:
- Apply a fast-charge current pulse matching the upper operational limit of the target duty cycle until the cell reaches upper cut-off voltage.
- Allow a mandatory five-minute open-circuit rest period for thermal equalization across the electrode stack.
- Initiate a low-rate discharge step at a continuous C-over-twenty rate down to eighty percent state of charge while logging voltage at ten-millisecond intervals.
- Compute the first derivative of capacity with respect to voltage across the zero point zero five to zero point three5 volt discharge window.
- Isolate the secondary oxidation peak located between fifty and one hundred twenty millivolts above the baseline graphite intercalation plateau.
- Calculate the area under the secondary oxidation peak to quantify the reversibly stripped lithium fraction against total throughput.
Gas generation follows separator perforation.
Evaluating supplier fast-charge profiles requires scrutinizing step-down current steps to confirm that local negative potentials stay positive throughout the charge phase. Continuous current steps applied without dynamic voltage limits frequently push the graphite surface into prolonged negative overpotential windows. Screening profiles that fail to account for temperature variation systematically underestimate plating risks under field conditions.

Voltage Relaxation and Stripping Inflections
Open-circuit decay curves recorded immediately following high-rate charge steps exhibit characteristically flat regions. While metallic lithium remains on the graphite surface, the open-circuit potential stays pinned near zero volts against the lithium reference until all metallic deposit either dissolves or re-intercalates. Once the metallic lithium disappears, voltage rises rapidly toward the true thermodynamic open-circuit potential of lithiated graphite.
The duration of this low-voltage plateau provides a direct measure of plating severity: longer relaxation plateaus signal larger metallic lithium deposits accumulated during charging. Calculating the time derivative of open-circuit voltage yields a sharp peak at the exact moment the metallic film depletes. Differential relaxation metrics enable automated test scripts to flag compromised cells without requiring full cell teardowns.
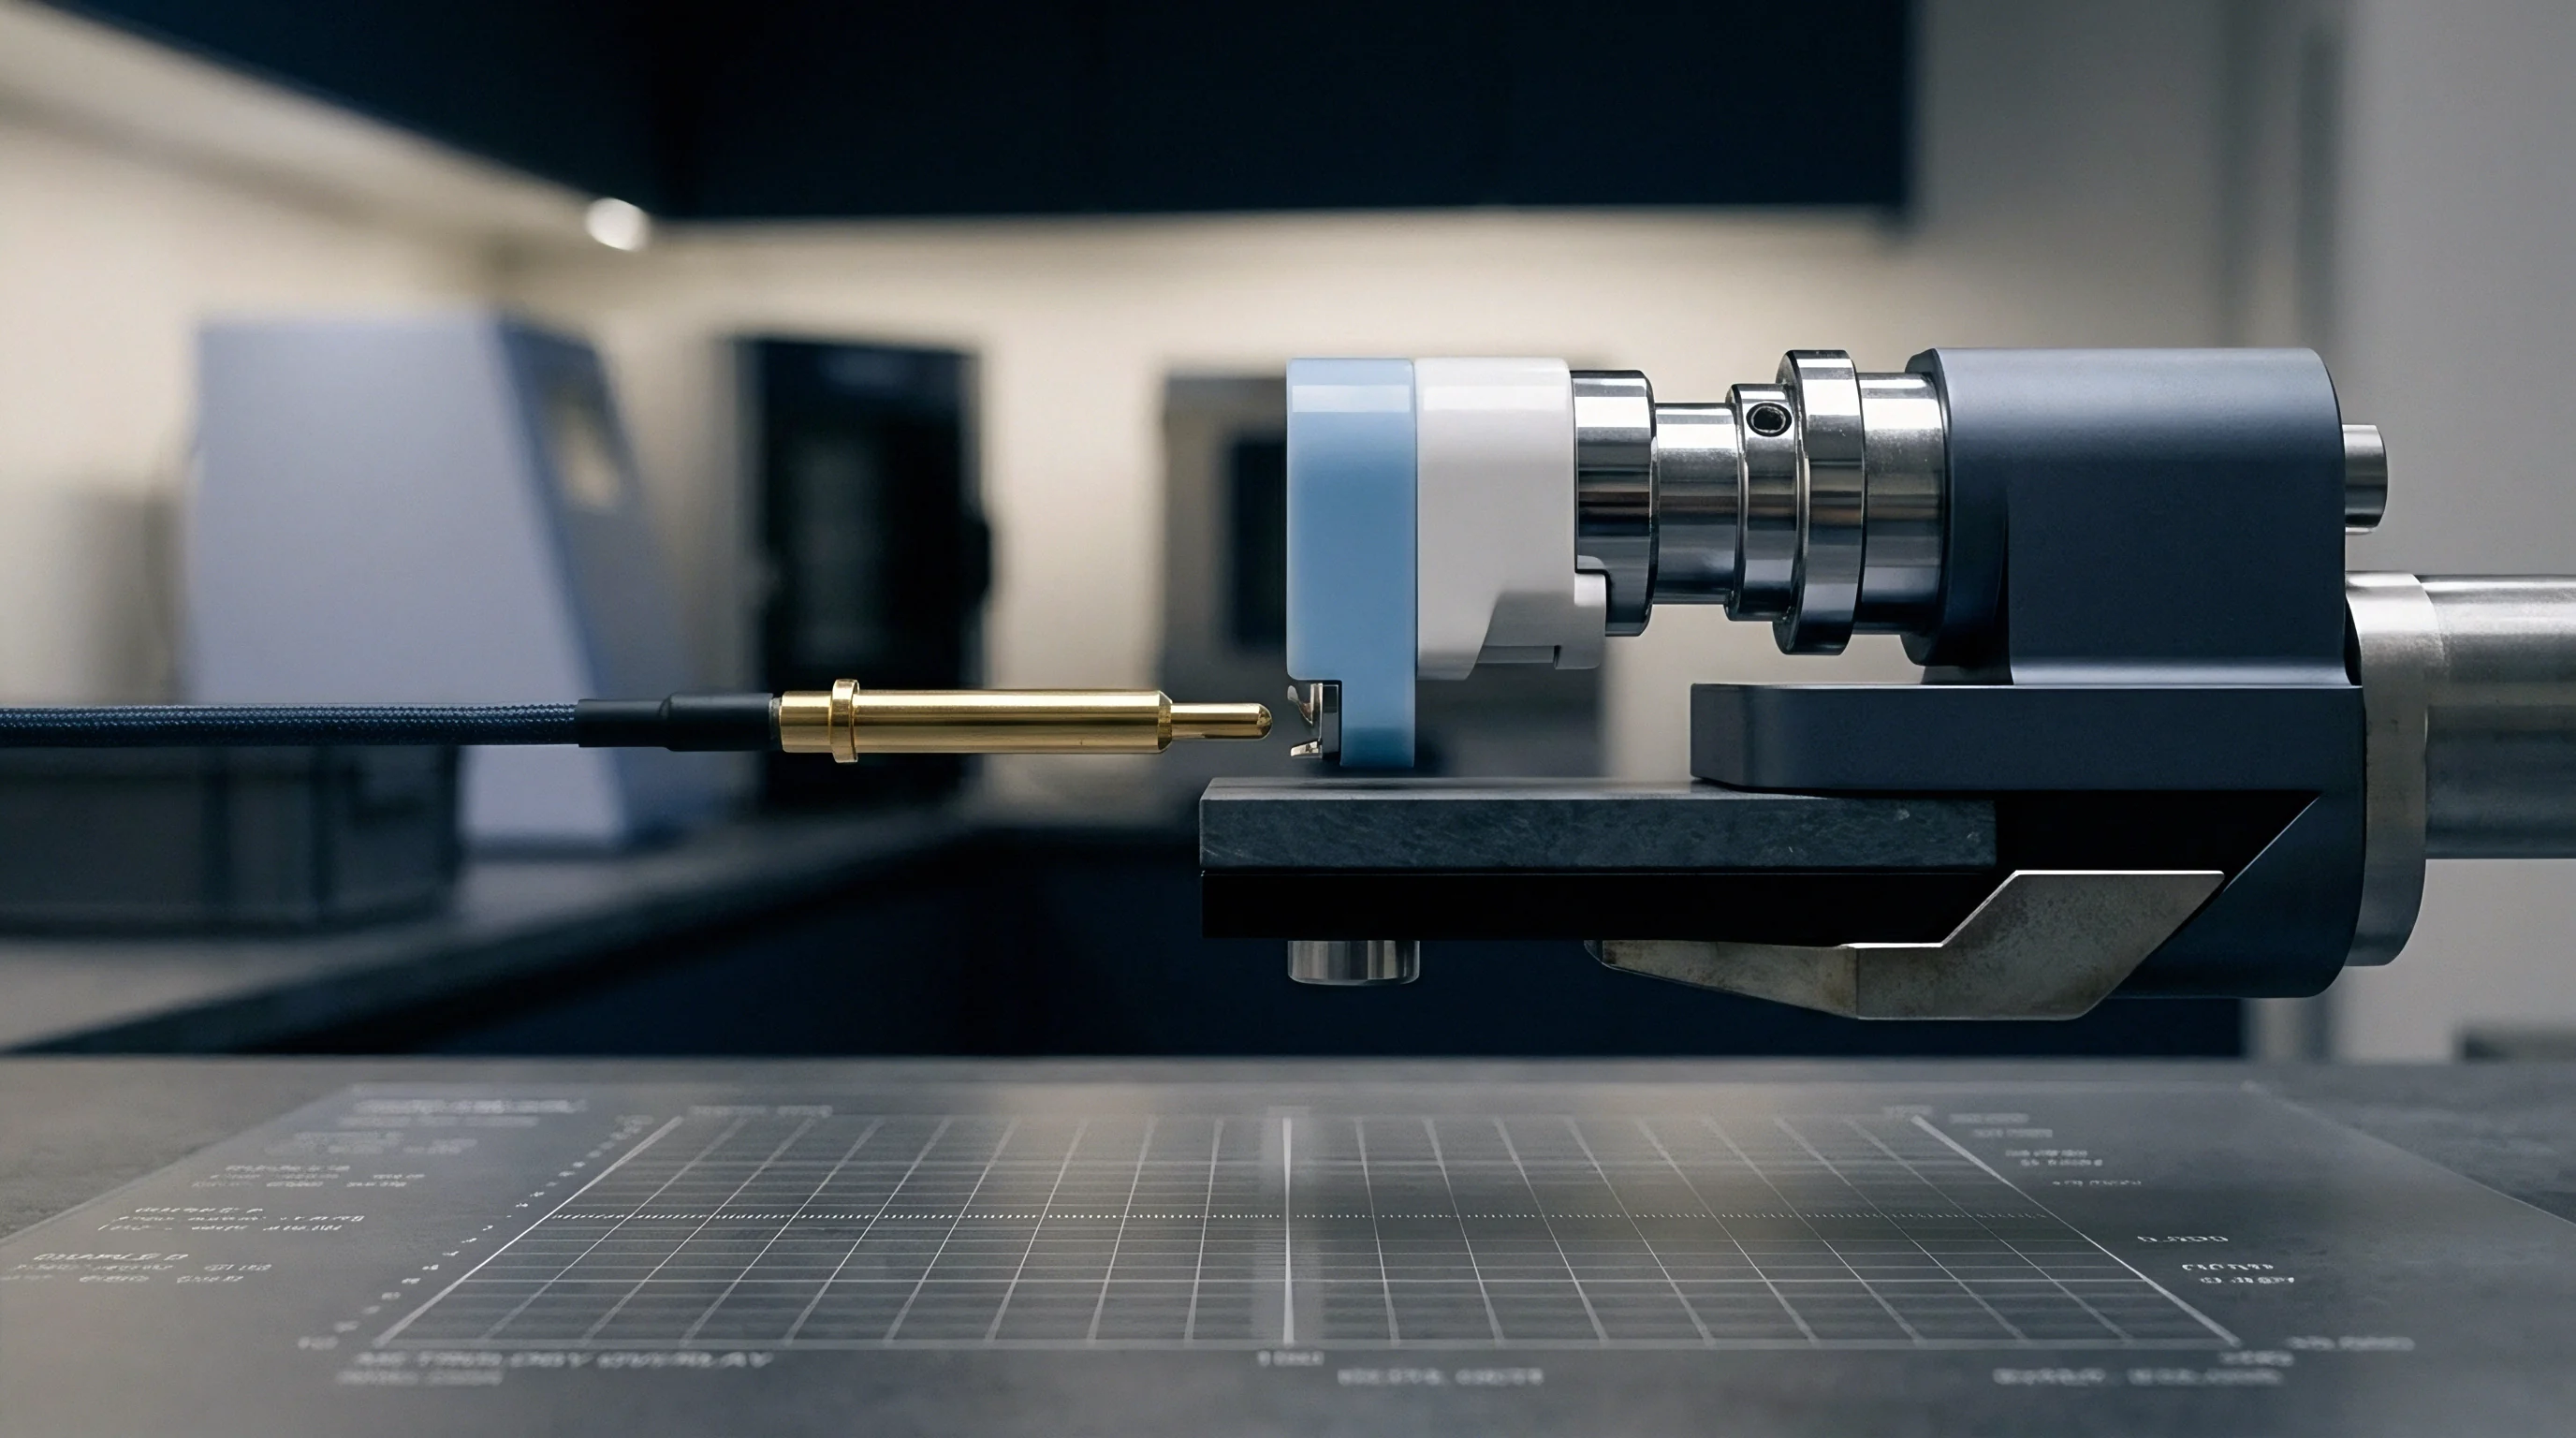
Nondestructive Diagnostic Methods Comparison
Laboratory screening tools vary in sample throughput, spatial resolution, and signal clarity. High-frequency impedance spectroscopy captures charge transfer resistance changes resulting from surface film modification, yet struggles to separate metallic lithium deposition from solid electrolyte interphase growth. Acoustic inspection methods track density changes across the electrode stack, detecting structural density shifts caused by porous metallic lithium accumulation.
Teardown analysis remains the ultimate reference standard for verifying non-destructive diagnostic tools. Harvesting electrodes inside dry rooms with dew points below minus 50 degrees Celsius allows visual and chemical identification of metallic lithium. Scanning electron microscopy combined with titration gas chromatography confirms the mass of dead metallic lithium trapped within the inactive layer matrix.
Differential capacity peaks during early discharge serve as immediate indicators of metallic lithium oxidation prior to cell impedance growth.
Cold charging accelerates dendrite formation.
Post-test voltage relaxation inflection points are sometimes dismissed on the assumption that minor surface metallic deposits re-intercalate benignly into the graphite host during standard rest periods.

Porosity
Internal pore networks regulate ionic movement through bulk active materials under high current demands. Anode tortuosity measures the ratio of an ion’s actual path length through electrolyte-filled pore space relative to the straight-line distance across the electrode thickness. High tortuosity restricts liquid-phase mass transport, creating sharp concentration polarization profiles during fast charging.
When lithium ion concentration drops near zero near the current collector, overpotential spikes dramatically, triggering localized lithium deposition on the front interface near the separator.
Calendering density sets the baseline porosity of commercial graphite anodes. Over-compacting reduces total pore volume, lowering effective ionic conductivity within the liquid electrolyte. Conversely, under-compacted electrodes suffer from poor particle-to-particle electronic contact, raising ohmic overpotential.
Balancing particle packing density against ionic transport pathways represents the central structural trade-off in fast-charging anode engineering.

Tortuosity and Ionic Diffusion Limits
The geometric path length through electrolyte-filled channels controls mass transport rates across thick electrode structures. Standard commercial graphite electrodes feature tortuosity values between three and six. High-rate applications require reducing tortuosity below two point five.
Alignment of graphite flakes perpendicular to the current collector foil shortens diffusion distances, suppressing concentration polarization during heavy current pulses.
Effective ionic conductivity inside pore networks depends directly on porosity divided by tortuosity. When fast charging drives current densities past four milliamperes per square centimeter, salt depletion occurs rapidly deep within the electrode. Electrolyte salt concentration drops from a nominal one point two moles per liter down to near zero at the current collector interface, forcing local potential into sub-zero values.

Where Does Metallic Lithium Deposit First?
Current density concentrates primarily near the separator interface during high-rate charging. Because ionic resistance through liquid electrolyte within the pores adds to the total reaction barrier, lithium ions react preferentially at the outer electrode surface facing the separator. This front-surface plating blocks pore entrances, restricting ionic transport deeper into the electrode interior.
Pore clogging creates a degradation feedback loop. Deposited metallic lithium occupies volume within the pore space, lowering local porosity and increasing local tortuosity. Subsequent charging current is forced into an even thinner active layer, worsening local current density and expanding the metallic plating zone across the separator surface.

Silicon Composite Particle Mechanics
Incorporating high-capacity alloying elements increases volumetric energy density while compounding mechanical strain. Silicon expands by up to three hundred percent upon full lithiation, compared to ten percent expansion in standard synthetic graphite. This massive volumetric oscillation breaks surrounding conductive carbon networks and damages the solid electrolyte interphase layer, worsening local potential variations that trigger lithium plating.
Silicon-graphite composite anodes require careful particle size distribution management. Mixing sub-micron silicon particles with spherical synthetic graphite preserves conductive pathways while mitigating pore volume loss during swell cycles. In cell qualification dossiers, full differential capacity plots across twenty-five cycle increments confirm that silicon volume changes do not accelerate surface plating events.

Structural Degradation Modes
Repeated lithium plating and stripping cycles induce irreversible changes in electrode morphology. Uncontrolled metallic deposition gives rise to diverse structural failure modes across commercial fast-charging cells:
- Dendritic Growth Structures needle-like metallic projections penetrate micro-porous polymer separators, causing localized low-resistance electrical shorts that initiate internal thermal runaway events.
- Dead Lithium Isolation un-lithiated metallic deposits lose electronic connectivity with the host graphite matrix during discharge stripping steps, permanently locking active lithium inventory into inactive surface crusts.
- Pore Network Clogging continuous secondary passivation reactions fill inter-particle void space with dense inorganic salts, raising ionic transport resistance across the electrode depth.
- Active Material Exfoliation volume changes and gas evolution associated with localized plating fracture graphite grain boundaries, detaching active material from copper current collector foils.
- Separator Compression Damage uneven surface plating forms localized metallic nodules that exert high mechanical point loads, thinning separator membranes and lowering breakdown voltage margins.
Local current density dictates local potential.
To verify structural stability under fast charging, engineering teams use standardized qualification checklists to evaluate candidate cell architectures before signing production purchase agreements:
- Electrode Loading Homogeneity verify that areal capacity variations across current collector surfaces remain within positive or negative two percent of target specification.
- Anode Overhang Alignment ensure negative electrode dimensions extend at least zero point five millimeters beyond cathode edges on all sides to prevent perimeter plating.
- Tortuosity Optimization Factor validate that effective ionic diffusion paths maintain values below three point zero through mercury intrusion porosimetry testing.
- Particle Sizing Distribution confirm that average graphite particle size retains a d50 value between eight and fourteen micrometers with minimal fine particle fraction.
- Binder Network Integrity evaluate binder adhesion strength through ninety-degree peel tests post-cycling to verify resistance against delamination under volume expansion stress.
Electrolyte depletion shortens cell life.
IEC 62660-2 test guidelines specify continuous cycle evaluation at upper operating temperature bounds to expose structural electrode degradation.
Active mass isolation reduces cell capacity.
The main uncertainty centers on whether high-silicon composite anodes can maintain sufficient pore connectivity under thousand-cycle fast-charge profiles without necessitating exterior clamp pressures that deform current collector foils.


Swell
Mechanical dimension changes during high-rate charging provide physical confirmation of lithium accumulation within cell stacks. Normal intercalation causes reversible electrode thickness changes proportional to state of charge. When metallic lithium plates onto graphite particle surfaces, stack volume expands beyond theoretical intercalation limits.
The accumulation of low-density metallic lithium combined with continuous solid electrolyte interphase decomposition products drives irreversible cell thickness growth.
Pouch and prismatic cells exhibit distinct expansion profiles under fast-charging routines. Unconstrained pouch cells experience localized pillowing as metallic deposits build near separator interfaces and secondary side reactions generate gaseous byproducts. Prismatic hard cases convert internal volumetric growth into high mechanical pressures against cell wall enclosures, increasing internal strain and risking vent activation.
Pressure Suppression of Dendrite Growth
External mechanical clamping forces alter the thermodynamic driving force for surface plating. Applying controlled uniform pressure across the electrode face maintains tight contact between graphite particles and conductive carbon networks, lowering local contact resistance. Furthermore, mechanical compression alters the surface energy of metallic lithium, encouraging dense planar deposition rather than high-aspect-ratio dendritic structures.
Optimal pressure bounds range between zero point two and zero point eight megapascals for pouch cell modules. Insufficient pressure allows metallic lithium to grow into high-porosity mossy structures that rapidly consume liquid electrolyte. Excess pressure exceeding one point two megapascals crushes electrode pore structures, trapping electrolyte and restricting liquid-phase mass transport.
To isolate mechanical expansion from internal gas generation, constant stack pressure is applied during pouch cell cycle testing.
| Applied Constraint Pressure (MPa) | Irreversible Swell Rate per 100 Cycles (%) | Average Porosity Loss (%) | Capacity Retention at 500 Cycles (%) | Primary Mechanical Degradation Mode |
|---|---|---|---|---|
| 0.0 (Unconstrained) | 4.8 | 2.1 | 68.4 | Delamination and mossy plating growth |
| 0.2 (Low Constraint) | 2.1 | 4.5 | 81.2 | Localized edge pillowing |
| 0.5 (Optimal Constraint) | 0.9 | 6.2 | 89.6 | Uniform SEI thickening |
| 1.2 (High Constraint) | 1.4 | 14.8 | 76.3 | Electrode pore crushing and electrolyte dry-out |
| 2.0 (Excessive Constraint) | 2.3 | 22.1 | 62.1 | Current collector foil buckling and edge shorting |
Pouch and Prismatic Expansion Metrics
Physical displacement measurements captured via high-resolution transducers track volume growth throughout fast-charge protocols. In situ dilatometry registers instantaneous thickness variations during charge-discharge cycling. A distinct slope change in the thickness-versus-capacity curve serves as an immediate physical marker for the onset of lithium plating.
Swelling protocols used during cell incoming inspection rely on strict measurement sequences to isolate plating-induced expansion from normal thermal expansion:
- Mount the target cell inside a temperature-controlled environmental chamber maintained at twenty-five degrees Celsius plus or minus zero point five degrees.
- Install dual-channel displacement sensors against the geometric center of the cell main face under a baseline preload of zero point zero five megapascals.
- Perform three baseline formation cycles at C-over-five rate to establish reference intercalation thickness expansion curves.
- Execute the candidate fast-charge profile to one hundred percent state of charge while recording real-time thickness and temperature profiles.
- Hold the cell at open-circuit rest for two hours until thermal equilibrium returns to baseline environmental conditions.
- Measure residual irreversible thickness growth and compare values against the standard intercalation baseline threshold.
Thermal runaway remains the ultimate failure.
Applying active compression to pouch cells mitigates lithium dendrite growth across high-rate cycling routines.
Pressure application suppresses surface dendrites.
Constraining pouch expansion through rigid exterior plates preserves interfacial contact and extends cycle life during aggressive current pulses.


Dossier
Commercial cell procurement requires verifiable test evidence proving that fast-charging claims hold across volume shipments. Cell datasheets routinely highlight aggressive charge times without detailing the environmental temperatures, pressure constraints, or cycle life cut-off conditions required to achieve those numbers. A cell rated for ten-to-eighty percent charging in fifteen minutes at 45 degrees Celsius may exhibit rapid lithium plating and capacity collapse when charged at identical rates at 15 degrees Celsius.
Comparing nominal cell ratings against continuous fast-charge curves reveals a forty percent reduction in usable cycle life when charge routines skip multi-step current tapering. Technical procurement documents must mandate complete qualification dossiers that map operating limits across the entire temperature and state-of-charge spectrum. Buyers who rely on single-point datasheet claims inherit unquantified warranty exposure and risk catastrophic field failures.

Procurement Protocols for Fast-Charging Cells
Technical evaluation routines separate artificial qualification data from real-world performance capability. Cell qualification programs demand rigorous batch sampling, destructive physical analysis, and long-term cycle validation under worst-case thermal and electrical conditions. The qualification dossier must contain raw channel data detailing overpotential behavior, gas evolution rates, and differential capacity metrics across multiple production lots.
Single-source dependencies compound risk when fast-charging chemistries undergo unannounced material substitutions. Cell manufacturers frequently adjust binder formulations, surface coatings, or electrolyte additives to lower production costs. These minor modifications alter desolvation kinetics and solid electrolyte interphase stability, shifting the lithium plating boundary.
Establishing a comprehensive qualification dossier creates a legally binding technical baseline that restricts unauthorized supplier process changes.
Contractual Capacity Fade Warranties
Financial guarantees governing cell lifecycle degradation depend upon precise operating definitions within purchase agreements. Suppliers routinely void warranty obligations if cell packs operate outside narrow temperature envelopes or exceed specific fast-charging frequencies. Standard procurement contracts must explicitly define acceptable fast-charging duty cycles, thermal management obligations, and capacity retention measurement protocols.
To ensure commercial protection, purchase specifications include verifiable data requirements that suppliers submit before lot acceptance:
Inspection confirms anode edge overhang alignment.
Dead lithium permanently forfeits inventory.
Including a mandatory continuous fast-charging degradation clause referencing IEC 62660-1 cycle specifications shifts financial liability for early capacity drop off from the pack integrator directly back to the cell manufacturer.