Local Overpotential Gradients in High Capacity Prismatic Lithium Cells
Local overpotential gradients drive localized anode plating in high-capacity prismatic cells, requiring edge-welded tab designs and precise voltage margins.


Polarization
In 280Ah to 320Ah prismatic lithium-ion cells, total terminal voltage is merely a spatial average across active material surfaces that can exceed one square meter. Local potential deviates whenever regional current density shifts away from the Nernst equilibrium potential. Electrode kinetics, ionic transport through the electrolyte, and electronic conduction along current collectors interact to create uneven driving forces, so the local reaction rate at any point on the roll depends on the exact voltage difference between the solid and liquid phases.

Electrode Potential Divergence across Large Area Form Factors
Departure from open-circuit potential breaks down into three spatial components across the electrode plane: ohmic losses along collector foils, charge-transfer resistance at active material interfaces, and concentration overpotentials from salt gradients in the porous matrices. In a 300Ah cell charged at 1C, local current density varies by over forty percent between the area immediately adjacent to the terminal tabs and the bottom folded corners.
Long conduction paths through aluminum and copper current collectors create measurable voltage drops along the length of the cell. Foil thicknesses typically run 6 to 10 micrometers for copper and 12 to 15 micrometers for aluminum. As current gathers toward the tabs, local solid-phase potentials shift along the foil.
Active material near the negative tab sees a higher effective charge rate, pulling local anode potential down toward zero volts relative to metallic lithium.
Solid-phase ohmic losses in 8-micrometer copper current collectors generate up to 42 millivolts of potential offset along a 1.2-meter jellyroll at a 1C charge rate under 25 degrees Celsius.
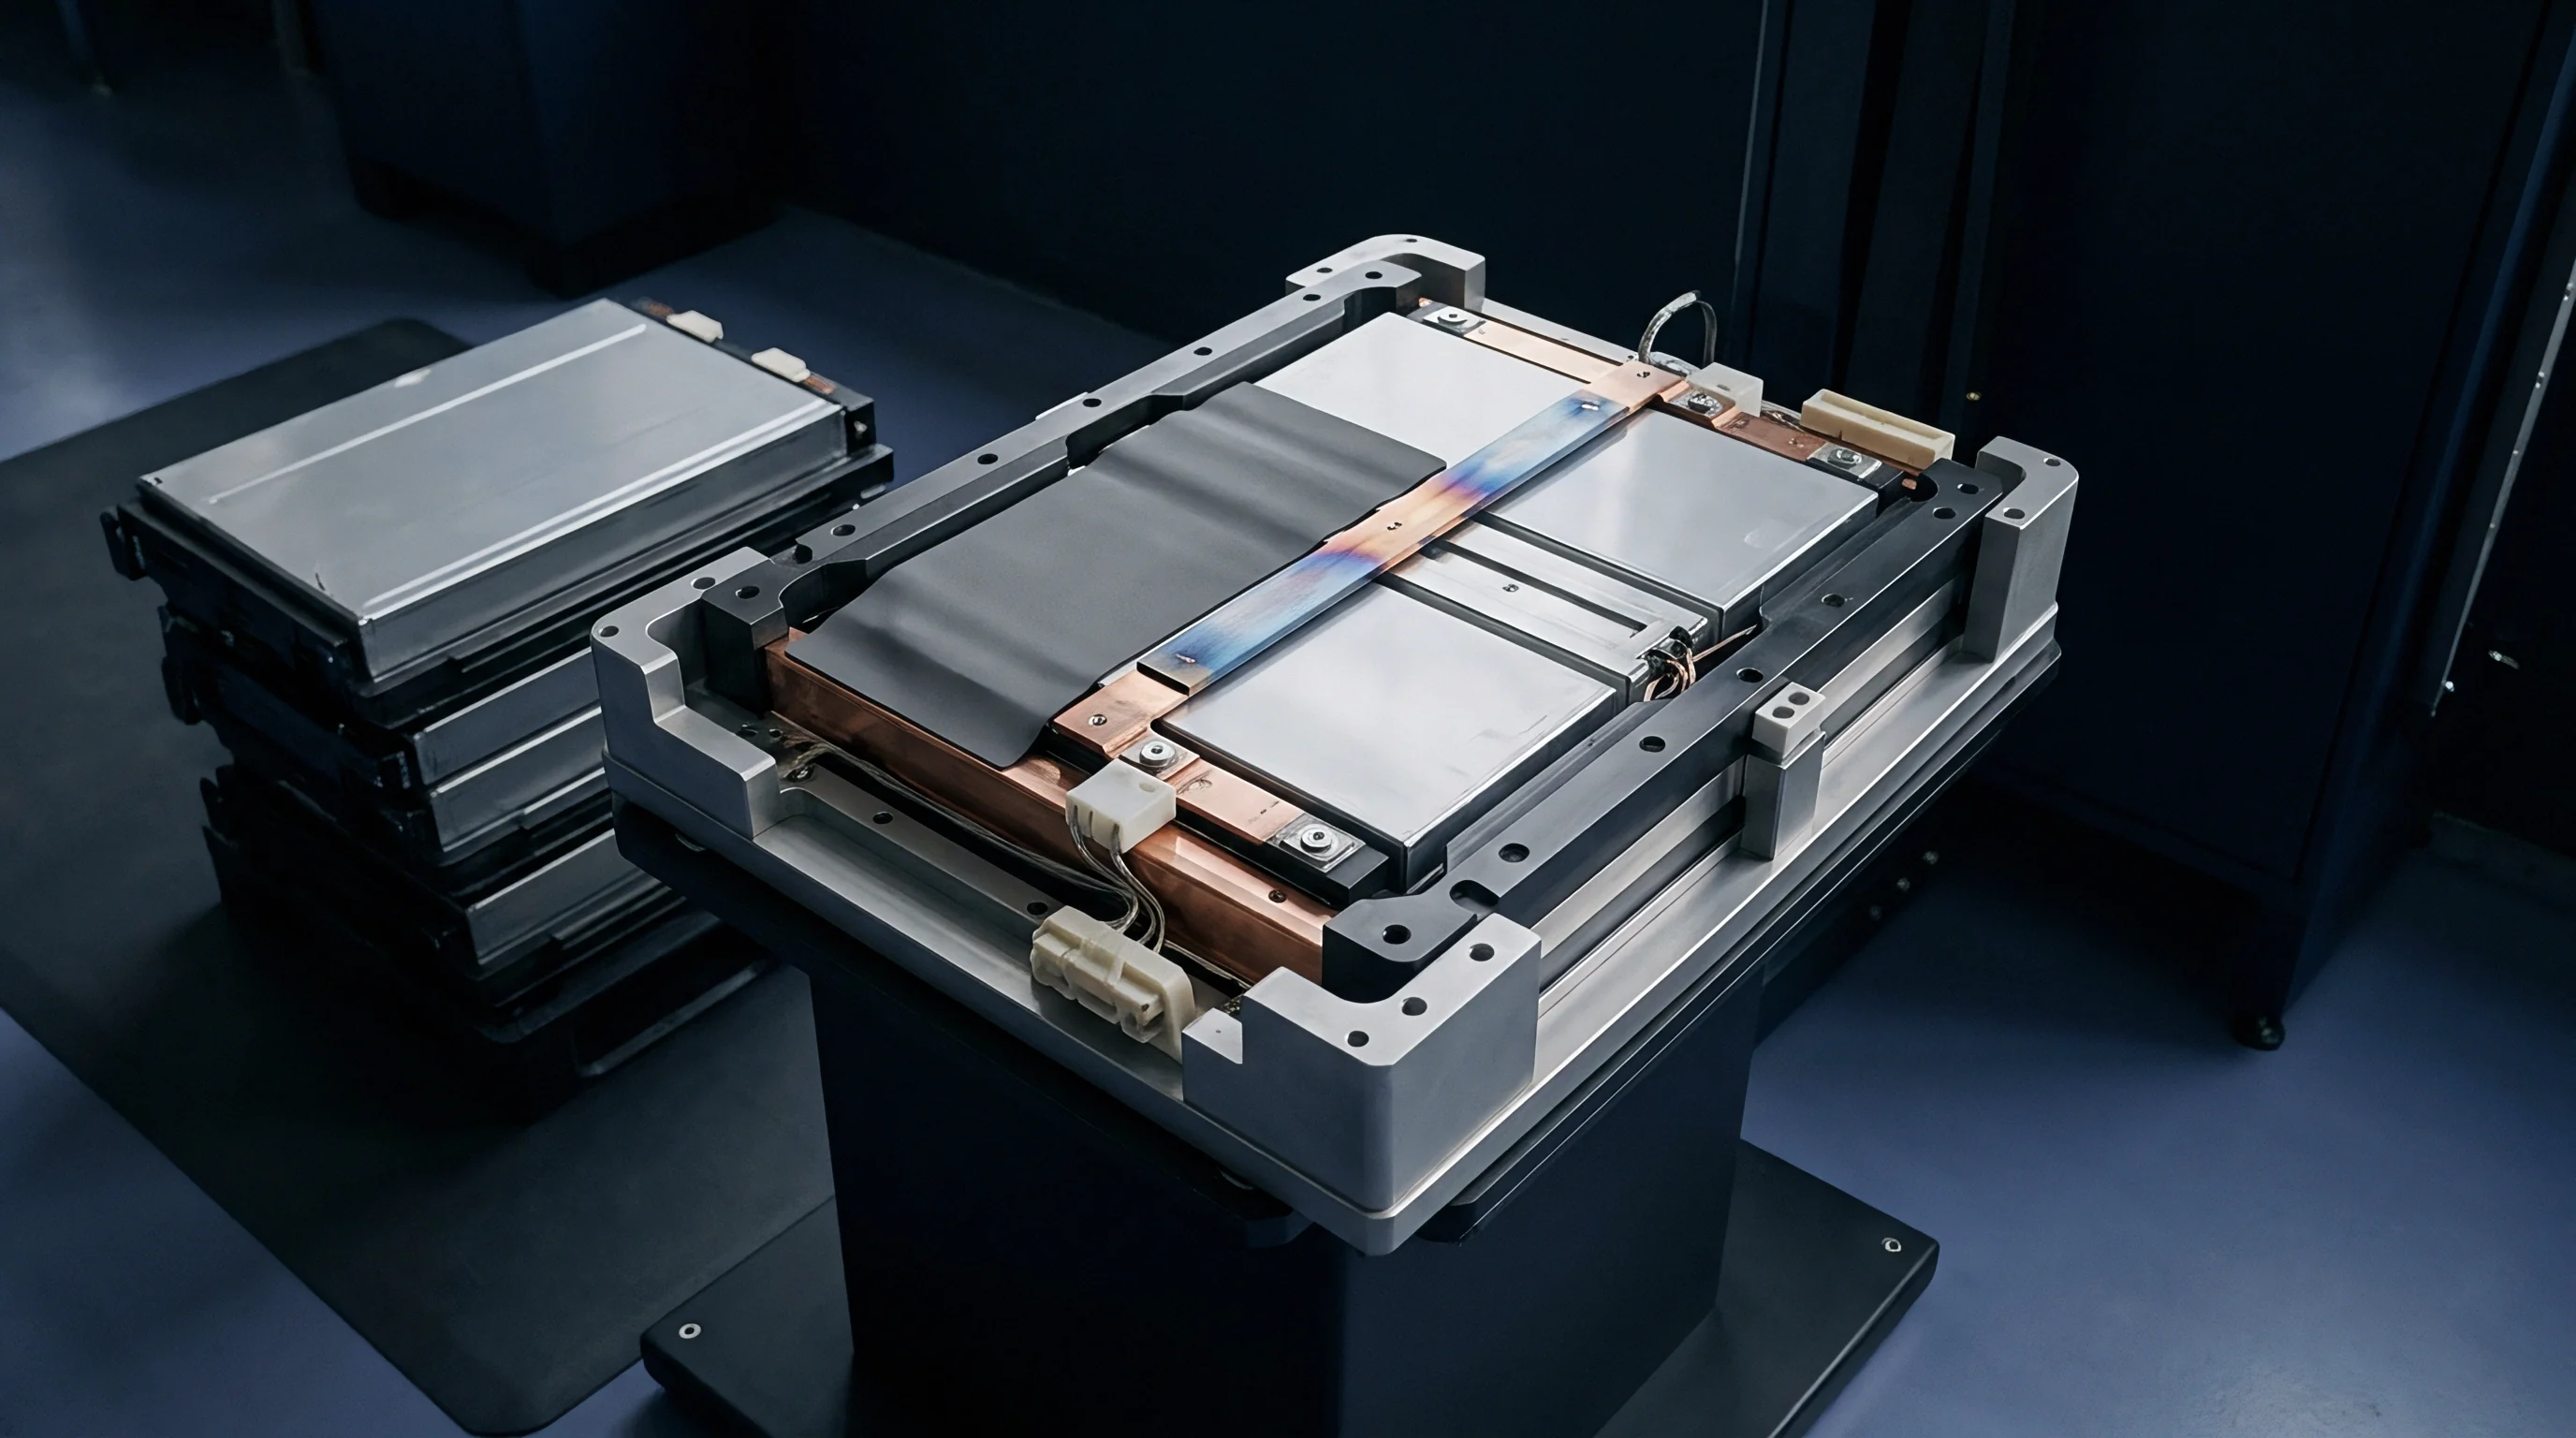
Coupled Transport Processes in Dense Electrode Matrices
Thick coatings meant for high energy density worsen liquid-phase transport limits. Modern prismatic cells often use single-sided coating weights above 15 to 20 milligrams per square centimeter compressed below 30 percent porosity. Under high charge rates, lithium-ion depletion inside inner pores spikes local diffusion overpotential, pulling the reaction zone toward the separator interface.
Depletion inside cathode pores accelerates local polarization, shifting current unevenly across the electrode depth. Heat building near current bottlenecks lowers local electrolyte viscosity and increases ionic conductivity, drawing even more current into those warm channels. This thermal-electrochemical coupling forms self-reinforcing current loops that last through the charge cycle.
| Electrode Region | Ohmic Potential Drop (mV) | Charge Transfer Overpotential (mV) | Concentration Overpotential (mV) | Local Anode Potential vs Li/Li+ (mV) |
|---|---|---|---|---|
| Adjacent to Negative Tab | 38.2 | 64.5 | 41.0 | 12.3 |
| Mid-Span Electrode Surface | 19.1 | 48.2 | 28.4 | 58.3 |
| Distal Folded Corner | 4.5 | 35.1 | 18.2 | 96.2 |
| Separator Interface (Tab Zone) | 41.0 | 72.1 | 53.6 | -2.7 |
Cell designers manage these gradients by tailoring foil dimensions, coat-weight transition zones, and separator wetting. Standard full-cell voltage telemetry misses localized negative overpotentials entirely, leaving lithium plating drivers to build up undetected during routine constant-current charging.


Tabs
Terminal geometry and internal tab layout set the boundary conditions for current flow across large-format electrodes. As current enters and exits through discrete metallic bridges, three-dimensional volume current compresses into planar paths, deciding whether current density stays flat or spikes along the foil.

Current Density Distribution under Varied Flag Configurations
Single-tab overhang designs force current down the entire collector, maximizing resistance. Opposite-side multi-tab setups shorten this path, lowering foil resistance and smoothing local potential profiles. Continuous edge welding along the top foil spreads current evenly, eliminating major bottlenecks along the upper margin.
Tab placement dictates local current density near the top seal. Placing positive and negative flags directly opposite each other shortens path lengths through the separator, which spikes local heating. Offsetting the tabs lengthens the path slightly but spreads thermal loads across more of the aluminum case.
- Tab Edge Stress creates high current density right beneath ultrasonic weld joints, accelerating electrolyte breakdown.
- Collector Foil Tear occurs near tab transitions from thermal expansion mismatch during high-rate discharge.
- Separator Shrinkage starts at tab hot spots where local temperatures exceed the separator’s thermal limits.
- Corner Plating Risk grows when tab placement leaves distal foil underutilized while tab-adjacent zones run at twice nominal current density.

Thermal-Electrical Interaction at Collector Welds
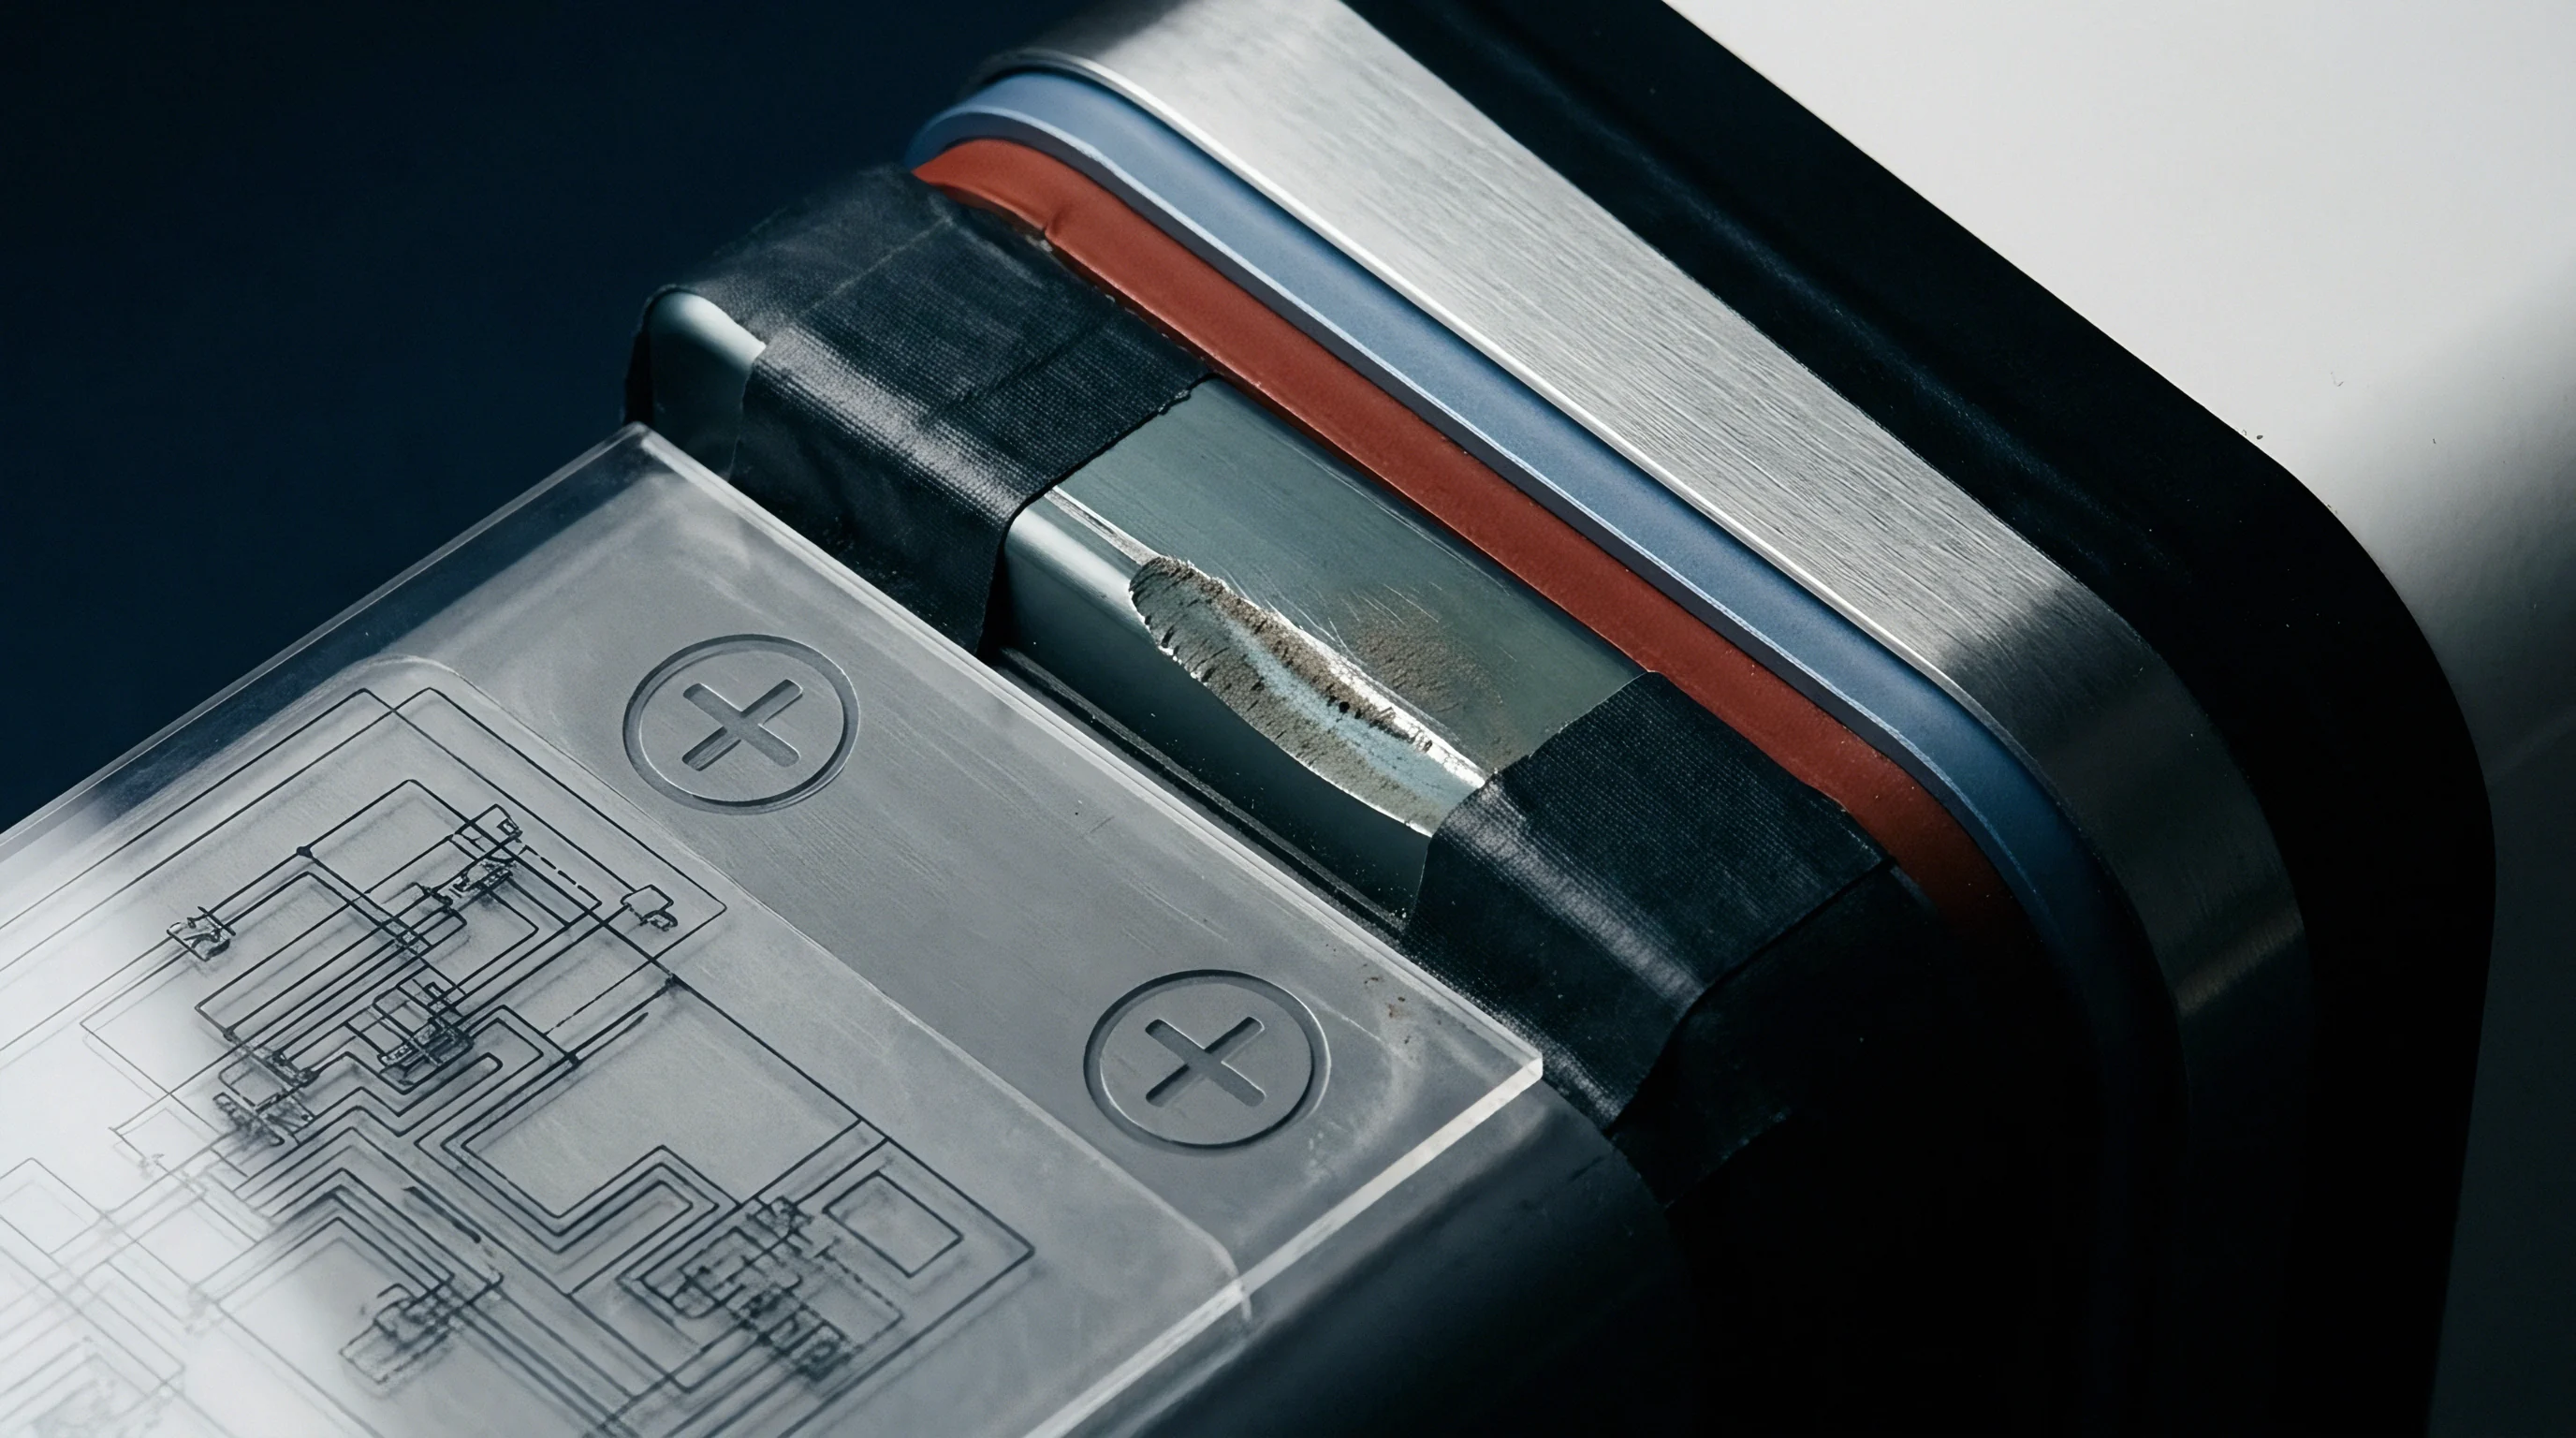
Ultrasonic tab welds introduce contact resistance variations across individual foil layers. A difference of just ten micro-ohms across tab joints forces disproportionate current through lower-resistance copper leaves. Current crowding at these joint boundaries increases local ohmic dissipation, creating thermal spikes up to 15 degrees Celsius above the bulk cell core.
| Topology Configuration | Peak Current Density Ratio (Local/Nominal) | Max Planar Temperature Differential (C) | Foil Voltage Loss Range (mV) |
|---|---|---|---|
| Single Side Flag Weld | 2.85 | 14.2 | 48.6 |
| Dual Opposite Flag Weld | 1.62 | 7.8 | 22.1 |
| Continuous Edge Laser Weld | 1.12 | 2.1 | 6.3 |
Localized capacity loss frequently traces to surface temperature gradients across the aluminum casing when external cooling plates fail to maintain uniform heat extraction.

Plating
Metallic lithium deposits when local graphite anode potential drops below zero volts against Li/Li+. Overpotentials push the potential negative mostly near current tabs during fast charging at low temperatures. Once started, mossy or dendritic deposits break down the solid electrolyte interphase, consume active lithium, and raise internal resistance.

Thermodynamic Thresholds and Voltage Margins
Anode potential sits at open-circuit potential minus combined ohmic, charge-transfer, and diffusion overpotentials. Higher charge rates amplify all three components, driving local anode potential past the threshold for lithium reduction. Cold temperatures worsen this by slowing lithium diffusion in graphite and lowering electrolyte conductivity.
The buffer against lithium plating shrinks quickly above sixty percent state of charge. As intercalation potential plateaus near 85 millivolts versus Li/Li+, overpotential spikes beyond this margin force lithium to precipitate directly onto the graphite surface rather than intercalate.
Negative anode potential relative to lithium metal triggers localized lithium deposition even when full-cell terminal voltage remains well within safe operational limits.

Procedure for Thermal-Overpotential Screening
Screening cell designs for localized plating susceptibility requires structured electro-thermal characterization across broad operational boundaries.
- Soak test cells in an environmental chamber at 10 degrees Celsius for six hours to achieve thermal equilibrium.
- Apply a stepped charge profile starting at 0.5C and escalating to 1.5C in ten percent state-of-charge increments.
- Monitor differential voltage response during relaxation phases following each charge step to detect post-charging voltage plateaus characteristic of re-intercalation.
- Extract core samples from tab-adjacent and corner electrode regions inside an argon glovebox for cold-stage scanning electron microscopy analysis.
- Quantify elemental lithium content on harvested anode surfaces via differential scanning calorimetry.
| Ambient Temperature (C) | Charge Rate (C-Rate) | Bulk Cell Terminal Voltage (V) | Minimum Local Anode Potential (mV vs Li/Li+) | Plating Status |
|---|---|---|---|---|
| 25 | 0.5 | 3.45 | +62.1 | No Plating |
| 25 | 1.5 | 3.60 | -8.4 | Localized Plating |
| 10 | 0.5 | 3.50 | +18.3 | No Plating |
| 10 | 1.0 | 3.58 | -34.2 | Severe Plating |
| 0 | 0.2 | 3.42 | +5.1 | Marginal Trace |
Ignoring local potential shifts during fast-charge protocol development leads to internal short circuits, early capacity roll-off, thermal runaway during transport vibration tests, and voided safety certifications.


Diagnosis
Detecting internal overpotential gradients within sealed prismatic cans requires non-destructive sensing and electrochemical decomposition tools. Standard battery management systems measure overall potential across external terminals, leaving protection systems blind to local spatial variations. Engineers turn to impedance analytics, surface thermal mapping, and embedded sensors to pinpoint localized stress.

Electrochemical Impedance Spectroscopy Deconvolution
Decomposing impedance spectra across frequencies exposes where overpotentials build up. The high-frequency intercept tracks pure ohmic resistance from tab weld degradation or electrolyte drying. Mid-frequency arcs reflect charge-transfer resistance across interfaces, while the low-frequency Warburg tail captures lithium diffusion inside active material grains.
Micro-reference electrodes embedded inside test cells measure local anode and cathode potentials directly against a stable reference. These three-electrode prismatic setups reveal exact potential drop profiles across the foil under dynamic loads, validating finite-element models prior to production sign-off.

What Field Non-Destructive Tests Detect Local Anode Polarization?
Field diagnostics rely on high-precision differential capacity analysis and thermal imaging under load pulses. Shifts in high-resolution dQ/dV curves show peak broadening from uneven SOC across the electrode plane, while infrared thermography during high-rate discharge pulses highlights thermal gradients over internal current bottlenecks under collector tabs.
UN 38.3 vibration certification validates mechanical integrity during transport but fails to detect pre-existing internal lithium plating caused by localized overpotential spikes during factory formation cycles.
It remains uncertain whether low-cost ultrasonic time-of-flight acoustics can reliably distinguish localized metallic lithium accumulation from electrolyte gassing in active packs.


Dossier
Regulations increasingly require full technical files proving cell designs resist localized degradation throughout their operating life. EU Battery Regulation mandates require manufacturers to submit verifiable durability models and risk audits before commercial release, showing overpotential stress stays within safe limits during fast charging.

Regulatory Submission Requirements and Electrochemical Proof
Validation dossiers must explicitly tie physical cell design to spatial current models. UN 38.3 test summaries verify basic shipping safety, but commercial compliance under current battery mandates demands life-cycle simulation data. Importers need engineering records documenting local potential profiles under extreme temperatures.
Sourcing reviews verify compliance files against regulatory mandates to eliminate documentation gaps before shipment release.
- Spatial Overpotential Maps detailing modeled and measured anode voltage profiles across the electrode area at maximum fast-charge C-rate.
- Formation Process Records documenting initial solid electrolyte interphase formation protocol details, temperature conditions, and baseline impedance footprints.
- Thermal Mapping Audits proving surface temperature variations remain within five degrees Celsius under maximum rated continuous discharge.
- Non-Destructive Test Summaries verifying batch-level screening protocols for localized internal impedance spikes prior to factory dispatch.
EU Battery Regulation Compliance Provisions
Annex VI of the EU Battery Regulation requires detailed reporting on performance and durability metrics, specifically targeting capacity fade. Technical files must mark the operational boundaries where lithium plating occurs. Manufacturers must provide test records proving fast-charge protocols will not induce localized overpotentials that cause internal shorts within 1,500 full equivalent cycles.
Cell documentation missing spatial overpotential modeling fails European Union technical file verification, preventing shipment clearance at import customs terminals.
Sourcing contracts enforce compliance by requiring access to formation records. Standard language specifies that the seller guarantee technical dossiers contain validated three-electrode potential measurements across all declared fast-charge profiles, and failure to provide these records gives the buyer immediate right of shipment rejection without penalty.


Warranty
Contractual risk allocation for prismatic cell orders hinges on distinguishing normal capacity decay from localized degradation. Overpotential-driven plating accelerates capacity fade, creating sharp knees in cycle-life curves. Buyers need supply agreements structured to protect against latent failures caused by internal potential imbalances.

Liability Allocation for Non-Uniform Degradation Modes
Standard supplier warranties guarantee general capacity retention ~ typically eighty percent after 3,000 cycles under nominal conditions ~ while excluding damage from fast charging outside recommended limits. When localized overpotentials trigger early failure within agreed operating windows, disputes center on whether the fault lies in cell design or pack thermal management.
Resolving warranty claims takes clear evidence separating pack operating conditions from cell design flaws. Buyers pull differential capacity data from returned units to show plating occurred within approved voltage and temperature limits. Setting overpotential baselines during qualification establishes the contractual bar for future batch acceptance.
- Baseline Capacity Thresholds must specify exact C-rate, temperature, and cut-off voltage conditions to remain contractually enforceable.
- Inflection Point Exclusions define acceptable cycle-life curve slopes, triggering full batch warranty remediation if capacity drops sharply prior to guaranteed cycle milestones.
- Impedance Growth Limits restrict maximum allowable real impedance increase at 1 kHz, preventing suppliers from delivering high-resistance cells prone to excessive local polarization.
- Batch Rejection Criteria enforce lot-level rejection rights when sample tear-down inspections reveal localized metallic lithium deposits on harvested anode sheets.

Contractual Risk Mitigation Framework
Purchase orders set clear qualification test terms, tying incoming quality metrics directly to batch settlement. Yield losses from local overpotential failures shift back to the supplier if acceptance testing shows lot impedance variance exceeding five percent of nominal specification.
| Failure Driver | Physical Root Cause | Commercial Consequence | Liability Allocation |
|---|---|---|---|
| Tab-Adjacent Plating | High local overpotential during fast charge | Accelerated capacity roll-off at cycle 800 | Supplier carries cell replacement cost |
| Corner Gas Generation | Localized liquid-phase diffusion limitation | Pouch/Can swelling causing pack distortion | Shared liability based on BMS log audit |
| Internal Micro-Short | Dendrite penetration through separator | Thermal event, complete pack loss | Supplier indemnifies pack builder fully |
Selecting cell designs that maintain balanced internal current density heads off warranty disputes long before purchase orders are signed.