Evaluating Baseline Laboratory Cycle Life Protocols for Lithium Cells
Laboratory cycle life claims hold commercial value only when test cut-offs, clamping force, four-wire telemetry, and Weibull distributions are verified.


Regime
A single test channel running a 0.5C charge and 0.5C discharge profile in a 25 degrees Celsius environmental chamber yields an idealized retention figure that rarely matches field life. Standard laboratory protocols exist to give engineers repeatable baselines across cell designs, but specific boundary conditions determine whether the resulting figure reflects genuine electrochemical stability or just a bench artifact. When a specification sheet quotes 2,000 cycles to 80 percent retention, that performance depends on continuous symmetrical currents, tight thermal regulation, extended rest periods, and a lenient cut-off window.
Altering any of those parameters shifts the aging rate immediately.
Under international frameworks like IEC 61960-3, standard baseline testing requires charging at a constant current of 0.2C up to the upper cut-off voltage, holding constant voltage until current tapers down to 0.02C, resting between 15 minutes and one hour, and discharging at 0.2C constant current to the lower voltage limit. This moderate protocol limits concentration polarization and prevents steep thermal gradients across the jelly-roll. Industrial qualification programs often compress eighteen-month schedules down to four months by cycling at 0.5C or 1.0C.
That acceleration, however, introduces overpotentials that alter the primary aging pathway ~ swapping gradual solid electrolyte interphase growth for localized lithium plating or cathode microcracking.
Baseline protocols demand strict constant current constant voltage sequences. The constant voltage step serves as a buffer: as cell resistance climbs with age, the cell spends progressively more time in the constant voltage stage and less in constant current. For high-nickel layered oxide chemistries like NMC 811 matched with graphite-silicon composite anodes, extended exposure to high potential during that prolonged constant voltage step accelerates transition metal dissolution and electrolyte oxidation.
Conversely, omitting the constant voltage hold entirely leaves the cell uncharged across its top five to ten percent state of charge, sparing the cathode from aggressive high-potential reactions and artificially stretching cycle numbers.
| Standard Designation | Nominal Charge Current | Charge Taper Cut-off | Discharge Current | Thermal Chamber Setting | Inter-Step Rest Interval |
|---|---|---|---|---|---|
| IEC 61960-3 Standard Endurance | 0.2C Constant Current | 0.02C or 0.05C | 0.2C Constant Current | 20 +/- 5 deg C | 10 min to 60 min |
| IEC 62660-1 BEV Dynamic Cycle | Profile Dynamic Step | No CV Hold | Profile Dynamic Step | 25 deg C and 45 deg C | 10 min |
| UL 2580 Endurance Screen | 1.0C Constant Current | 0.05C Constant Voltage | 1.0C Constant Current | 25 +/- 2 deg C | 30 min |
| GB/T 31484 Cycle Life Protocol | 1.0C Constant Current | 0.05C Constant Voltage | 1.0C Constant Current | 25 +/- 2 deg C | 30 min |
Chamber thermal management governs parasitic reaction rates. At 25 degrees Celsius, natural air convection around a cylindrical casing adequately sheds the Joule heating produced by a continuous 0.5C rate. At 1.0C or higher, stagnant chamber air cannot prevent core temperatures from climbing five to eight degrees above ambient.
That internal heat lowers interfacial charge transfer resistance, momentarily raising observed discharge capacity and concealing early degradation. After several hundred cycles, however, the sustained core heat degrades the solid electrolyte interphase and irreversibly consumes cyclable lithium.
The rest periods allowed between half-cycles represent another variable subject to frequent adjustment. Resting after a high-rate charge allows lithium ion concentration gradients across both the liquid electrolyte and the solid particles to relax toward thermodynamic equilibrium. A 30-minute rest lets interfacial overpotentials dissipate entirely, returning the open circuit voltage to true equilibrium before discharge starts.
Cutting rests to two minutes ~ or eliminating them altogether ~ denies electrodes this recovery window, causing lithium ions to accumulate at graphite surfaces until the local potential drops low enough to trigger metallic lithium plating.
Cut-off voltages establish the available operational window and govern mechanical strain inside host lattices. In a standard lithium iron phosphate cell, voltage limits of 3.65V and 2.50V cover the complete two-phase transition between LiFePO4 and FePO4. In high-nickel ternary cells, increasing the upper cut-off from 4.20V to 4.35V extracts roughly twelve percent more initial gravimetric capacity, but at the cost of tripling lattice contraction and microcracking along primary particle boundaries.
Datasheet metrics that omit exact cut-off thresholds obscure the electrochemical sacrifices used to generate the advertised capacity.
A laboratory cycle count holds validity only when bounded by verified cut-off voltages, exact charge taper limits, and continuous core temperature monitoring.
Periodic capacity verification cycles pause continuous endurance testing to evaluate true capacity under low-strain conditions. Protocols routinely insert a check every 50 or 100 cycles, running three full cycles at a slow 0.1C or 0.2C rate with four-hour rests and electrochemical impedance spectroscopy sweeps. These diagnostic intervals clarify whether capacity drop observed during continuous cycling stems from irreversible lithium inventory loss or simply kinetic polarization from rising impedance.
Without reference cycles, raw degradation curves merge reversible polarization overpotentials with permanent active material loss.
Standard factory supply agreements frequently mandate that verification testing follow IEC 61960 profiles at 25 degrees Celsius with a 0.05C taper termination, holding the supplier financially liable for any disputed capacity shortfall exceeding four percent.

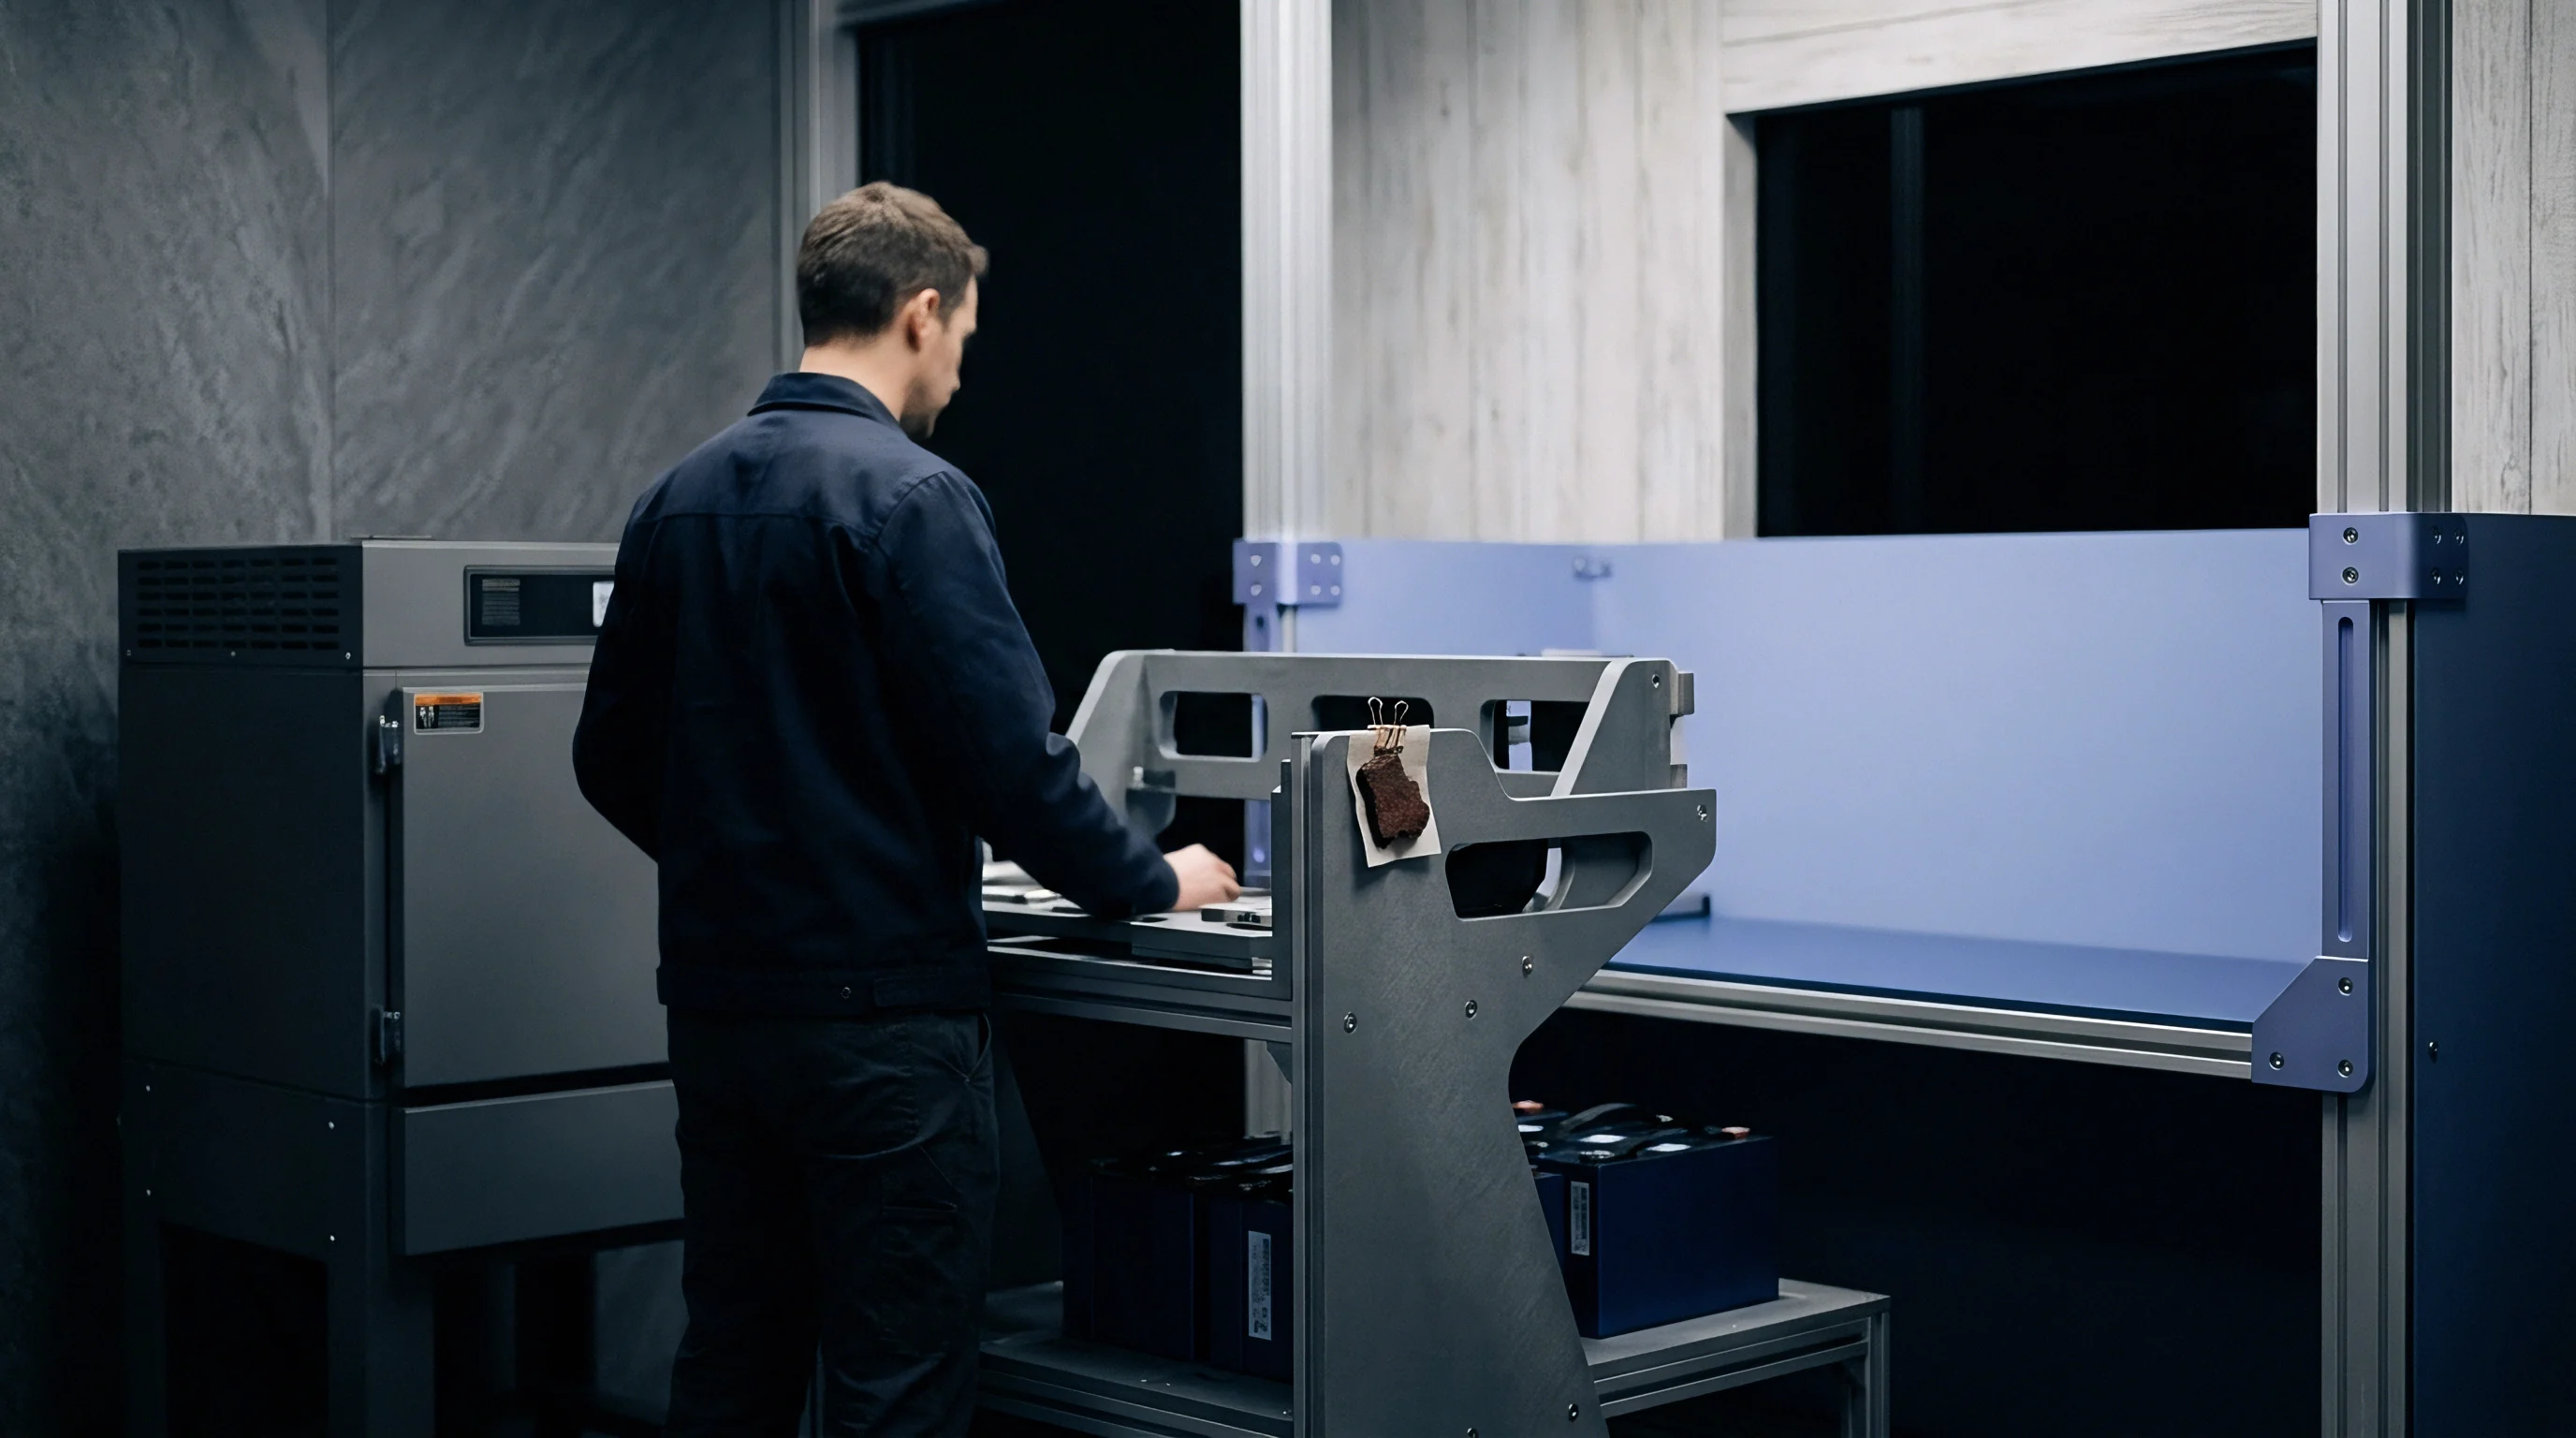
Clamp
Mechanical constraints govern pouch and prismatic cell longevity as directly as C-rate or operating temperature. Cathode and anode active materials expand and contract continuously through lithiation and delithiation. Graphite swells by roughly ten percent when fully lithiated, whereas silicon-doped anodes expand anywhere between 20 and 300 percent depending on silicon content.
Cycling a pouch or prismatic cell without uniform external restraint allows this periodic breathing to cause layer delamination, spotty contact, and localized current crowding that quickly degrades capacity.
Uniform compression ensures continuous contact across active electrode coatings, current collector foils, and the separator. In cylindrical cells such as 18650 or 21700 formats, the drawn steel can provides radial constraint that preserves winding pressure across thousands of cycles. In contrast, pouch cells in flexible aluminum laminate and prismatic cells with thin aluminum walls rely entirely on test fixtures or battery pack structures for mechanical support.
Cycling an unconstrained pouch cell on a laboratory bench triples its capacity fade rate compared to a cell kept under 0.3 megapascals of uniform pressure.

Will Symmetrical Constant Current Cycling Mask Anode Plating?
Symmetrical constant current cycling can hide active lithium plating behind smooth voltage traces until capacity falls off abruptly. When running continuous 1.0C charge and discharge cycles with brief rest steps, the graphite anode experiences negative overpotentials relative to lithium reference during the latter half of the charge phase. In unconstrained or unevenly clamped pouch cells, localized electrode separation increases inter-electrode ionic resistance.
Lithium ions encounter interfacial transport barriers and deposit as metallic dendrites rather than intercalating into the graphite matrix. When switched immediately to discharge, a portion of this plated metal dissolves back into the electrolyte as electrically isolated dead lithium, stripping cyclable lithium while voltage profiles appear completely regular for hundreds of cycles.
Test fixtures used in baseline programs must exert calibrated, verifiable pressure across the entire electrode face. Test facilities rely on two distinct setups: constant displacement fixtures and constant pressure fixtures. A constant displacement fixture employs rigid steel end-plates locked to a fixed distance using precision shims or tie-rods.
As the cell swells during lithiation and ongoing solid electrolyte interphase growth, internal mechanical stress rises exponentially ~ often jumping from an initial 0.2 megapascals to more than 1.5 megapascals by cycle 800. This pressure surge can crush micropores in the separator, choking off ionic transport.
| Clamping Methodology | Initial Set Pressure | Pressure at Cycle 1000 | Primary Mechanical Failure Mode | Cycle Life Impact to 80% Ret. |
|---|---|---|---|---|
| Unclamped / Bare Cell | 0.00 MPa | 0.00 MPa | Interfacial Delamination, Gas Pockets | Baseline reference: 1.00x |
| Rigid Constant Gap Fixture | 0.20 MPa | 1.45 to 1.80 MPa | Separator Pore Collapse, Edge Crushing | 1.85x baseline |
| Spring-Loaded Constant Pressure | 0.30 MPa | 0.32 to 0.35 MPa | Controlled SEI Growth, Minimal Plating | 2.60x baseline |
| Excessive Constant Pressure | 1.00 MPa | 1.00 MPa | Electrolyte Squeeze-out, Binder Shear | 1.30x baseline |
Spring-loaded constant pressure fixtures avoid this uncontrolled stress escalation. Installing calibrated die springs or Belleville washer stacks between the clamping plate and tension nuts lets the hardware accommodate cyclic thickness changes while maintaining pressure within a stable 0.25 to 0.40 megapascal window. Steady compression prevents electrode buckling and keeps electrolyte distributed across the electrode face.
If clamping pressure drops below 0.1 megapascals, interfacial micro-gaps appear, starving local regions of electrolyte and forcing current into adjacent areas where it triggers overcharging.
Pressure distribution mapping frequently reveals severe edge effects in test fixtures. Current collector overhangs and separator folds concentrate stress around the perimeter of stacked or wound sheets. Clamping plates that lack adequate stiffness flex under load, producing elevated pressure along the perimeter and low pressure in the center.
The unsupported center then swells, collects excess electrolyte, and delaminates, while over-compressed margins experience particle fracture and separator thinning. Rigorous baseline protocols require ground steel or heavy aluminum plates machined within 20 micrometers of flatness, verified with pressure-sensitive film before cycling begins.
Electrolyte decomposition during high-potential cycling generates volatile gases like ethylene, carbon dioxide, and trace hydrogen, complicating mechanical control. In unclamped pouch cells, gas pockets lodge between electrode layers, insulating active material and diverting current paths around the bubbles. Adequate clamping drives evolved gases out of the active stack into the perimeter gas pouch, preserving continuous layer-to-layer contact across the working area throughout life testing.
Suppliers routinely attribute early capacity loss to improper fixture clamping during customer testing, contending that unconstrained operation voids the cycle life targets stated on preliminary engineering datasheets.
Telemetry
Every capacity, energy, and efficiency figure produced by a battery cycler depends entirely on the precision of voltage, current, and temperature channels maintained over months of continuous operation. Minor sensor calibration drift compounds over time, introducing substantial errors into calculated cumulative energy and fade rates. Multichannel testing systems require dedicated analog front-ends designed to reject ground loops and eliminate contact resistance artifacts.
Four-wire Kelvin connections are mandatory between cycler channels and cell tabs. In a two-wire setup, heavy current running through the wiring harness creates an ohmic drop across leads, clips, and terminals. At 20A, just 5 milliohms of lead and contact resistance produces a 100 millivolt measurement error.
That offset trips charge and discharge voltage limits early, cutting measured capacity short. A true four-wire Kelvin arrangement routes current through separate heavy-gauge leads while dedicated high-impedance sense lines read true terminal voltage without current-induced offsets.
Analog-to-digital converter resolution and sampling rates determine whether brief electrochemical transients get recorded or lost. Current test channels use 24-bit delta-sigma converters providing 10 microvolts of voltage precision and 100 microamperes of current resolution on primary ranges. Sampling at 100 Hz or 1 kHz is necessary during pulse power characterization, internal resistance measurements, and dynamic vehicle drive cycles.
Routine cycling can log at 1 Hz or on programmed step deltas of voltage, current, or time. Logging too sparsely ~ such as once every 60 seconds ~ introduces cumulative integration errors when calculating ampere-hours and watt-hours across rapid transitions.
Integrating channel current over thousands of hours without periodic zero-point shunt calibration compounds integration drift into false coulombic efficiency data.
Coulombic efficiency ~ the ratio of discharge capacity to charge capacity within a cycle ~ acts as a primary indicator of parasitic chemical activity. Fresh production cells regularly exhibit coulombic efficiency above 0.9995 (99.95 percent). Capturing this accurately requires current shunt stability within +/-0.01 percent across the laboratory temperature envelope.
Thermal drift in the cycler frame alters the calibration of sense amplifiers and shunt resistors. If ambient laboratory temperature varies five degrees Celsius between day and night, uncorrected instrumentation drift introduces artificial daily oscillations into coulombic efficiency logs, masking true lithium loss.
Thermal monitoring demands equal precision in sensor selection and placement. Cylindrical and prismatic cells possess significant thermal mass and anisotropic thermal conductivity: heat transfer through stacked active layers, foil, and separator material is an order of magnitude lower than axial conduction through the aluminum and copper current collectors out to the tabs. A thermocouple simply taped to the center of a steel can registers surface convective temperature rather than core winding conditions.
Robust test procedures mount calibrated thermistors or RTDs directly to the negative terminal and the casing center using thermally conductive epoxy, insulated from chamber convection by foam backing.
Multi-month cycling runs also encounter timing errors caused by asynchronous channel polling and system clock drift. Cycler operating software managing hundreds of parallel channels across server racks can introduce timestamp jitter into data logs. A 200-millisecond timestamp skew during a high-rate current step invalidates internal resistance calculations, which require precise voltage readings at exact intervals of 100 milliseconds, 1 second, or 10 seconds post-pulse.
Omitting four-wire Kelvin sensing or skipping periodic calibration cycles leads to false lot rejections or unearned approvals, exposing battery pack integrators to substantial warranty risk when production cells fail hundreds of cycles earlier in the field than laboratory records predicted.

Extrapolation
Running lithium cells down to 80 or 70 percent capacity retention under baseline lab regimes requires anywhere from six months to two years of continuous testing. Commercial product programs rarely accommodate those timelines before freezing designs and executing supply agreements. Instead, engineering teams rely on analytical modeling, accelerated environmental stress, and differential signal analysis to project operational life from the first 200 to 500 cycles of test data.
Lithium-ion cell aging follows non-linear dynamics characterized by two distinct phases: an initial square-root-of-time capacity loss driven by steady solid electrolyte interphase growth, followed by a transition into rapid decay known as the capacity knee-point. Linear extrapolation of early cycling trends consistently overstates operational lifespan by missing this turning point. The knee occurs when cyclable lithium inventory falls low enough that the anode can no longer accept charge without severe lithium plating, or when cathode cracking triggers accelerated electrolyte consumption and impedance growth.
Differential capacity (dQ/dV) and differential voltage (dV/dQ) analyses convert standard voltage-capacity profiles into distinct thermodynamic peaks, exposing active degradation mechanisms without tearing cells down. Calculating the derivative of capacity with respect to voltage during slow 0.05C or 0.1C diagnostic sweeps reveals peaks linked directly to phase changes within cathode and anode crystal structures. Monitoring peak shifts, height reductions, and area changes over time enables engineers to separate three distinct degradation pathways: loss of lithium inventory, loss of active anode material, and loss of active cathode material.
| Diagnostic Analytical Method | Required Cycling Data Quality | Primary Mathematical Operation | Identified Degradation Mode |
|---|---|---|---|
| Differential Capacity (dQ/dV) | High precision, ultra-low noise (<10uV) | First derivative dQ/dV vs Voltage | Phase change shifts, Lithium inventory loss |
| Differential Voltage (dV/dQ) | Continuous low-rate reference cycles | First derivative dV/dQ vs Capacity | Electrode stoichiometry slippage, Active mass loss |
| Electrochemical Impedance (EIS) | AC perturbation across 10mHz to 100kHz | Complex plane Nyquist fitting | Ohmic, SEI film, and charge transfer resistance growth |
| Pulse Resistance Step (DCIR) | Standard 1C or 2C current pulses | Delta V / Delta I at fixed time stamps | Bulk overpotential growth, transport limitation |
Differential capacity traces serve as an early indicator of impending knee-points. Over repeated cycling, the voltage gap between major graphite staging peaks and cathode redox features expands as internal cell resistance rises. Concurrently, the integrated area under high-voltage peaks diminishes as active lithium becomes permanently bound inside solid electrolyte interphase compounds.
Once the stage 1 graphite intercalation peak migrates past a critical potential boundary, rapid non-linear capacity drop generally follows within 150 to 300 cycles.
Arrhenius modeling accelerates parasitic chemical aging by cycling test cells at elevated temperatures of 35, 45, and 55 degrees Celsius. The Arrhenius relationship scales chemical reaction rates against absolute temperature, relying on activation energies that typically sit between 30 and 50 kilojoules per mole for carbonate solvent systems on graphite. While moderate thermal exposure accelerates baseline film growth, pushing tests past 50 degrees Celsius induces secondary LiPF6 salt breakdown, dissolves polyvinylidene fluoride binder, and triggers heavy transition metal leaching from NMC cathodes.
Because these failure modes remain absent at 25 degrees Celsius, high-temperature extrapolation fails whenever testing exceeds the thermodynamic stability limits of cell components.
Semi-empirical physical models combine square-root diffusion equations with mechanical fatigue mechanics to account for active particle fracture over time. Multi-parameter numerical fits can extrapolate 300 cycles of baseline data out to 3,000 cycles, provided diagnostic reference cycles confirm that aging remains inside the diffusion-limited regime. If direct current internal resistance begins rising exponentially rather than following a linear path, binder mechanical failure or electrolyte dry-out has started, rendering diffusion-based models invalid.
Machine learning models trained on early-cycle telemetry ~ such as variance in discharge voltage profiles between cycles 10 and 100 ~ provide an alternative forecasting method. These architectures associate minute curve variations with total operational life, achieving under ten percent prediction error across tightly controlled cell batches. However, model accuracy degrades rapidly when encountering altered cell chemistries, different electrode balance ratios, or modified mechanical compression.
Whether early telemetry can ever reliably predict non-linear knee-points for uncharacterized electrode formulations remains an open question in battery electrochemistry.

Variance
A single cycle life curve on a marketing datasheet represents an exceptional production sample, not the statistical distribution of a factory run. Properly assessing a cell design requires testing multi-cell lots to quantify cell-to-cell spread in capacity loss, impedance rise, and wear-out limits. Manufacturing variations in electrode coating weight, slurry homogeneity, separator registration, and electrolyte fill volume generate measurable performance variance across every production run.
Statistical lifetime distributions for lithium-ion cells follow Weibull functions rather than standard normal distributions. The two-parameter Weibull formulation uses a characteristic life parameter (the cycle milestone where 63.2 percent of the cohort has reached end of life) and a shape parameter describing the failure mechanism. A shape value greater than one signifies typical wear-out aging of active materials, whereas a value below one highlights premature infant mortality caused by defects like collector foil burrs, tab welding splatter, or particulate contamination inside the winding.
Testing small sample lots of three or five cells leaves an excessively wide confidence interval on projected mean cycle life. Five cells tested under identical 1.0C baseline conditions might hit 80 percent retention at 1850, 1920, 1940, 2010, and 2200 cycles. The resulting arithmetic average is 1984 cycles, but the calculated B10 life ~ the threshold at which ten percent of the cohort fails ~ is considerably lower.
For grid-scale or mission-critical battery systems, technical specifications must reference B10 or B2 reliability metrics rather than simple mean life to prevent premature pack imbalance.
The sequence of operational steps for qualifying statistical cell variance across incoming production lots follows a strict verification procedure:
- Lot sampling selection pulls thirty random finished cells from three separate production batches using ISO 2859-1 sampling plans to avoid single-lot bias.
- Initial baseline characterization records open circuit voltage, 1 kHz alternating current internal resistance, direct current pulse resistance, and weight to establish pre-test values for every cell.
- Formation stabilization cycles runs three continuous 0.2C reference cycles at 25 degrees Celsius to confirm samples have finished primary formation and achieved stable coulombic efficiency above 99.8 percent.
- Environmental chamber allocation splits the sample set across multiple thermal chambers so local hot-spots or temperature drifts cannot bias specific groups.
- Automated continuous cycling runs all channels on identical constant current constant voltage regimes, with diagnostic reference checks scheduled every 100 cycles.
- Weibull distribution fitting plots 80 percent retention milestones on probability axes to derive the shape parameter alongside verified B10 and B50 life figures.
| Batch Designation | Sample Size (n) | Mean Cycles to 80% | Standard Deviation | Calculated B10 Life | Weibull Shape (Beta) |
|---|---|---|---|---|---|
| NMC 811 Cylindrical 21700 | 30 cells | 1,420 cycles | 115 cycles | 1,265 cycles | 13.8 (Wear-out) |
| NMC 622 Prismatic 50Ah | 24 cells | 2,150 cycles | 180 cycles | 1,910 cycles | 12.4 (Wear-out) |
| LFP Pouch 20Ah (Clamped) | 30 cells | 3,450 cycles | 140 cycles | 3,260 cycles | 26.1 (Tight Process) |
| LFP Prismatic 100Ah | 20 cells | 4,100 cycles | 390 cycles | 3,580 cycles | 10.9 (Moderate Var.) |
| LCO Pouch (Consumer Grade) | 15 cells | 580 cycles | 85 cycles | 465 cycles | 7.2 (High Variance) |
Impedance divergence over operational life accelerates capacity spread. Initial DC internal resistance may vary by only +/-3 percent across a fresh lot, but that variance widens with sustained cycling. A cell starting with slightly higher internal resistance generates more Joule heating on every cycle.
Elevated core temperatures accelerate growth of the solid electrolyte interphase, which in turn drives up resistance. In series strings without active balancing, this divergence quickly forces the lowest-capacity cell into over-discharge, triggering an early string-level low-voltage cut-off.
In cell screening, a common rule of thumb applies: any lot with initial resistance variation over five percent will double its capacity degradation spread before reaching half its rated cycle life.

Procurement
Translating laboratory performance metrics into commercial supply agreements requires linking engineering claims to clear financial accountability. A datasheet advertising 3,000 cycles provides little protection unless the purchase contract explicitly ties that rating to an agreed test regime, a lot sampling protocol, and defined liquidated damages for non-conformance. Sourcing cells solely against unverified vendor specification sheets leaves the buyer carrying the financial burden of field failures and warranty claims.
Procurement contracts routinely establish baseline endurance testing as a mandatory quality gate. Prior to approving volume production, the buyer reserves the right to pull random cells from pilot manufacturing runs and place them on long-term cycling channels at a certified independent test lab. Contracts incorporate stage-gate milestones: reaching 500 cycles with at least 95 percent capacity retention and under 15 percent DC internal resistance growth might release scheduled tooling disbursements or authorize full production runs.
If test samples fail to meet these interim gates, the agreement permits the buyer to halt manufacturing, withhold milestone payments, and mandate root-cause factory audits funded entirely by the supplier.
Total levelized cost per delivered kilowatt-hour over operating life remains the primary metric for comparing suppliers and chemistries. A cell with a cheaper upfront price per nominal kilowatt-hour frequently ends up more expensive in operation if its field cycle retention falls below laboratory claims. Calculating total cumulative energy throughput gives engineering and commercial teams a true measure of life-cycle asset value.
Take a utility storage evaluation comparing two cells for a 10 megawatt-hour installation: Option A is an entry-tier 3.2V 280Ah Lithium Iron Phosphate prismatic cell priced at 62 dollars per kilowatt-hour, claiming 4,000 cycles to 80 percent retention under 0.5C baseline conditions. Option B is a premium 3.2V 280Ah Lithium Iron Phosphate prismatic cell at 78 dollars per kilowatt-hour, claiming 6,000 cycles to 80 percent retention under identical conditions. Both run at a 90 percent daily depth of discharge.
For a single 280Ah cell (0.896 kWh nominal capacity) operating at 90 percent depth of discharge with 92 percent average round-trip efficiency, total delivered energy breaks down clearly. Option A delivers an average of 0.726 kilowatt-hours per cycle over 4,000 cycles, producing 2,904 kilowatt-hours of cumulative lifetime energy. Dividing the cell price of 55.55 dollars (0.896 kWh at 62 dollars per kWh) by 2,904 kilowatt-hours gives a capital cost of 0.0191 dollars per delivered kilowatt-hour.
Option B delivers an average of 0.726 kilowatt-hours per cycle over 6,000 cycles, yielding 4,356 kilowatt-hours total. Dividing its price of 69.89 dollars (0.896 kWh at 78 dollars per kWh) by 4,356 kilowatt-hours results in 0.0160 dollars per delivered kilowatt-hour. Despite a 25.8 percent higher purchase price, Option B offers a 16.2 percent lower levelized cost per delivered unit of energy.
If Option A fails independent lab tests and drops to 80 percent retention at cycle 2,600 ~ due to inadequate clamping or slurry purity issues ~ its levelized cost rises to 0.0294 dollars per delivered kilowatt-hour, ruining the project’s financial return. Purchase contracts need explicit capacity retention curves backed by tiered remedies. If field or audit samples drop below agreed curves, warranty clauses should trigger automatic rebates or cell replacements tied directly to the lost energy yield.
Sourcing teams protect their investments by building detailed technical annexes into master supply agreements. These annexes specify the exact cycler model, channel accuracy, four-wire Kelvin setup, fixture pressure tolerances, chamber temperature bands, rest periods, voltage limits, and reference cycle protocols that will serve as the sole technical standard in any warranty dispute.