Differential Capacity Analysis Procedures for Early Degradation Detection in Cells
Differential capacity analysis detects cell degradation early by tracking microvolt phase shifts and peak areas under low C-rate charging.

Signals
Differential capacity analysis converts standard voltage-capacity charging curves into differential derivatives that expose discrete electrochemical phase transitions inside lithium-ion cells. Plotting dQ/dV against cell potential transforms broad, subtle voltage plateaus into sharp, quantifiable peaks. Each peak corresponds to a specific thermodynamic equilibrium state during lithium intercalation or deintercalation within the positive and negative electrode crystallographic lattices.
Tracking shifts in peak position, peak height, and peak area over cycle life reveals individual degradation mechanisms long before gross capacity loss manifests on standard discharge tests.
In graphite electrodes, discrete derivative peaks align with phase changes, marking the sequential phase transitions between stage four, stage three, stage two, and stage one fully intercalated lithium compounds. Layered transition metal oxide cathodes, such as nickel manganese cobalt oxide and lithium iron phosphate, present distinct phase boundaries that shift as structural degradation occurs. During cycling, three primary aging phenomena degrade performance: loss of lithium inventory, loss of active material at the positive electrode, and loss of active material at the negative electrode.
Kinetic degradation also arises from impedance growth and elevated internal charge-transfer resistance.
Loss of lithium inventory dominates early fade. This mechanism consumes mobile lithium ions through ongoing solid electrolyte interphase layer growth, side reactions, or localized lithium plating without destroying electrode host structures. In dQ/dV differential capacity curves, loss of lithium inventory alters the relative alignment of cathode and anode capacity windows.
The entire differential voltage spectrum shifts along the potential axis, altering specific peak areas while leaving individual electrode structural peak capacities intact. When transition metal dissolution, particle cracking, or binder degradation isolates portions of the cathode or anode, active material loss reduces peak height, causing the absolute area under the differential peaks associated with that electrode to shrink proportionally.
Differential capacity peaks resolve phase changes clearly when charging rates stay below C/20 at ambient temperature.
Operating test channels at ultra-low charge rates isolates thermodynamic potential from kinetic polarization. At high C-rates, cell internal resistance causes ohmic voltage drops and concentration polarization that smear derivative features, blending distinct phase transition peaks into indistinguishable humps. Testing between C/20 and C/50 provides the kinetic equilibrium required to resolve subtle phase features.
Lower C-rates yield sharper peaks, making it easier to separate overlapping thermodynamic signatures.
| Observed Peak Anomaly | Electrochemical Phase Marker | Primary Degradation Mechanism | Diagnostic Impact |
|---|---|---|---|
| Voltage axis shift in high-voltage peak | Graphite stage-one deintercalation | Loss of lithium inventory | Identifies continuous solid electrolyte interphase growth and parasitic side reactions. |
| Height reduction in positive electrode peak | Nickel redox phase transition | Loss of active positive material | Quantifies structural cathode degradation and transition metal dissolution rates. |
| Width expansion across all derivative peaks | Full-cell charge transfer boundary | Impedance and overpotential growth | Measures film resistance rise and electrolyte conductivity loss across cell terminals. |
| Peak area shrinkage without voltage drift | Graphite stage-two intercalation | Loss of active negative material | Detects anode particle isolation, exfoliation, or structural delamination. |
| Data obtained from constant-current charging sweeps conducted at C/50 rate under isothermal conditions at 25 degrees Celsius. | |||
Cathode phase transitions dictate high-voltage peaks. Nickel-rich chemistries display pronounced differential features near 3.8 V and 4.2 V, corresponding to hex-to-monoclinic and monoclinic-to-hexagonal phase changes. Phase transition stability directly governs long-term structural integrity in high-energy pouch and cylindrical formats.
Charging below the electrochemical phase relaxation threshold ensures that voltage translation accurately mirrors structural thermodynamic changes rather than transient kinetic polarization.

Bench
Measuring microvolt-level potential differences during low C-rate cycling places extreme demands on test channel hardware, voltage resolution, and environmental controls. Commercial cyclers designed for standard lot pass-fail tests lack the precision needed for differential capacity computation. Differentiation mathematically amplifies raw measurement noise.
High-frequency voltage noise, current ripple, and analog-to-digital converter quantization steps create large artificial spikes in dQ/dV curves that mask true phase transition peaks.
Temperature stability controls measurement resolution. Isothermal conditions remain imperative throughout the multi-hour low C-rate charging process. An ambient temperature drift of one degree Celsius alters cell open-circuit voltage by hundreds of microvolts due to electrode entropic coefficients.
Thermal fluctuations introduce slope inversions and false peaks into derivative data. Thermal chambers must hold internal ambient variation within plus or minus 0.1 degrees Celsius over thirty-hour test runs. Pouch cell formats require uniform clamping.
Applying constant mechanical pressure prevents localized electrode expansion, maintaining consistent contact resistance and uniform current density across the electrode stack.
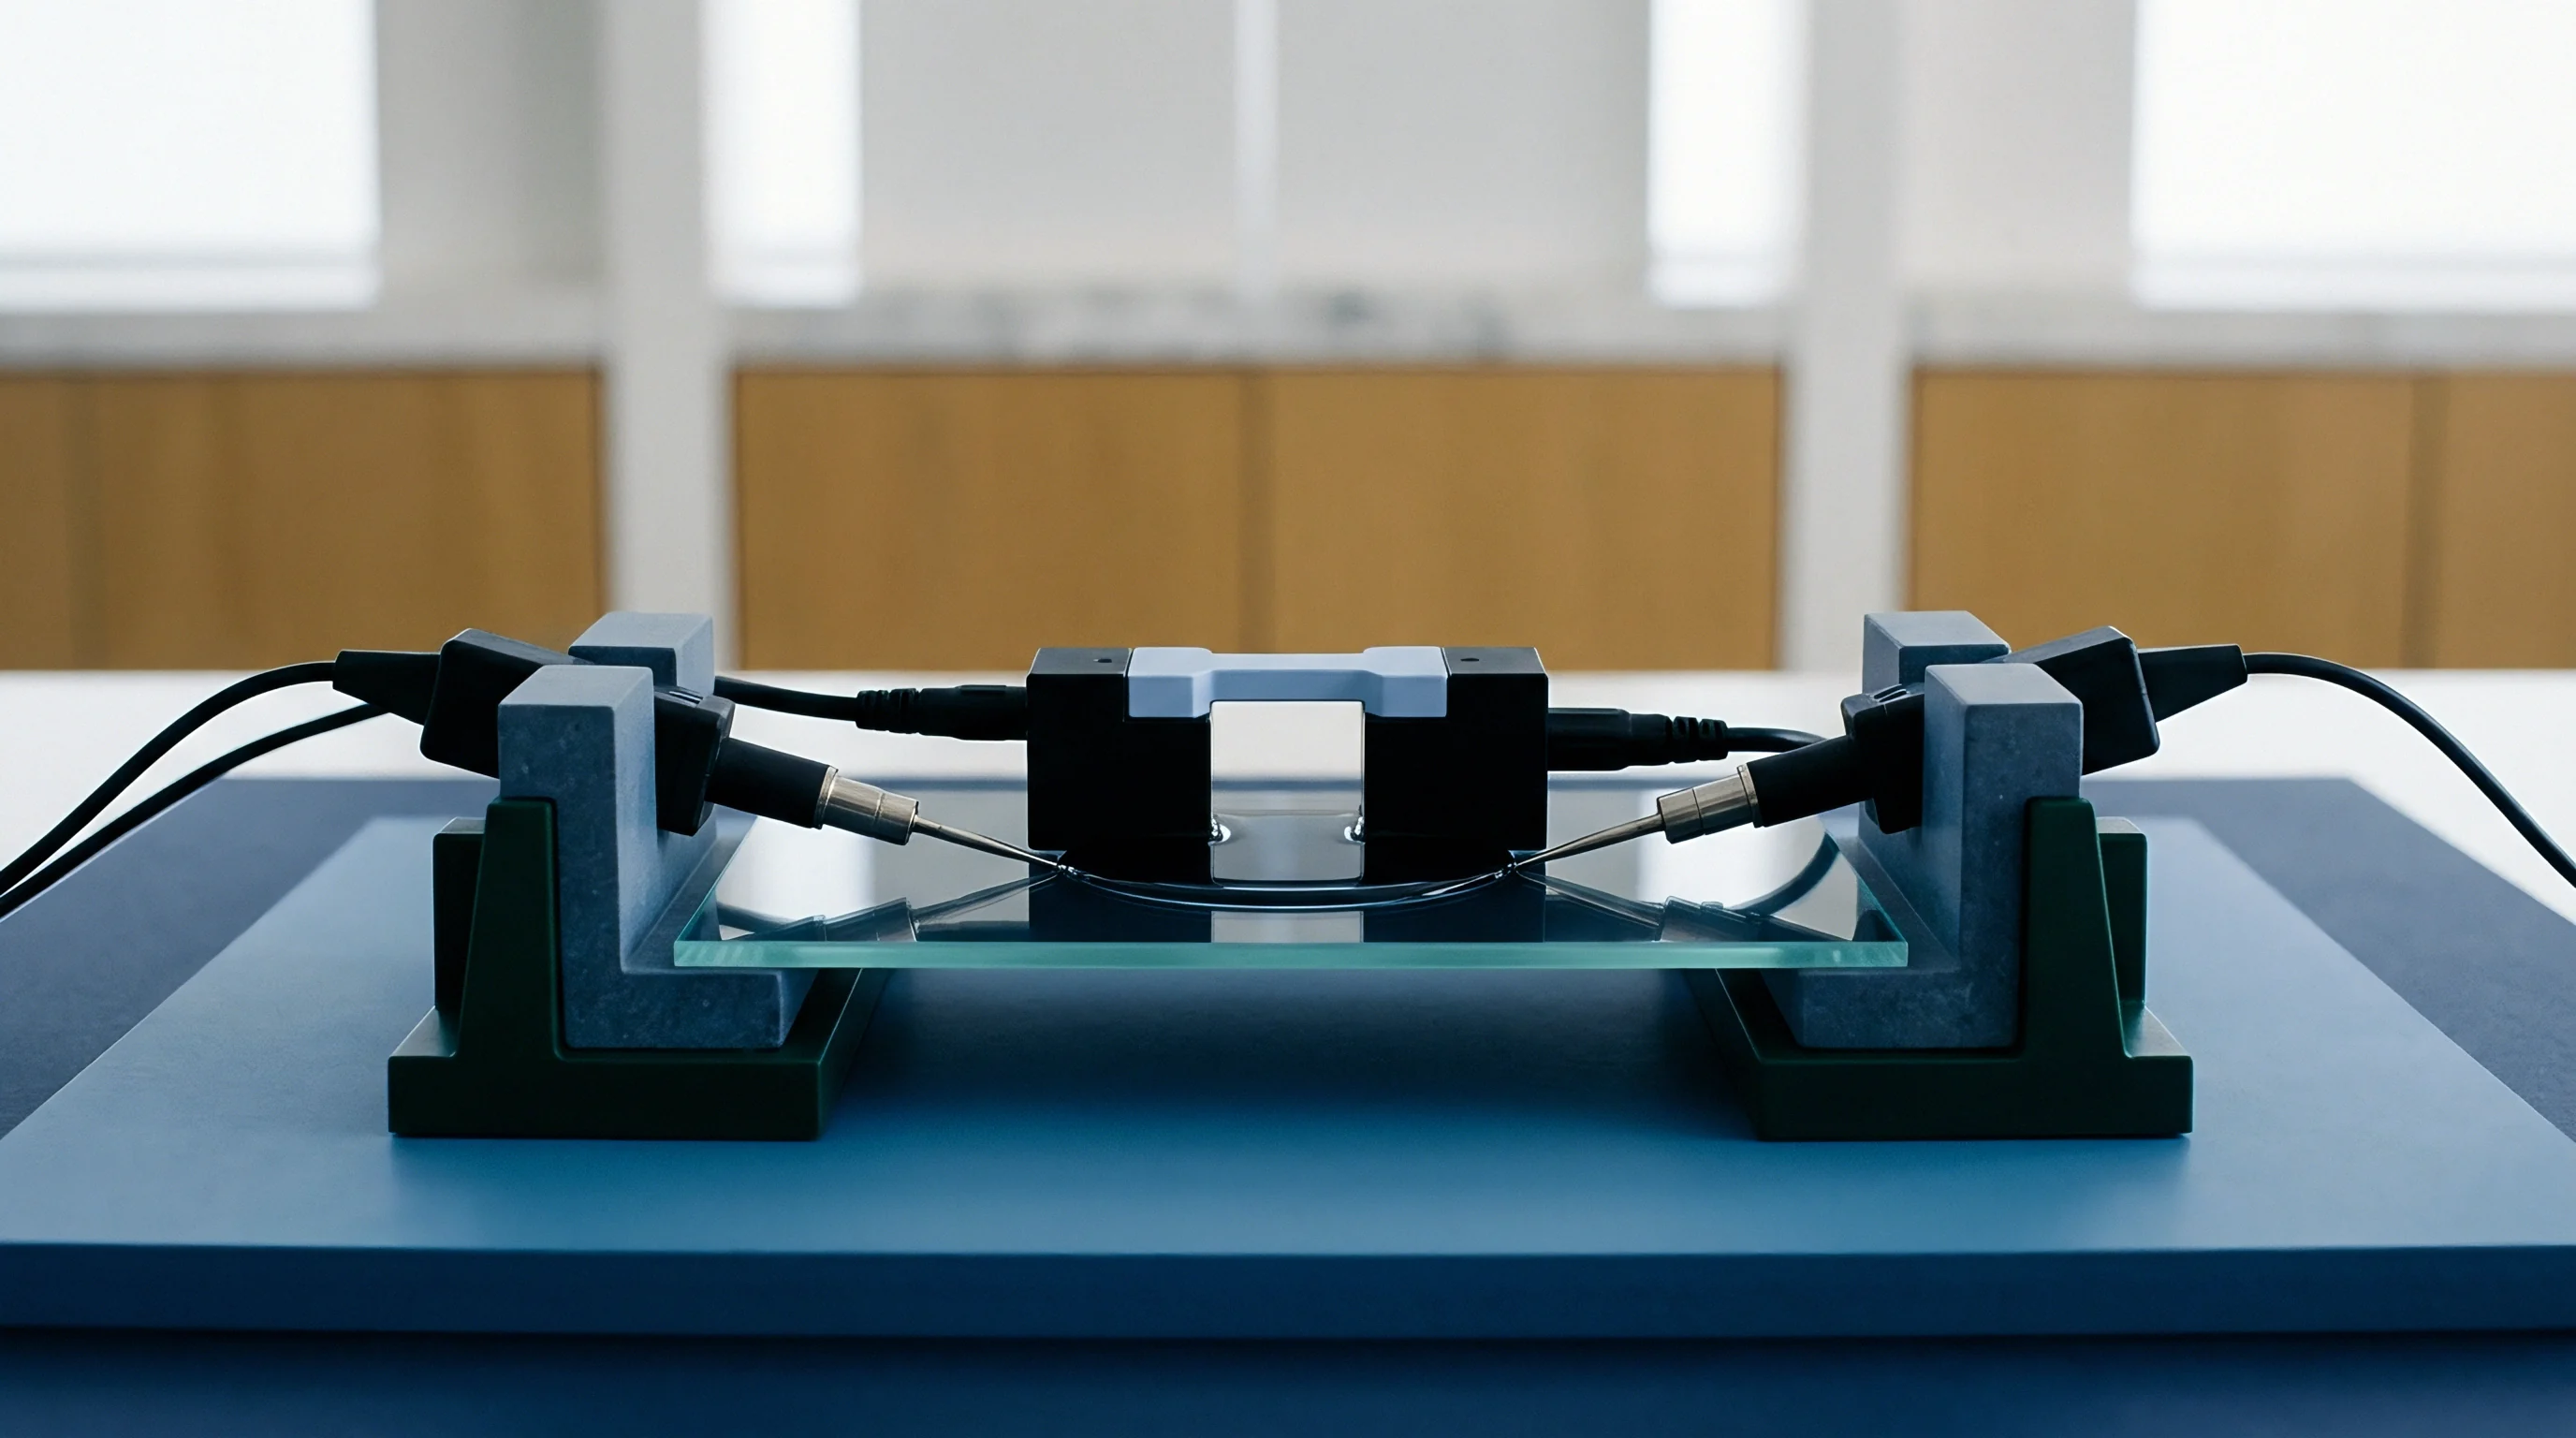
Instrumentation for reliable differential capacity extraction requires systematic installation and baseline verification. The setup sequence establishes high-fidelity signal acquisition across multi-channel test channels.
- Thermal soak the test unit inside an environmental chamber at 25 degrees Celsius for four hours to eliminate internal thermal gradients.
- Connect four-wire Kelvin sensing leads directly to the cell tabs to eliminate lead wire resistance drops and contact impedance errors.
- Execute a reference conditioning cycle at C/20 rate to confirm full capacity limits and calibrate lower cutoff voltages.
- Apply continuous constant-current charging at C/50 rate while logging voltage and current data at intervals no greater than five seconds.
- Verify channel current stability using an external precision shunt meter to confirm current drift stays below fifty parts per million.
Data logging frequency dictates derivative precision. Fixed-time data logging creates non-uniform potential intervals during steep voltage transitions, resulting in unstable differential calculations. Combining fixed-voltage-step logging with continuous time tracking yields uniform voltage delta steps.
Setting voltage step thresholds between 0.5 mV and 1.0 mV prevents numerical instability without oversampling flat plateau regions.
Voltage logger resolution below one hundred microvolts at C/50 charge rate prevents mathematical discretization noise from obscuring minor phase transition peaks.
Contact resistance creates voltage measurement distortion. Slight oxidation on test fixtures introduces variable series resistance during extended low-rate cycling. Utilizing gold-plated sensing pins and enforcing four-wire Kelvin lead connections isolates the measurement circuit from current delivery paths.
Inadequate thermal control during low C-rate cycling introduces artificial potential oscillations that falsely indicate electrode active material loss, leading to the wrongful rejection of healthy cell lots.


Smoothing
Raw differential capacity curves calculated from discrete numerical differentiation exhibit severe high-frequency noise amplified by voltage measurement quantization step sizes. Direct point-to-point differentiation produces unacceptable signal scatter, rendering automated peak identification algorithms ineffective. Data smoothing algorithms must suppress high-frequency hardware noise while preserving true peak height, width, and voltage position.
Over-filtering distorts peak shapes, flattening narrow derivative features and shifting apparent peak potentials. Under-filtering leaves residual derivative noise spikes that trigger false peak detections.

Mathematical Signal Filtering Techniques
Savitzky-Golay filtering fits local low-degree polynomials to adjacent data points using linear least squares. This technique preserves higher-order derivative moments better than standard moving average filters, maintaining natural peak height and area. Polynomial degree and frame length govern filter response.
A second-order polynomial paired with a frame length spanning 20 mV to 30 mV provides optimal smoothing for typical nickel-rich layered oxide cells. Moving average filters attenuate high-frequency noise but systematically depress sharp differential peak maxima. B-spline smoothing replaces discrete point fitting with piecewise continuous mathematical functions, generating smooth derivative curves across wide state of charge ranges.

How Does Window Size Distort Early Peak Degradation?
Selecting filter frame lengths requires balancing noise attenuation against feature distortion. Extending the voltage window suppresses measurement ripple, but excessively wide windows obscure early structural degradation markers. When window width exceeds the intrinsic half-width of a phase transition peak, the filter artificially lowers peak amplitude and broadens peak footprint.
Filtering alters differential peak area calculation, creating distortion that mimics true active material loss and confuses diagnostic algorithms. Testing multiple window sizes on baseline reference cycles identifies the maximum frame length that maintains peak height within 0.5 percent of unsmoothed theoretical values.
Gaussian process regression offers a non-parametric alternative to polynomial windowing. Fitting raw charge voltage data with Gaussian process models yields analytical derivatives, eliminating discrete numerical differentiation steps. This approach generates reliable confidence intervals around calculated dQ/dV curves, allowing automated quality control systems to distinguish genuine electrochemical shifts from statistical measurement noise.
Minor derivative peak broadenings can stem entirely from data filter window artifacts rather than genuine degradation of the positive electrode material.


Deconvolution
Quantitative health diagnostics separate overlapping derivative peaks into individual electrode contributions through half-cell potential curve fitting or peak tracking algorithms. Full-cell differential capacity curves reflect the mathematical difference between positive and negative electrode potential functions. Isolating individual peak behavior allows engineers to assign capacity loss to specific physical degradation modes rather than tracking generic performance decay.

Worked Example of Quantitative Peak Tracking
Evaluating an industrial 50 Ah NMC811/graphite pouch cell after 300 equivalent full cycles illustrates the deconvolution workflow. Baseline reference measurements gathered at C/50 and 25 degrees Celsius establish initial peak parameters across three major charge features. Peak 1 sits at 3.650 V with an area of 12.5 Ah, representing initial graphite staging and cathode phase alignment.
Peak 2 appears at 3.880 V with an area of 22.0 Ah, tracking the main nickel oxidation transition. Peak 3 centers at 4.150 V with an area of 11.2 Ah, corresponding to high-voltage crystal phase transformation.
Following 300 cycles, the aged cell demonstrates a total capacity drop from 50.0 Ah to 46.2 Ah, representing a 7.6 percent bulk capacity loss. Post-processing the differential capacity curve reveals non-uniform peak evolution across the voltage spectrum:
Peak 1 shifts from 3.650 V to 3.664 V while its area decreases from 12.5 Ah to 11.0 Ah. This 1.5 Ah reduction indicates loss of active negative material at low state of charge. Peak 2 shifts upward from 3.880 V to 3.898 V, exhibiting an 18 mV kinetic overpotential displacement caused by internal resistance rise. The area of Peak 2 shrinks from 22.0 Ah to 20.8 Ah, reflecting a 1.2 Ah cathode active material loss.
Peak 3 maintains its relative potential position at 4.150 V, but its area contracts from 11.2 Ah to 9.1 Ah. This 2.1 Ah reduction signals mobile lithium inventory loss, which forces the positive electrode to operate at higher relative states of charge during full cell completion.
Summing the isolated individual contributions accounts for the observed total fade. Lithium inventory loss contributes 2.1 Ah, cathode material isolation contributes 1.2 Ah, and anode active material loss contributes 0.5 Ah in the active cell operating window. The combined loss equals 3.8 Ah, matching the measured total capacity fade.
Quantitative peak deconvolution establishes that lithium inventory loss drives 55 percent of early cycle fade, while cathode structural decay accounts for 32 percent.
Standard qualification frameworks that mandate dQ/dV tracking catch structural degradation prior to measurable total capacity drop.
Calculated peak area metrics provide actionable parameters for battery aging models. Mathematical deconvolution algorithms fit measured curves using reference half-cell potential profiles, adjusting relative stoichiometry values until model outputs align with full-cell derivative shapes. The precise point where local graphite stage-transition peak shifts transition from reversible lithium trapping to irreversible structural particle cracking remains a matter of active investigation across industrial laboratories.

Sampling
Early degradation metrics derived from differential capacity measurements allow cell buyers to audit incoming lot quality long before standard cycle-life testing yields visible capacity fade. Industrial production schedules cannot accommodate 50-hour diagnostic cycles for every manufactured lot. Sourcing practices require accelerated diagnostic regimes that extract differential features at higher C-rates or across targeted partial voltage windows during standard factory acceptance testing.
Higher rates broaden voltage derivative features. Increasing charge rates from C/50 to C/10 shifts peak potentials upward and reduces peak sharpness, but primary phase transition features remain resolvable through baseline subtraction algorithms. Testing cells at C/10 reduces diagnostic duration from fifty hours to ten hours per unit, making differential capacity screening commercially viable for batch sampling.
Utilizing targeted voltage sweeps between 3.6 V and 3.9 V further compresses test times, capturing key nickel-oxide phase transitions without completing full charge-discharge cycles.
| C-Rate Selection | Diagnostic Test Duration | Peak Potential Shift | Feature Resolution Efficiency | Factory Floor Application |
|---|---|---|---|---|
| C/50 | 50 Hours | Under 2 mV | 98 Percent Peak Sharpness | Golden master cell baseline qualification and failure analysis. |
| C/20 | 20 Hours | 3 mV to 5 mV | 88 Percent Peak Sharpness | Incoming batch sample audits and chemistry design validation. |
| C/10 | 10 Hours | 8 mV to 12 mV | 72 Percent Peak Sharpness | High-throughput incoming inspection and line quality control. |
| C/5 | 5 Hours | 18 mV to 25 mV | 45 Percent Peak Sharpness | Fast screening for gross electrode manufacturing defects. |
Batch quality audits evaluate differential capacity consistency across statistical cell samples. Variance in derivative peak height across a production lot indicates manufacturing inconsistencies, such as uneven electrode coating thickness, inconsistent slurry mixing, or non-uniform electrolyte wetting. Identifying high derivative peak variance during initial receiving inspection prevents defective cell lots from entering pack manufacturing streams.
- Initial formation peak variance serves as a baseline indicator for electrolyte consumption during solid electrolyte interphase buildup.
- Graphite staging peak displacement flags negative electrode overhang misalignment and local state of charge imbalance.
- High-voltage nickel transition attenuation identifies early transition metal dissolution and crystal structure degradation in layered oxides.
- Differential voltage slope expansion measures internal resistance growth across tabs and inter-cell welding joints.
Fast differential capacity screening at C/10 captures kinetic aging trends months before bulk discharge capacity tests register cell degradation.
Coulombic efficiency metrics supplement capacity tracking. Combining C/10 differential capacity feature extraction with high-precision coulombic efficiency measurements yields comprehensive quality profiles within twenty-four hours of cell delivery. Incorporating an explicit dQ/dV peak alignment tolerance into incoming procurement specifications forces cell vendors to replace batches exhibiting anomalous kinetic aging without requiring six months of destructive cycle life validation.

Telemetry
Field battery management systems capture dynamic operational voltage and current data during partial opportunistic charge cycles to compute differential capacity metrics onboard. Cloud-connected battery management systems transmit raw charge vectors to remote analytics platforms, executing automated signal filtering and peak deconvolution across commercial fleet assets. Real-time differential capacity analysis transforms reactive battery maintenance into proactive degradation management, identifying outlier cells before module failure occurs.
Field operating conditions present non-ideal charge profiles. Electric vehicles and stationary energy storage systems rarely undergo full constant-current charges from zero to one hundred percent state of charge at constant temperatures. Embedded algorithms must reconstruct partial dQ/dV curves from fragmented charging events occurring between random state of charge limits.
Reorganizing sparse voltage-time data into sorted potential bins enables derivative extraction from variable field charge sessions.
Onboard diagnostic execution requires strict criteria to maintain analytical accuracy under dynamic operating regimes.
- Sampling frequency threshold selection determines whether onboard analog measurement hardware can capture dynamic voltage inflection points.
- Charge window filtering criteria ensure that differential calculations execute only during stable continuous charging periods.
- Reference curve calibration interval prevents false diagnostic alarms caused by normal operational impedance growth over temperature cycles.
Detecting accelerated aging signatures in field data enables automated risk mitigation. A sudden leftward shift in graphite stage-transition peaks indicates rapid lithium inventory depletion, pointing to active lithium plating or severe solid electrolyte interphase growth. When cloud algorithms detect anomalous dQ/dV peak tracking trajectories in specific pack modules, the battery management system automatically adjusts maximum charging current limits, lowers upper cutoff voltages, or requests scheduled maintenance inspections.
Algorithm implementations that combine sparse field dQ/dV peak tracking with periodic offline reference sweeps provide asset managers with early degradation warnings while remaining within the processing bounds of standard automotive microcontroller units.