Quantifying Transient Resistance Measurement Errors Driven by Data Acquisition Delay
Data acquisition delay inflates cell transient resistance measurements by capturing double-layer charging decay rather than pure ohmic voltage drops.

Lag
Automated battery test channels apply square-wave current pulses to evaluate cell impedance, yet physical measurement hardware records voltage responses through analog signal conditioning networks, multiplexers, and digital filters. When a cell receives a ten-ampere current injection, the terminal voltage drops instantly due to ohmic resistance before transitioning into a time-dependent exponential decay governed by charge transfer and diffusion kinetics. Current pulse edges trigger measurements.
If the data acquisition circuit introduces a timing delay between the current command and the voltage sampling event, the logged voltage value captures a portion of the electrochemical polarization transient rather than the pure ohmic response.
Analog low-pass filtering before the analog-to-digital converter introduces phase delay, while software-based channel polling in multi-channel cyclers creates variable temporal offsets ranging from tens of microseconds to hundreds of milliseconds. In high-power lithium-ion cell characterization, where internal ohmic resistance (R0) typically ranges between 0.2 milliohms and 2.0 milliohms, an uncompensated logging offset of 500 microseconds causes significant distortion. The logged voltage drop incorporates early-stage double-layer charging, artificially elevating the calculated internal resistance.
Cell resistance governs pack thermal limits. When test procedures rely on delayed data logging, baseline resistance values reported in qualification dossiers deviate substantially from actual physical cell properties.

Current Step Execution and Sampling Alignment
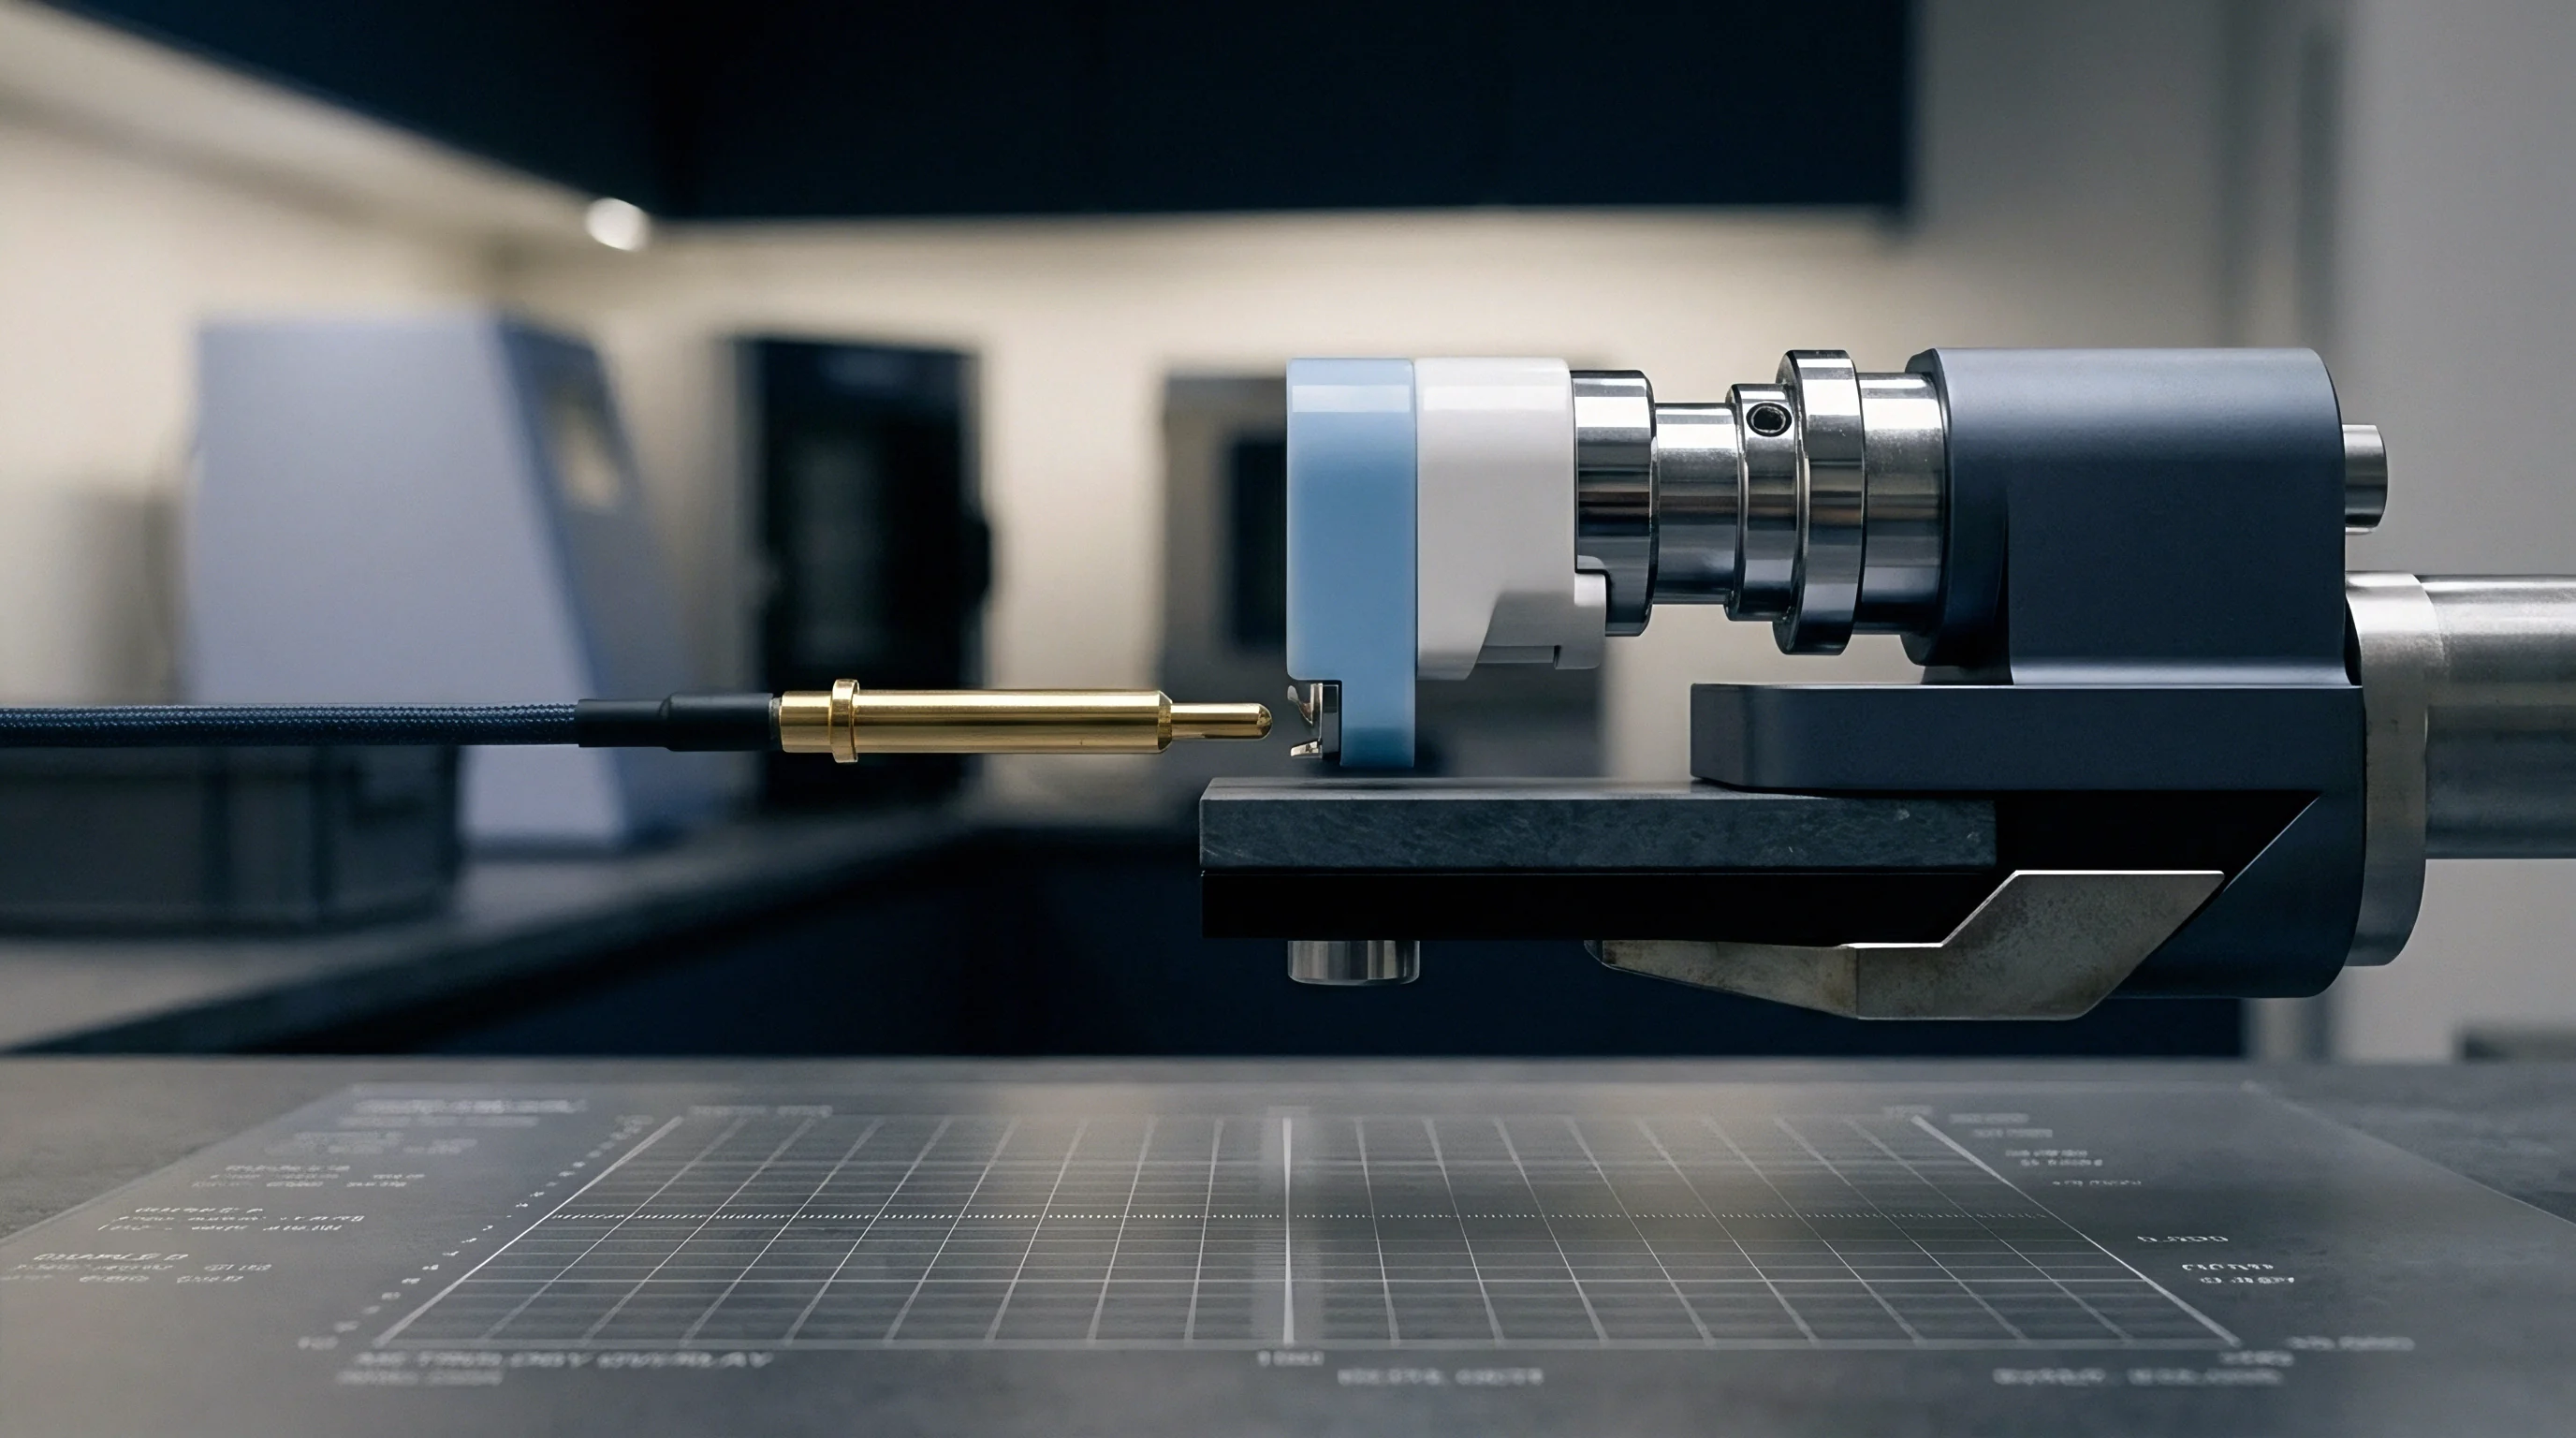
High-speed cell testing setups utilize hall-effect sensors or precision current shunts to track pulse initiation. Current shunts require minimal inductance. Hardware timing skew occurs when the current sensing path and the voltage sensing path possess different signal propagation speeds or filter cut-off frequencies.
A low-pass anti-aliasing filter set to a cutoff frequency of 100 Hertz on the voltage channel introduces a group delay near 1.6 milliseconds. If the current channel uses an unfiltered high-bandwidth sensor, the acquisition system registers the current step at time t = 0, but reads the corresponding voltage response 1.6 ms later.
Digital signal processing buffers inside test equipment frequently aggregate current and voltage measurements asynchronously. Standard pulse discharge procedures, such as the Hybrid Pulse Power Characterization test defined in ISO 12405-4, specify recording cell terminal voltage at fixed intervals after pulse initiation, typically at 100 milliseconds and 10 seconds. However, calculating the true DC resistance (Rdc) or pure ohmic jump requires capturing the immediate voltage displacement before electrochemical double-layer charging commences.
Phase delays obscure ohmic jumps.

Voltage Signal Decoupling in Fast Pulse Testing
Disentangling resistive voltage drops from double-layer capacitive charging requires evaluating sensor bandwidth limits. High-power prismatic cells utilizing nickel-manganese-cobalt chemistries exhibit double-layer capacitance values (Cdl) exceeding 5 Farads per cell. The resulting charge-transfer time constant (τ = Rct · Cdl) ranges between 1 millisecond and 15 milliseconds.
Fast sampling preserves edge sharpness.
When voltage sampling lags behind current excitation by a duration comparable to τ, the observed voltage differential (Δ Vmeasured) combines ohmic and charge transfer components. Test bench software calculating resistance via Ohm’s Law (Δ V / I) yields an inflated ohmic resistance value. Misclassifying initial ohmic resistance leads to incorrect battery pack thermal modeling, under-designing liquid cooling cold plates, and triggering premature thermal throttles during field operation.

Dynamics
Electrochemical systems respond to current transients through distinct physical phenomena operating across disparate time domains. Immediately upon applying a current step, electrons flow through the metallic current collectors, tab welds, and porous electrode networks, producing an instantaneous voltage step dominated by electronic and ionic bulk conductivity. This instantaneous response completes within sub-microsecond timescales.
Voltage drop breakdown across the solid electrolyte interphase occurs simultaneously, establishing the baseline ohmic resistance of the cell.
A current step rise time exceeding 50 microseconds distorts pure ohmic voltage drops by mixing double-layer charge transfer mechanics into initial impedance estimations.
Following the immediate ohmic response, ionic accumulation at the electrode-electrolyte interface charges the electrochemical double layer. This process behaves electrically as a parallel combination of charge-transfer resistance (Rct) and double-layer capacitance (Cdl). As double-layer charging progresses, reaction overpotentials develop at both anode and cathode active material surfaces.
Uncalibrated hardware masks cell degradation. At longer timescales, extending from hundreds of milliseconds to several minutes, solid-state diffusion within active material particles and concentration gradients within the liquid electrolyte dominate the voltage transient, characterized by Warburg impedance behavior.
Ohmic Intercept and Double Layer Capacitance
Isolating bulk conductivity from interfacial charge transfer demands precise temporal resolution during initial pulse activation. In mathematical modeling, the total transient voltage response V(t) during a constant current step I follows the simplified single-time-constant expression:
V(t) = VOCV – I · R0 – I · Rct left(1 – e-fractτright)
where VOCV represents open-circuit voltage, R0 is ohmic resistance, Rct is charge transfer resistance, and τ = Rct · Cdl is the charge transfer time constant. Voltage recovery reveals diffusion behavior. If data acquisition hardware delays recording the initial post-pulse voltage until t = Δ t, the recorded voltage reflects:
V(Δ t) = VOCV – I · left
The apparent ohmic resistance extracted from this single delayed sample equals R0 + Rct left(1 – e-fracΔ tτright), introducing a systematic positive error directly proportional to charge transfer resistance and exponentially dependent on the ratio of acquisition delay to double-layer time constant.

Time Constants of Anode and Cathode Responses
Lithium-ion cells present multiple overlapping time constants due to differing kinetic properties at the negative and positive electrodes. Graphite anodes typically exhibit rapid double-layer charging kinetics with time constants between 0.5 milliseconds and 3 milliseconds. Cathode materials such as lithium iron phosphate or high-nickel layered oxides demonstrate slower charge-transfer response times ranging from 5 milliseconds to 50 milliseconds depending on state of charge and ambient temperature.
Cold operational environments dramatically slow interfacial kinetics. At lower temperatures, charge transfer resistance increases by an order of magnitude, lengthening the time constant τ. Consequently, a fixed hardware sampling delay of one millisecond captures a smaller fraction of the charge transfer transient at sub-zero temperatures compared to room temperature.
Multiplexing introduces channel time offsets. Equipment vendors frequently maintain that internal multiplexer scan speeds of ten milliseconds remain adequate for industrial cell sorting, disregarding the physical reality of electrochemical charge transfer activation.
Arithmetic
Quantifying measurement error driven by data acquisition latency requires formalizing the relationship between timing offsets, sampling frequencies, and kinetic parameters. Standard laboratory test channels sample data at rates between 10 Hertz and 10 Kilohertz. A channel sampling at 10 Hertz captures data points every 100 milliseconds.
If a current step occurs between discrete sampling ticks, the effective logging latency varies stochastically between 0 and 100 milliseconds unless the current source directly triggers the converter clock.
How Does Sample Latency Distort Pulse Resistance Calculation?
Defining the relative error in ohmic resistance calculation (εR) establishes a deterministic baseline for hardware qualification. Relative error is expressed as:
εR = fracRcalc – R0R0 = fracRctR0 left(1 – e-fracΔ tτright)
When the acquisition delay Δ t is small relative to τ, first-order Taylor series expansion simplifies the error formulation:
εR ≈ fracRctR0 · fracΔ tτ = fracΔ tR0 · Cdl
This linear approximation demonstrates that relative ohmic error scales inversely with double-layer capacitance. High-capacity commercial cells with large total electrode surface areas possess massive double-layer capacitance, which partially dampens relative error growth for short delays. Conversely, small-format cylindrical cells or low-capacity micro-cells exhibit small double-layer capacitance, causing rapid error escalation even with modest microsecond-scale logging latencies.
| Data Acquisition Delay (Δ t) | Double-Layer Time Constant (τ) | True Ohmic Resistance (R0) | Charge Transfer Resistance (Rct) | Calculated Ohmic Resistance (Rcalc) | Systematic Measurement Error (%) |
|---|---|---|---|---|---|
| 10 $mu$s | 2.0 ms | 0.50 mΩ | 0.80 mΩ | 0.504 mΩ | 0.80% |
| 50 $mu$s | 2.0 ms | 0.50 mΩ | 0.80 mΩ | 0.519 mΩ | 3.95% |
| 100 $mu$s | 2.0 ms | 0.50 mΩ | 0.80 mΩ | 0.539 mΩ | 7.80% |
| 500 $mu$s | 2.0 ms | 0.50 mΩ | 0.80 mΩ | 0.677 mΩ | 35.39% |
| 1.0 ms | 2.0 ms | 0.50 mΩ | 0.80 mΩ | 0.815 mΩ | 62.94% |
| 5.0 ms | 2.0 ms | 0.50 mΩ | 0.80 mΩ | 1.234 mΩ | 146.87% |

Exponential Fitting Error Functions across Sampling Intervals
Attempting to recover R0 through post-processing multi-exponential fitting functions introduces secondary numerical instabilities when data acquisition intervals are coarse. Two-term exponential models (V(t) = A0 + A1 e-t/τ1 + A2 e-t/τ2) require sufficient data density during the first decay decade ($0
- Connect the precision current shunt output directly to the primary hardware interrupt input of the voltage digitizer board.
- Measure the propagation delay across isolation amplifiers using a dual-channel 100 Megahertz digital storage oscilloscope.
- Adjust the hardware delay compensation register within the cycler firmware to align current step edge detection with voltage frame grabbing.
- Verify timing alignment by measuring a non-inductive metallic calibration resistor under pulsed conditions.
- Reject test setup configurations exhibiting voltage step rise times greater than five percent of the target cell double-layer time constant.
Matching the data acquisition sampling frequency to the electrochemistry time constant prevents signal attenuation without overloading channel processing memory.
Inaccurate baselines void thermal models. Securing accurate ohmic baseline values demands triggering the voltage acquisition hardware synchronously with current driver switching rather than relying on software-based clock polling.
Topology
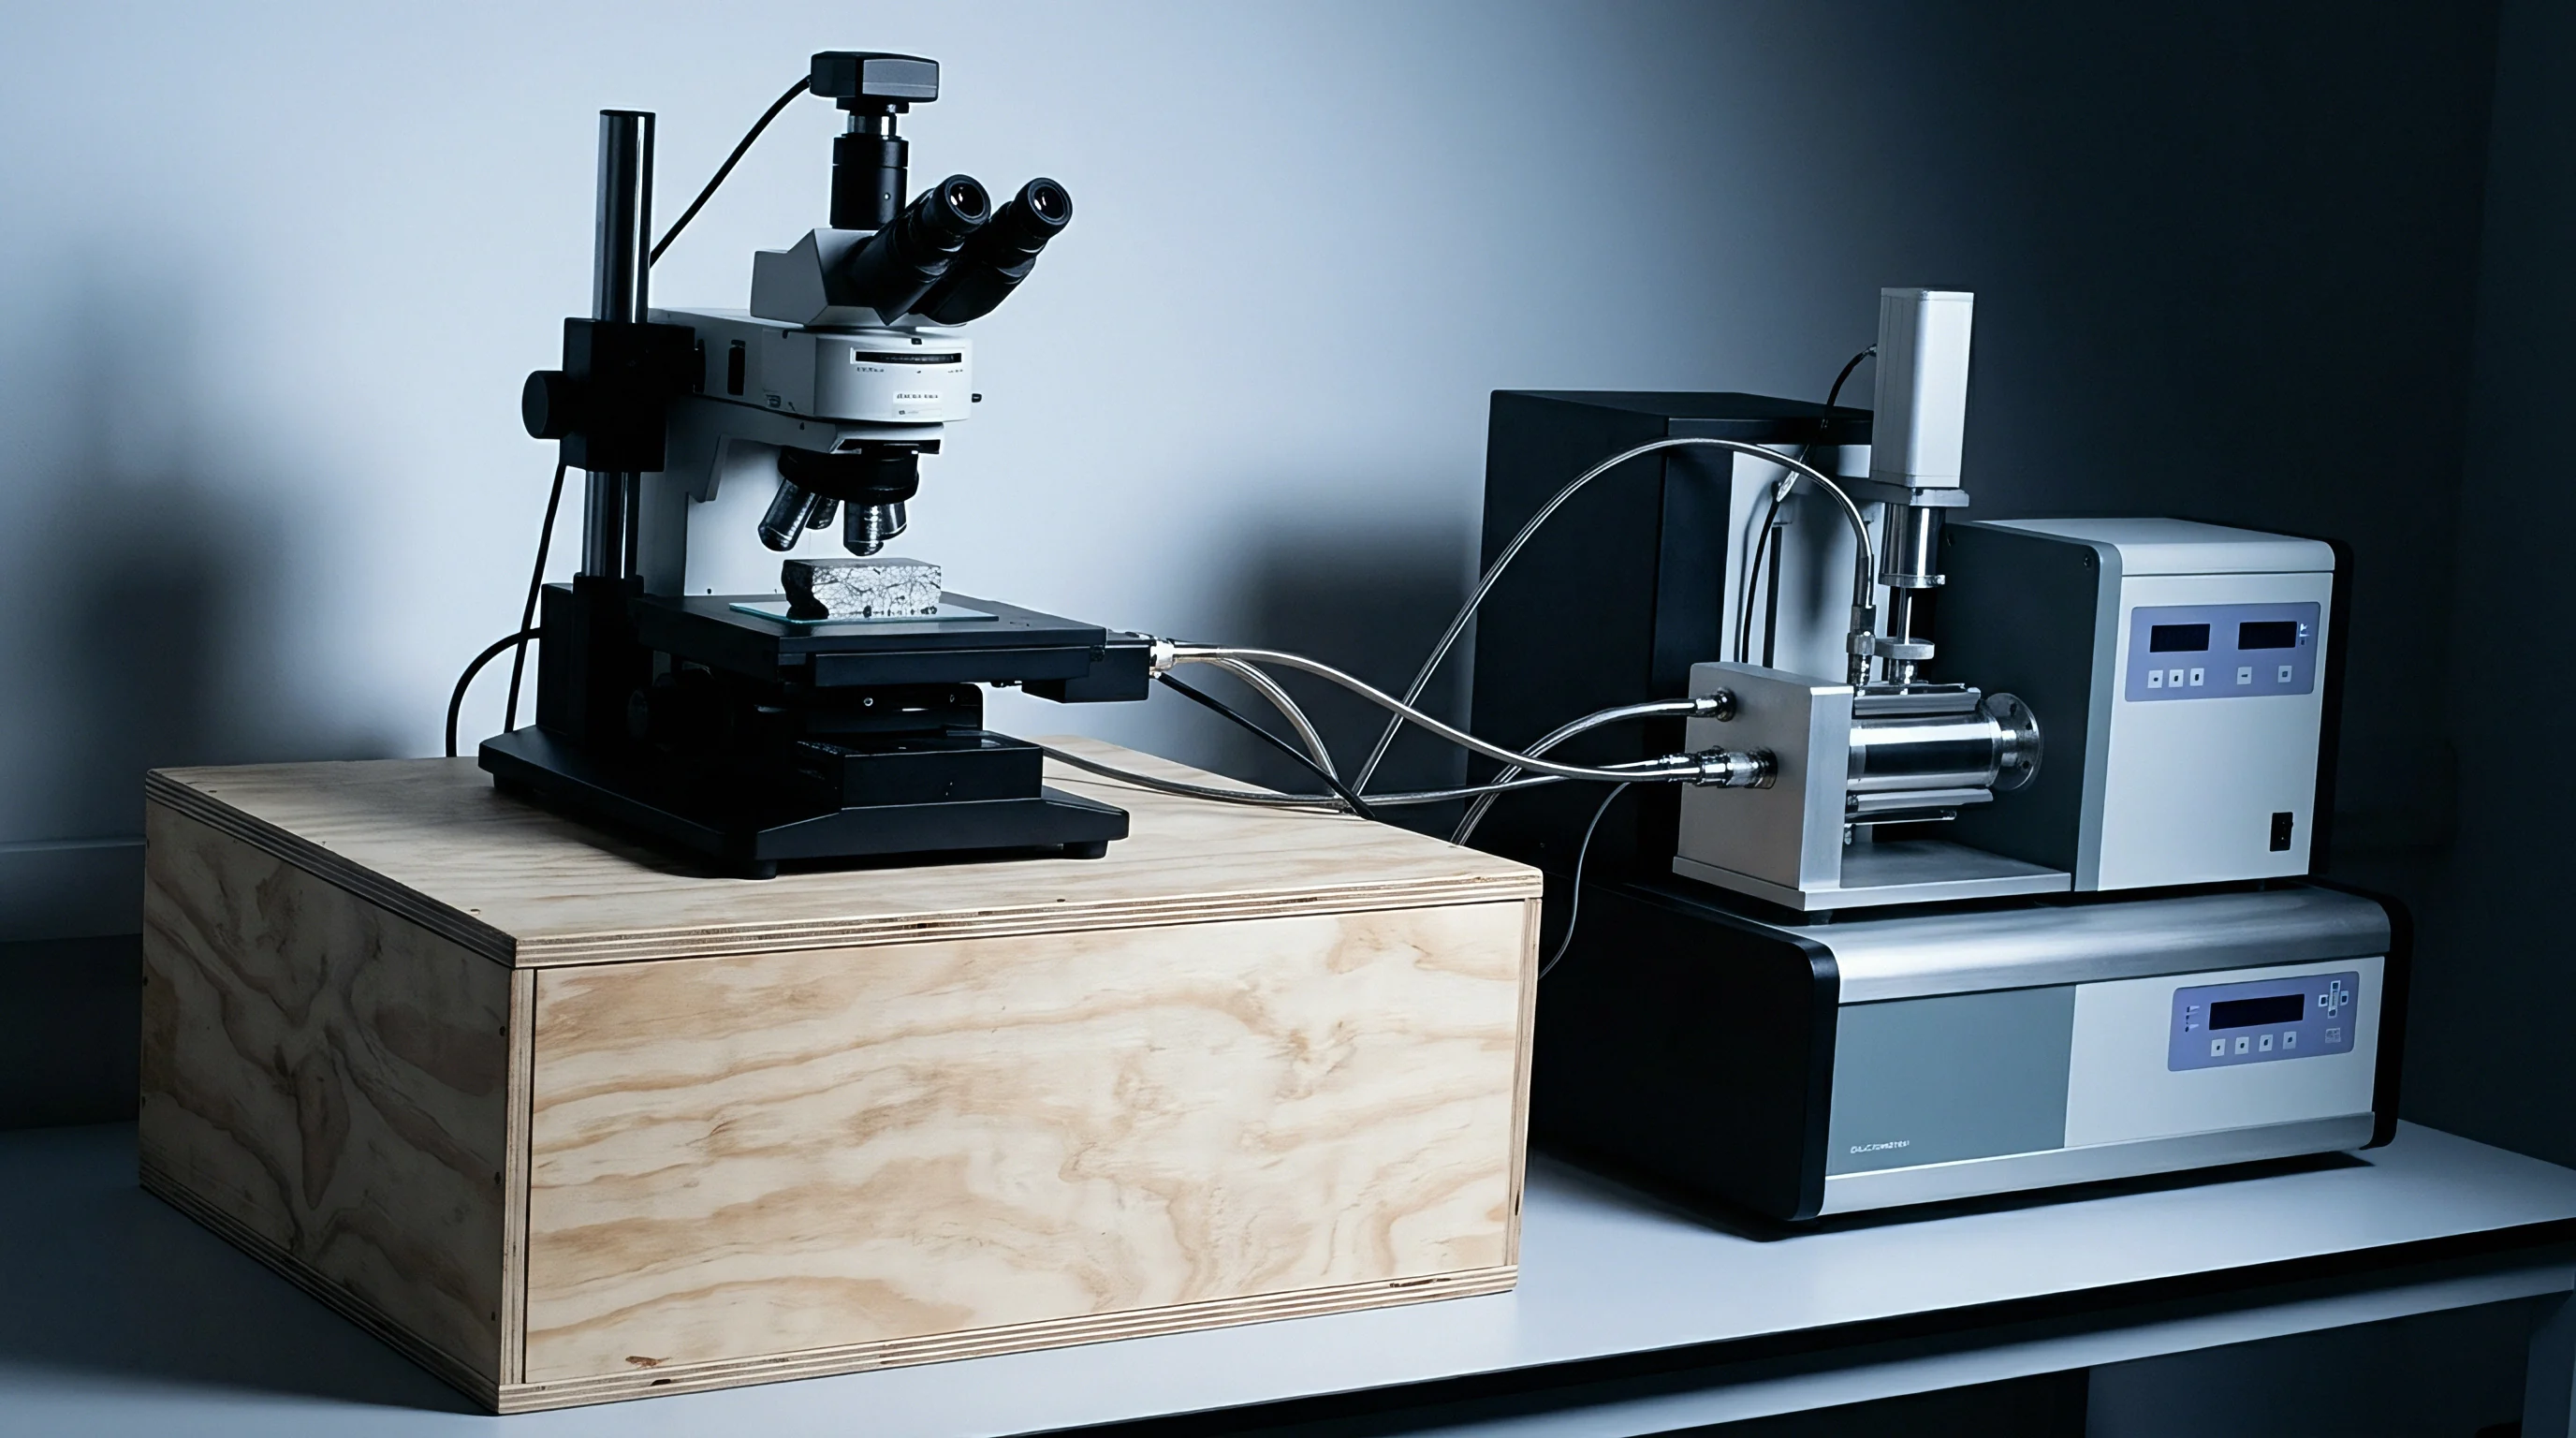
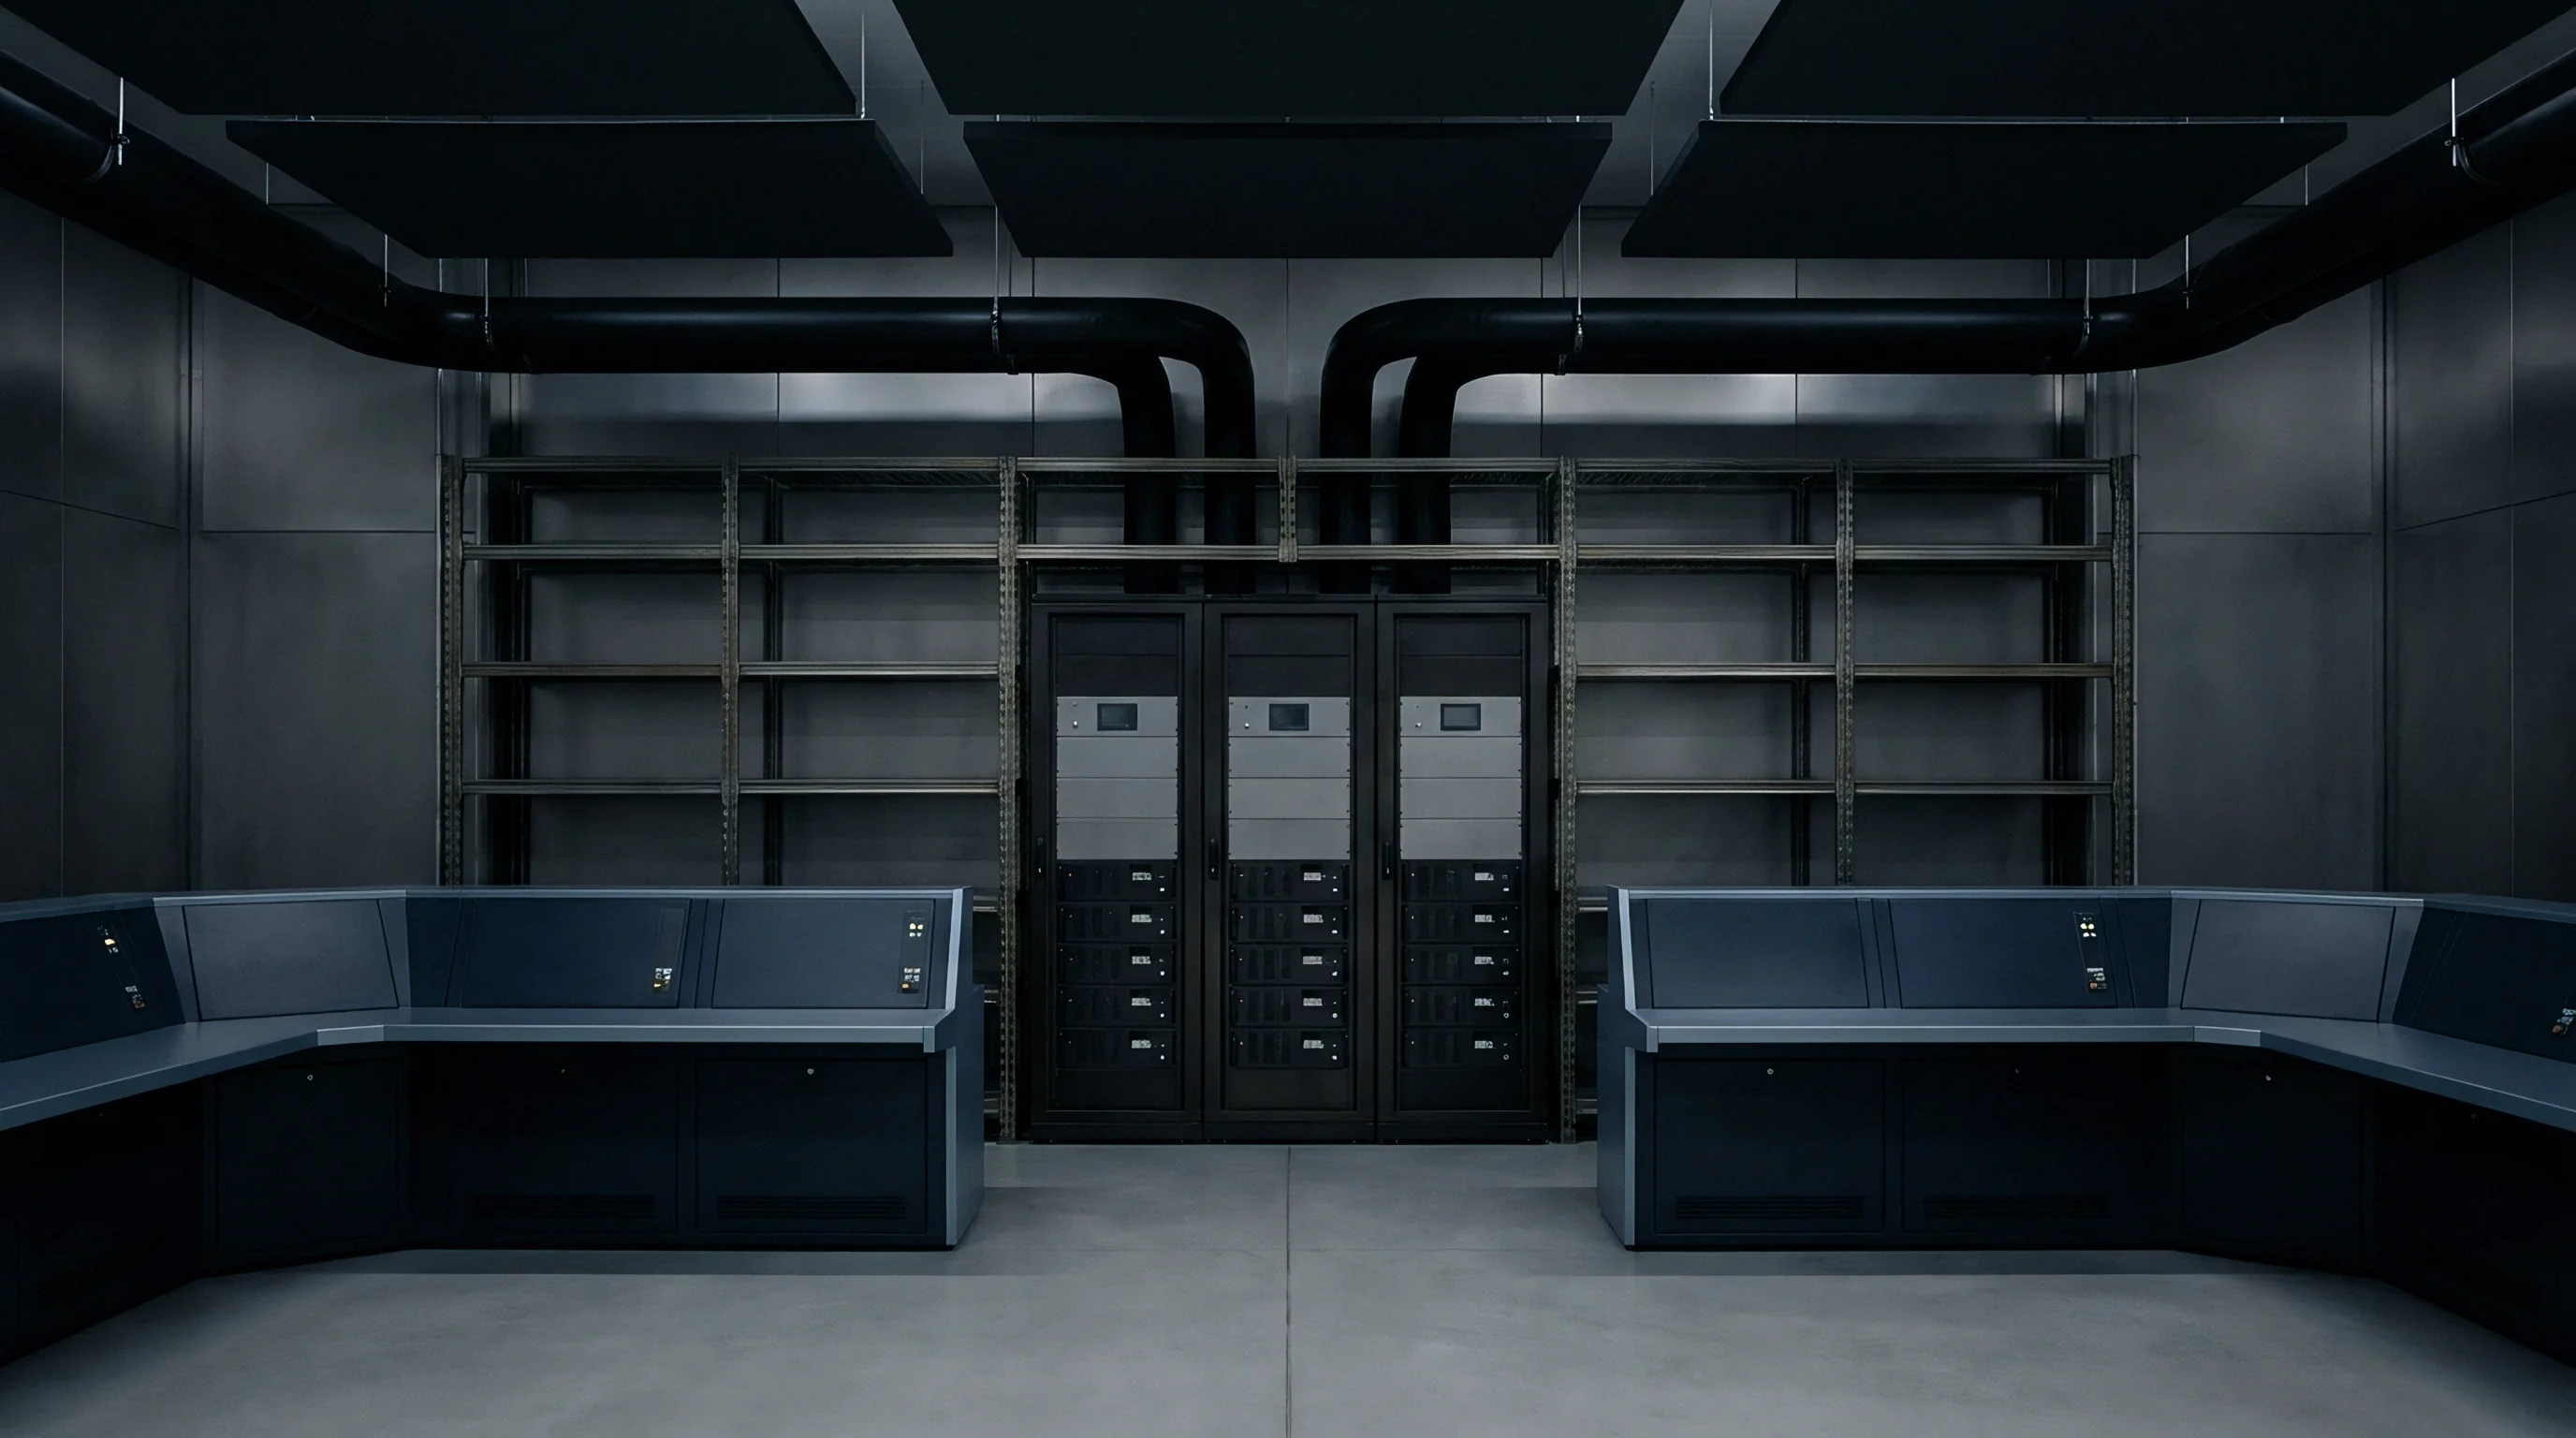
Hardware layout decisions in test laboratories heavily influence data acquisition performance. Large-scale cell manufacturing facilities employ multi-channel test cabinets housing up to 256 independent test channels per rack. Cost constraints drive hardware designers to choose between parallel dedicated analog-to-digital converters or multiplexed architecture where a single high-speed converter services multiple cell channels via solid-state switches.
Multiplexed topologies switch sequentially across channels. A 32-channel multiplexed card running a single converter at 100 Kilosamples per second achieves a per-channel sampling rate of 3.125 Kilosamples per second, corresponding to a 320-microsecond interval between successive readings on the same channel. Crucially, the switching event introduces settling time delays caused by relay charge injection and multiplexer input capacitance charging.
Sampling clock drift compounds error.
| Architecture Class | Simultaneous Sampling Capability | Inter-Channel Time Skew ($mu$s) | Max Anti-Aliasing Group Delay ($mu$s) | Typical Resistance Error Range (%) |
|---|---|---|---|---|
| Dedicated Per-Channel ADC | Fully Synchronous | < 0.1 | 15 | 0.1 – 0.5 |
| High-Speed Multiplexed (8-Ch) | Sequential Scanning | 12.5 | 120 | 1.5 – 4.0 |
| Standard Multiplexed (32-Ch) | Sequential Scanning | 320.0 | 500 | 15.0 – 45.0 |
| Software-Polled USB/CAN DAQ | Asynchronous Bus | 1000.0 – 5000.0 | 1600 | 50.0 – 200.0 |
Simultaneous Multiplexed Signal Chain Architectures
Simultaneous sampling architectures provide dedicated sample-and-hold circuits and independent converters for every voltage and current measurement channel. This configuration eliminates inter-channel timing skew. Analog signal filtering within simultaneous architectures must balance noise rejection against group delay.
Filters distort rapid voltage steps.
Active Butterworth low-pass filters provide maximally flat passband response but exhibit non-linear phase response, resulting in frequency-dependent delay across transient spectrum components. Linear-phase Bessel filters introduce constant group delay, allowing simple time-shift compensation in software, but offer softer attenuation roll-off characteristics. Selecting an aggressive filter topology to block industrial 50 Hertz or 60 Hertz line noise without accounting for phase response introduces hidden delays that corrupt fast transient pulse interpretations.

Anti Aliasing Filter Phase Shift Propagation
Digital filtering implemented inside delta-sigma analog-to-digital converters presents another source of signal latency. Delta-sigma converters utilize internal finite impulse response digital filters to decimate high-frequency single-bit data streams into high-resolution multi-bit words. The group delay of an internal decimation filter scales inversely with the output data rate.
- Uncompensated Group Delay alters step edge alignment between asynchronous current and voltage sampling clocks.
- Multiplexer Crosstalk Injection introduces transient voltage spikes when adjacent channels operate at wildly disparate voltage potentials.
- Ground Loop Induced Common-Mode Offset shifts low-level voltage measurements during high-current discharge steps.
- Thermal Drift in Sensing Resistors alters current measurement scale factors during extended high-power testing sequences.
Compliance with ISO 12405-4 pulse discharge testing requires voltage logging intervals under one millisecond to prevent systematic underreporting of internal heating.
Whether low-cost cell cycler calibration procedures can reliably compensate for temperature-dependent group delay shifts inside active analog filtering circuits remains an unresolved question across commercial test houses.
Estimation
Battery Management Systems (BMS) rely on accurate offline cell characterization data to parameterize online equivalent circuit models. Equivalent circuit structures typically combine an ohmic resistance (R0) with one or two parallel RC networks (R1-C1, R2-C2) representing charge transfer and diffusion dynamics. Impedance tracking protects battery lifespan.
When baseline parameters derived from laboratory pulse tests carry systematic errors driven by acquisition delay, online estimation algorithms yield flawed state-of-charge and state-of-health outputs.
Kalman filtering frameworks rely on state covariance matrices to weigh model predictions against live voltage measurements. If the underlying lookup table overstates R0 due to laboratory sampling latencies, the model overpredicts internal voltage drop during high-current acceleration bursts. The filter attributes the discrepancy between predicted and measured voltage to an incorrect state of charge, driving non-physical state corrections that degrade estimator stability.

State of Charge and Health Model Drift
State-of-health tracking relies on monitoring gradual increases in baseline ohmic resistance over operational lifespan. Typical end-of-life criteria for traction batteries define failure when internal cell resistance increases by 100 percent over initial baseline. An unquantified initial measurement error of 35 percent caused by a 500-microsecond sampling delay consumes over one-third of the total allowable lifespan degradation window at cell delivery.
Factory grading routines classifying incoming cell lots based on pulse resistance risk rejecting acceptable production lots or accepting substandard batches when test bench hardware timing is inconsistent across manufacturing lines. A test rack operating with uncompensated filter delay logs artificially high resistance values, misrepresenting high-quality cells as degraded stock.
Thermal Power Dissipation and Derating Skew
Real-time thermal management software calculates internal heat generation using Joule heating formulations (Pheat = I2 · Rdc). Thermal models parameterized with inflated pulse resistance values overpredict heat generation during peak current events. Excessively conservative thermal derating routines throttle vehicle performance prematurely, artificially limiting continuous discharge capabilities.
- Signal Chain Synchronization Audit confirms physical hardware trigger lines directly connect current excitation modules with voltage sampling digitizers.
- Filter Group Delay Characterization documents phase lag across the entire operating frequency spectrum for all analog signal conditioning components.
- Pulse Edge Rise Time Mapping verifies current driver rise times remain below ten percent of target cell double-layer time constants.
- Calibration Tracing Verification ensures resistance calibration blocks utilize low-inductance, four-wire precision shunts certified under transient step conditions.
Unchecked data acquisition latencies propagate systematically through battery management system state estimators, creating unearned safety margins in peak power derating routines.
Incorporating IEC 62660-1 Clause 6.2.2 requirements into procurement contracts forces vendors to provide raw high-frequency voltage transient logs alongside converted resistance summaries.
Settlement
Resolving commercial disputes regarding cell internal resistance claims requires detailed forensic auditing of supplier qualification dossiers. Datasheets published by cell manufacturers routinely quote internal resistance figures measured at 1 Kilohertz using AC impedance meters (RAC1kHz), alongside DC pulse resistance figures (RDC10s). Discrepancies between buyer receiving tests and seller release certificates frequently stem from unaligned data acquisition topologies rather than true physical cell batch variance.
Receiving inspection protocols must mandate explicit documentation of hardware sampling rates, filter cutoff frequencies, and current-to-voltage triggering mechanisms. Without standardized data acquisition timing specifications, contractual resistance thresholds lack legal enforceability during warranty claims or lot rejection proceedings.

Factory Acceptance Testing Verification Protocols
Cell procurement contracts specifying transient resistance tolerances should incorporate clear technical addenda governing test hardware configuration. Factory acceptance testing standards must define maximum allowable timing latency between current pulse command and voltage log acquisition.
When factory acceptance testing protocols mandate sub-10-microsecond synchronization between current excitation and voltage logging, receiving inspection laboratories can accurately replicate factory release parameters. Establishing matched signal conditioning chains across vendor and buyer test benches eliminates systematic measurement divergence.
Commercial Dispute Resolution for Cell Resistance Claims
A structured technical audit of disputed cell resistance logs begins with analyzing raw, un unfiltered high-frequency time-series data. Reconstructing the initial pulse edge permits calculating the exact measurement offset applied by vendor processing scripts.
Quantifying the precise timing error converts ambiguous performance disputes into deterministic electrical engineering corrections. Standardized calibration routines using certified non-inductive calibration blocks provide neutral baseline references, allowing contract partners to isolate hardware signal acquisition delays from genuine electrochemical degradation. Standardizing transient measurement protocols across global supply chains ensures consistent quality verification, protects financial investments, and establishes sound technical baselines for advanced battery pack deployment.