Closed Pore Architecture Optimization via Ozone Assisted Pre-Oxidation Parameters
Ozone-assisted pre-oxidation creates oxygen bridges that maximize closed pore nanovoids in hard carbon, raising initial coulombic efficiency above ninety percent.
Precursor
Hard carbon synthesis relies on controlling the molecular network of disordered aromatic feedstocks before high-temperature pyrolysis. Without structural intervention during pyrolysis, reactive hydrocarbon chains in pitch, phenolic resin, and biomass extracts collapse into dense graphitic crystallites. Introducing electrophilic oxygen species via gas-phase treatment creates covalent cross-links across adjacent aromatic domains.
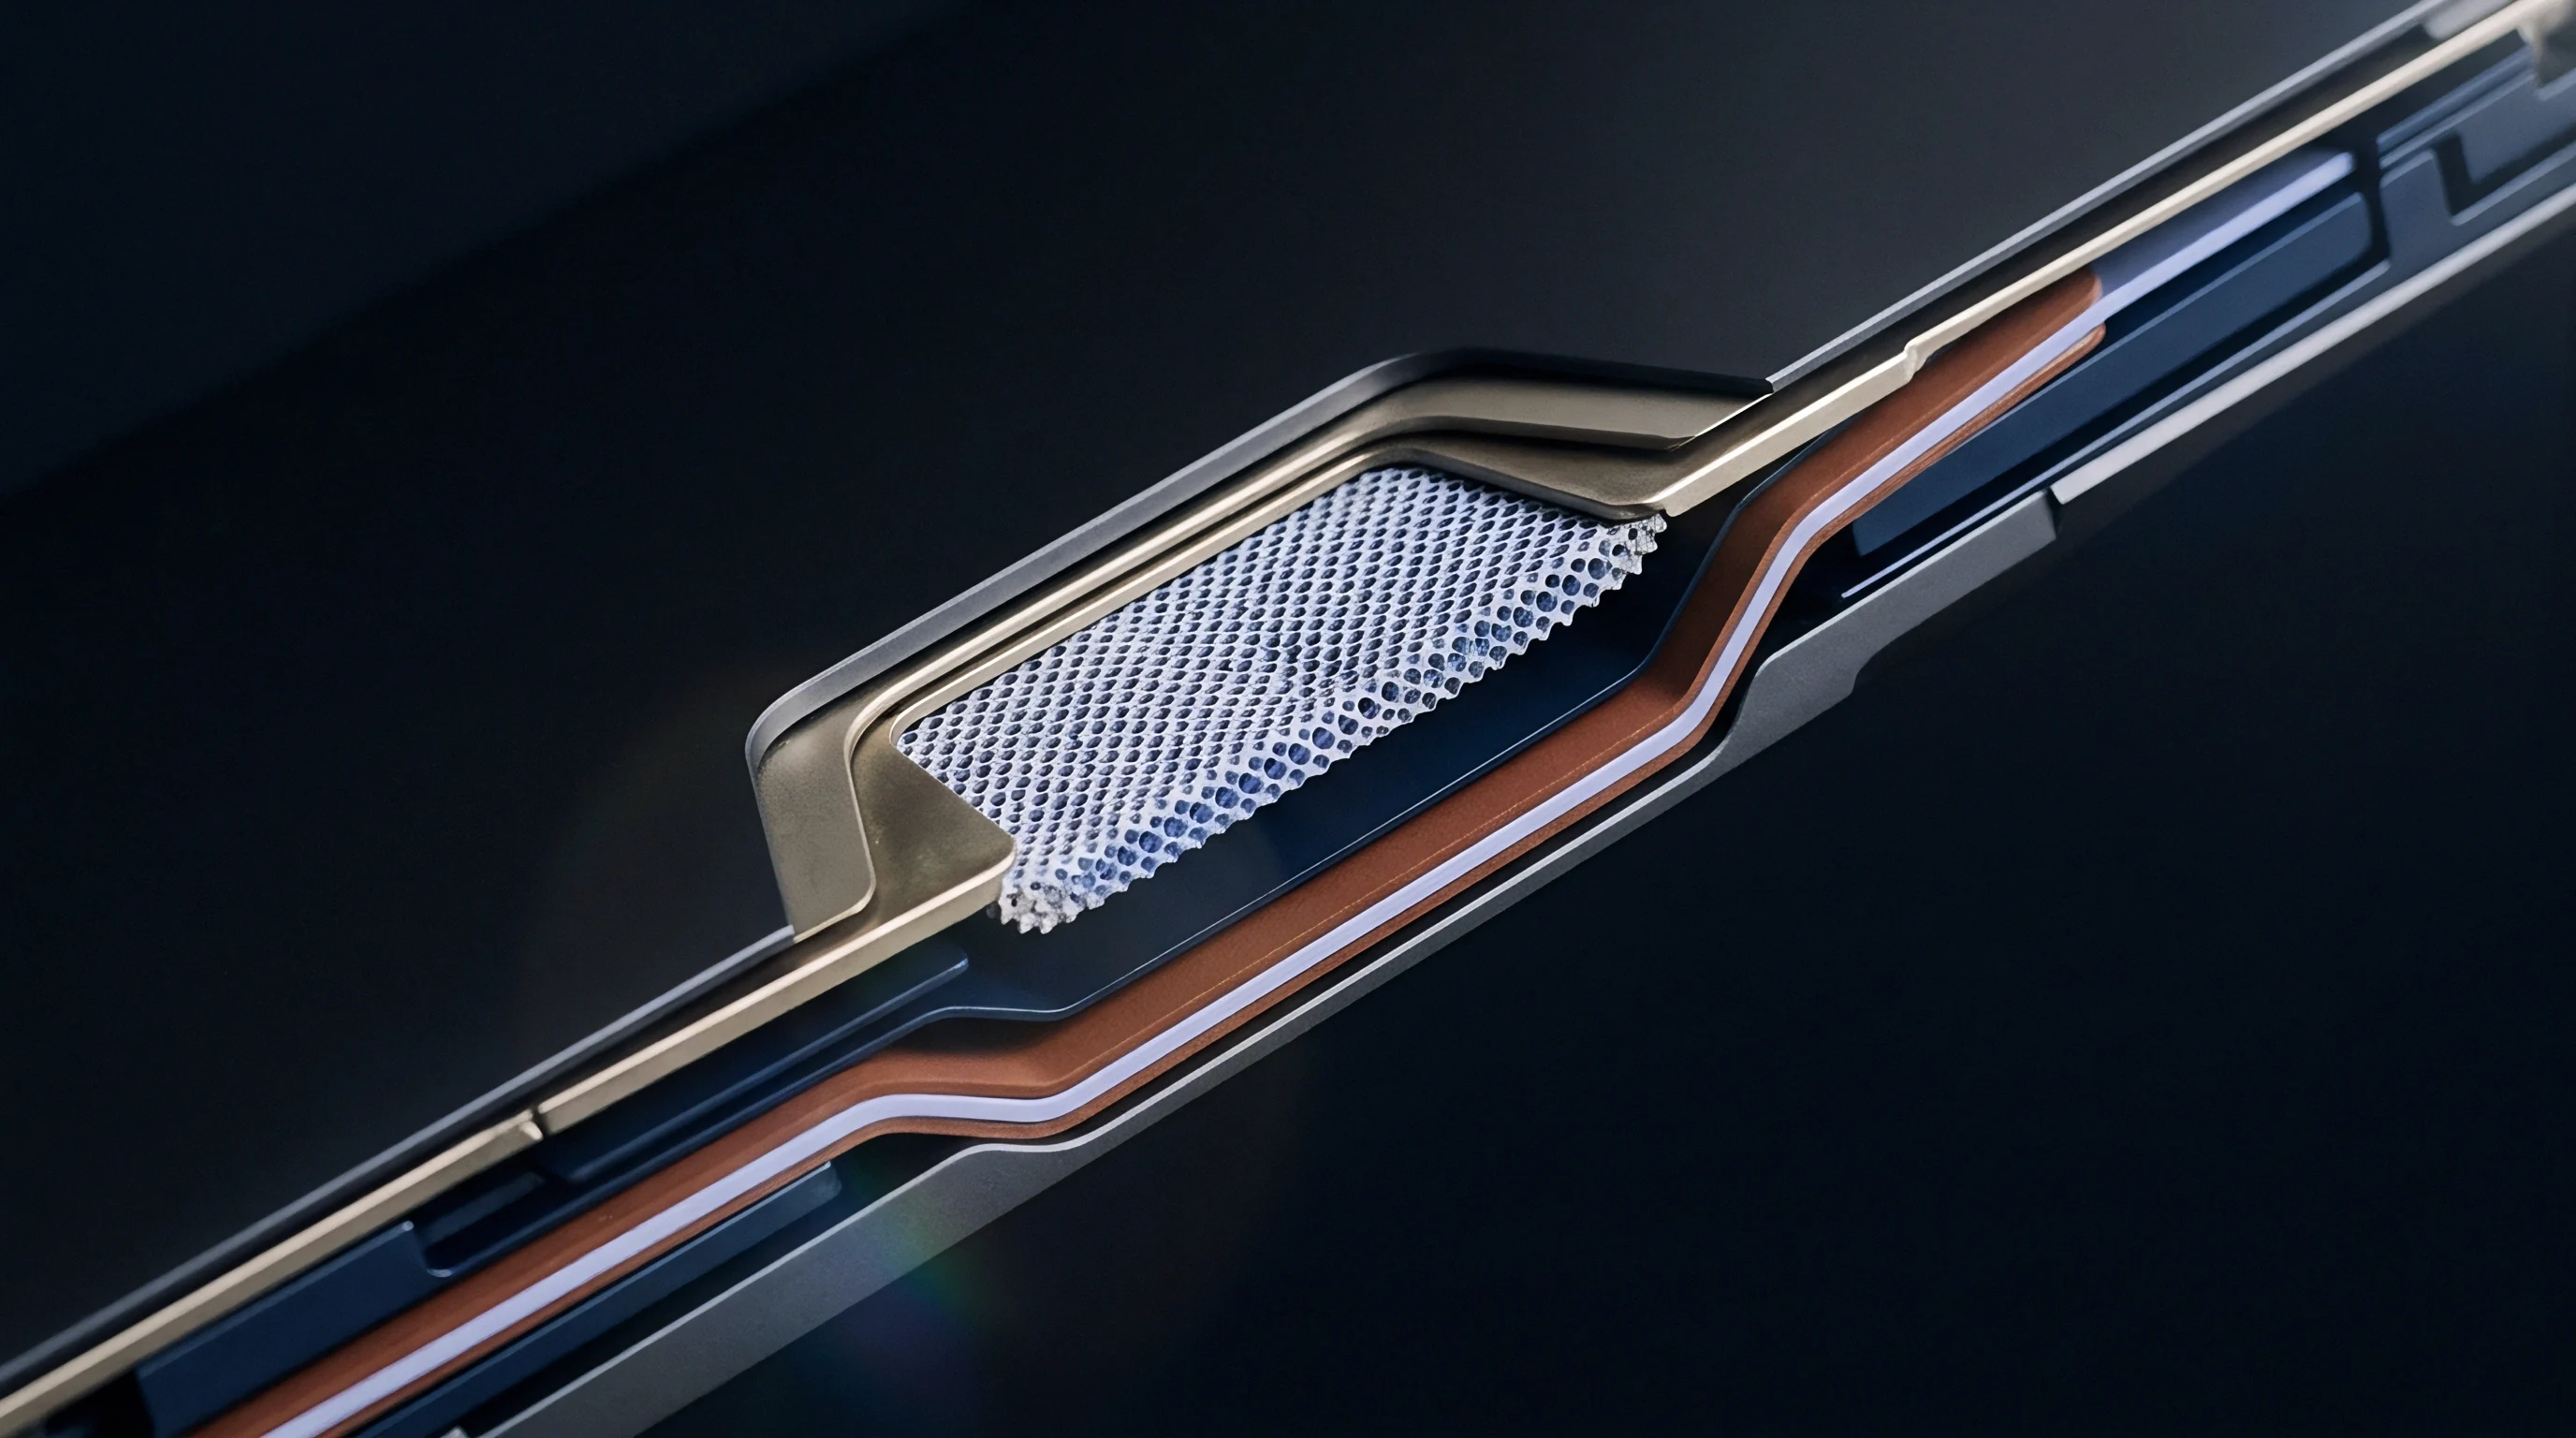
These oxygen bridges prevent macromolecular sliding during heat treatment, yielding a rigid structure that resists alignment into parallel graphitic planes and provides the foundation for internal nanovoids.
Gas Phase Radical Crosslinking
Introducing active oxidants into aromatic hydrocarbon feedstocks drives target reaction pathways at lower thermal thresholds than atmospheric air oxidation. Ozone radicals attack electron-rich double bonds and aromatic rings between one hundred and two hundred degrees Celsius, generating aliphatic oxygen functional groups such as ether, carbonyl, and carboxyl bridges. These cross-links lock the macromolecular architecture in place before volatile components evaporate.
Traditional air pre-oxidation requires temperatures between two hundred fifty and three hundred fifty degrees Celsius, where core oxidation occurs alongside aggressive mass loss and surface combustion. By contrast, low-temperature gas-phase ozonolysis proceeds via direct electrophilic insertion without triggering bulk precursor combustion, avoiding the yield losses caused when uncontrolled combustion degrades primary carbon chains.
Pre-oxidation of asphalt pitch at 140 degrees Celsius under a three percent volumetric ozone concentration increases mass yield by six point two percent during subsequent thermal treatment at 1200 degrees Celsius.
Thermal Stabilization Windows
Temperature control during chemical cross-linking dictates the oxygen uptake rate and functional group distribution. Below one hundred degrees Celsius, radical cleavage slows, yielding insufficient cross-linking density. Above two hundred degrees Celsius, ozone thermal decomposition occurs before molecular contact with the carbon particles can take place.
Operating between one hundred twenty and one hundred eighty degrees Celsius maximizes ether and ester cross-link density while keeping mass loss to a minimum.
Process control parameters dictate the particle surface state prior to high-temperature carbonization. Uncontrolled oxygen insertion leads to distinct material failure pathways:
- Unreacted pitch melting Occurs when insufficient cross-linking density allows the precursor to soften and flow during carbonization, destroying internal porosity and lowering active sodium storage volume.
- Excessive aromatic cleavage Results from over-oxidation where carbon-carbon bonds break into volatile gas species, eroding particle density and severely reducing fixed carbon yield.
- Surface ablation Arises from localized thermal spikes in high ozone concentrations, generating non-uniform skin oxidation that impedes uniform gas diffusion through the bulk bed.
- Incomplete oxygen insertion Leaves core precursor molecules un-crosslinked, resulting in localized graphitization zones that suppress low-potential plateau capacity in finished cells.
Deviations in the pre-oxidation thermal window disrupt the cross-linking profile across particle cross-sections. Core-shell variance in cross-link density causes differential shrinkage during carbonization, triggering particle cracking and exposing internal surfaces that degrade cell efficiency.


Void
Internal nanovoids within disordered carbon matrices store sodium ions via quasi-metallic micro-condensation. Pyrolysis between eleven hundred and fourteen hundred degrees Celsius volatilizes residual oxygen groups, driving the contraction and bending of short-range graphitic layers. Bounded by curved, disordered graphene sheets, closed pores form as evolving gas exits without leaving open channels to the particle surface.
This closed pore architecture determines the magnitude of low-potential plateau capacity in sodium-ion battery anodes.

Which Analytical Methods Distinguish True Closed Nanovoids from Inaccessible Open Micropores?
Small angle X-ray scattering evaluates electron density fluctuations between carbon walls and internal voids without requiring gas penetration. Comparing scattering intensity profiles against gas physisorption data differentiates accessible open pores from isolated nanovoids. Nitrogen adsorption at seventy-seven Kelvin captures open micropores down to zero point seven nanometers, while helium pycnometry measures true skeletal density.
Discrepancies between this skeletal density and theoretical carbon density confirm the presence of sealed internal volume.
Gas physisorption using carbon dioxide at two hundred seventy-three Kelvin detects ultra-fine open micropores below zero point seven nanometers that nitrogen cannot enter at low temperatures. A high small-angle scattering void volume combined with low nitrogen and carbon dioxide adsorption confirms an optimized closed pore network. Skeletal density drops accordingly as closed pore volume expands.
Material specifications mandating a nitrogen BET surface area below two square meters per gram enforce electrolyte stability at the hard carbon interface during initial cell formation.
Curved Graphene Layering Mechanics
High-temperature pyrolysis converts oxygen-bridged aromatic clusters into short-range ordered domains. As oxygen escapes as carbon monoxide and carbon dioxide gas, the resulting structural defects force graphene sheets to curve and fold. The tight radius of curvature prevents parallel alignment, creating sealed internal pockets between one and three nanometers in diameter.
| Oxidation Temp (°C) | Ozone Concentration (vol%) | N2 BET Area (m²/g) | SAXS Closed Pore Vol (cm³/g) | True Density (g/cm³) | ICE (%) | Plateau Cap (mAh/g) |
|---|---|---|---|---|---|---|
| 100 | 1.0 | 12.4 | 0.042 | 1.98 | 76.2 | 140 |
| 140 | 3.0 | 1.8 | 0.118 | 1.52 | 91.4 | 245 |
| 180 | 3.0 | 2.5 | 0.098 | 1.61 | 88.7 | 210 |
| 220 | 5.0 | 18.6 | 0.021 | 2.04 | 68.5 | 95 |
| Carbonization fixed at 1300°C for 2 hours under argon flow. Electrochemical testing performed in Na half-cells at 20 mA/g between 0.01V and 2.0V vs Na/Na+. | ||||||
Expanding closed pore volume directly increases sodium storage capacity below zero point one volts versus Na/Na+. High cross-linking density during pre-oxidation prevents open channels from surviving carbonization. Because closed pore volume correlates inversely with skeletal density measured by helium pycnometry, these pores must stay isolated from electrolyte solvent molecules to avoid continuous solid electrolyte interphase formation.
If processing fails to seal surface pores, electrolyte molecules penetrate the carbon interior and form internal solid electrolyte interphase, permanently trapping active sodium ions.


Chamber
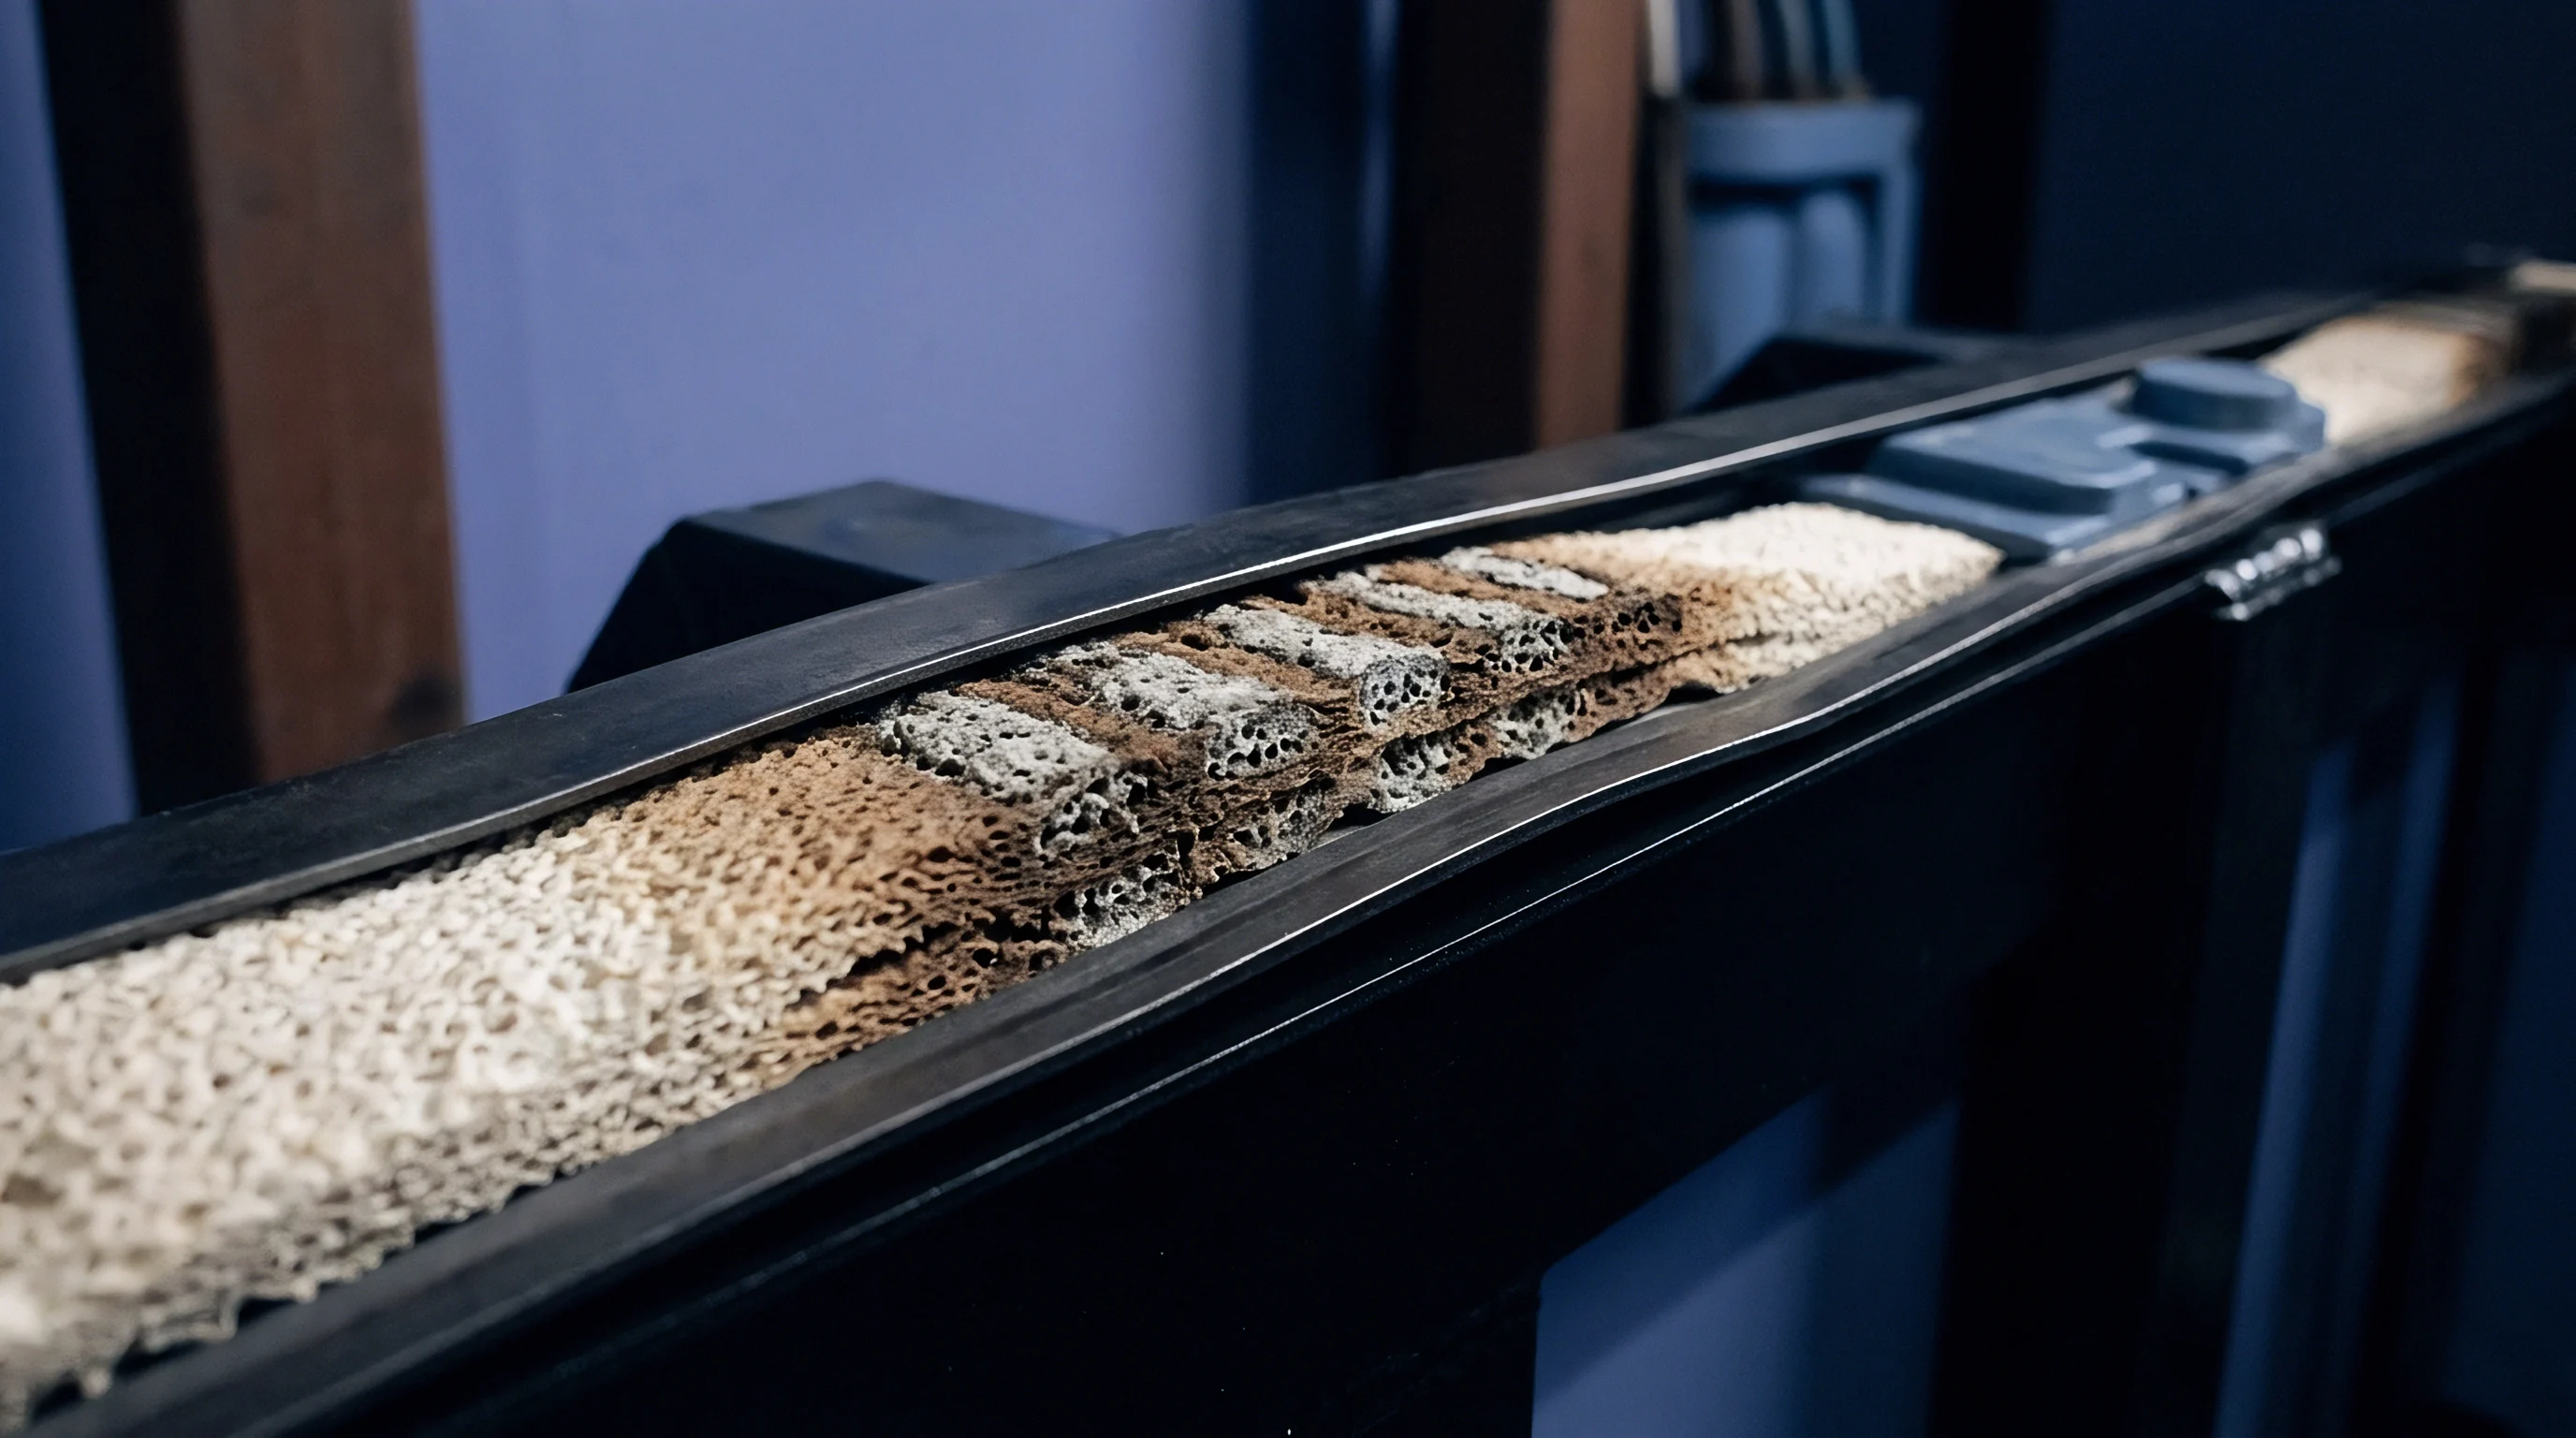
Reactor vessel geometry governs oxidant distribution and thermal dissipation during pre-treatment. Highly exothermic radical reactions occur when concentrated ozone contacts fine organic powders, making uniform gas dispersion and active cooling essential to prevent thermal runaway within the powder bed. Fluidized bed reactors and rotating calciners offer far better gas-solid contact than static tray arrangements.

Exotherm Mitigation and Gas Distribution
Heat generation during surface ozonolysis accelerates secondary oxidation pathways, turning targeted cross-linking reactions into destructive combustion. Diluting the ozone stream with carrier gases like dry air, oxygen, or nitrogen stabilizes localized reaction kinetics, while recirculation loops equipped with inline heat exchangers strip thermal energy from the gas before re-injection.
Gas flow rates must be matched to the powder bed fluidization velocity. Operating below minimum fluidization causes channeling, leaving dense pockets of unreacted material while over-oxidizing high-flow channels, accompanied by a sharp pressure drop.

Fluidized Bed Thermal Regimes
Maintaining gas velocities at or above minimum fluidization keeps particles in continuous motion against gravity. This movement prevents local hot spots and ensures uniform oxidant exposure across the entire batch. Gas-phase pre-oxidation in a production reactor proceeds through five distinct stages:
- Purge the processing volume with dry nitrogen to reduce ambient moisture below twenty parts per million.
- Elevate reactor core temperature to one hundred twenty degrees Celsius using indirect thermal jackets.
- Introduce ozone carrier gas at a controlled rate of two liters per minute per kilogram of material.
- Monitor effluent stream gas composition to maintain active oxidant absorption above eighty-five percent.
- Transition gas input to pure nitrogen and cool the batch to ambient conditions before transfer.
Defective thermal management during pre-treatment frequently masks poor closed pore volume as precursor variability rather than reactor gradient failure.

Metrics
Electrochemical testing evaluates anode performance in half-cell configurations against metallic sodium counter electrodes. Galvanostatic charge-discharge profiles reveal two primary capacity regions: a high-potential sloping region above zero point one volts and a low-potential plateau below zero point one volts. Slope capacity reflects ion adsorption on surface defects and heteroatoms, whereas plateau capacity stems from ion insertion into closed pores and interlayer spaces, expanding directly with closed pore volume.

Plateau Capacity versus Slope Contribution
Discharge curves display voltage regions corresponding to distinct storage mechanisms. Slope capacity dominates in materials with high surface defect counts and open microporosity, whereas plateau capacity dominates when closed pore volumes are high and surface roughness is low. A elevated ratio of plateau to slope capacity confirms effective optimization of the closed pore architecture.
Initial coulombic efficiency measures the proportion of sodium ions recovered on the first charge relative to the initial discharge. Open micropores trap ions through irreversible solid electrolyte interphase formation, consuming active electrolyte, whereas closed pores store ions reversibly without direct exposure to liquid solvent species.
High plateau capacity requires closed pores bounded by defect-free curved graphene domains rather than open surface micropores.
Electrolyte Interface Stability
Solid electrolyte interphase formation consumes active ions during initial charging. While electrolyte additives such as fluoroethylene carbonate help stabilize surface films on hard carbon anodes, minimizing open porosity restricts interphase formation strictly to the geometric exterior of the particle, reducing irreversible capacity losses.
Evaluation of hard carbon anode lots relies on specific analytical parameters:
- Initial coulombic efficiency threshold Mandates first-cycle charge-discharge efficiency exceeding eighty-eight percent in standard half-cell configurations to preserve cell balancing in full-cell formats.
- Low potential voltage plateau proportion Requires plateau capacity below zero point one volts to constitute at least sixty percent of total reversible discharge capacity.
- Small angle scattering intensity ratio Assesses low-q region scattering intensity to confirm closed pore nanovoid volume prior to cell assembly and testing.
- True density measured by helium Confirms skeletal density remains between one point four five and one point six zero grams per cubic centimeter.
Uncertainty remains regarding the precise thermodynamic state of sodium ions condensed within sub-nanometer closed voids at maximum state of charge.

Invoice
Commercial viability hinges on capital expenditure and operational costs per unit output. Pre-oxidation using high-concentration ozone gas adds operational overhead through the electrical power demand of dielectric barrier discharge generators. However, these operating costs are offset by mass yield gains during high-temperature carbonization and higher energy density in the finished cell.

Energy Balance and Generator Economics
Dielectric barrier discharge systems generate active species from pure oxygen streams, with ozone production consuming approximately seven to ten kilowatt-hours per kilogram. Optimizing oxidant concentration lowers overall gas consumption per kilogram of processed precursor powder, while total cost scales linearly with electric utility rates and oxygen feedstock purity.
In a baseline plant operating a ten-metric-ton per day precursor line, air pre-oxidation yields a raw-to-finished carbon mass yield of forty-two percent, or four thousand two hundred kilograms of hard carbon per day. Switching to ozone-assisted pre-oxidation increases yield to forty-eight percent, producing four thousand eight hundred kilograms per day from the same ten-ton precursor input. Producing six hundred additional kilograms of active material daily requires forty-eight kilograms of generated ozone, which consumes four hundred thirty-two kilowatt-hours of power.
At an electricity cost of ten cents per kilowatt-hour, daily operational expenditure rises by forty-three dollars and twenty cents ~ a cost easily offset by additional hard carbon product worth several thousand dollars at market prices.
Mass Yield Sensitivity Analysis
Carbon recovery percentages directly dictate raw material procurement volumes in continuous production. Ozone pre-treatment boosts fixed carbon yield by preventing the volatilization of lightweight aromatic fractions during early pyrolysis, reducing precursor procurement costs per kilogram of finished material.
| Processing Route | Precursor Cost ($/ton) | Yield to Carbon (%) | Energy Cost ($/ton output) | Finished Cost ($/kg) | Plateau Cap (mAh/g) |
|---|---|---|---|---|---|
| Baseline Air Oxidation | 1,200 | 42.0 | 180 | 3.04 | 180 |
| Low Ozone (1.0 vol%) | 1,200 | 45.5 | 215 | 2.85 | 210 |
| Optimized Ozone (3.0 vol%) | 1,200 | 48.2 | 240 | 2.73 | 245 |
| High Ozone (5.0 vol%) | 1,200 | 44.1 | 310 | 3.03 | 160 |
| Summary: Optimized ozone pre-oxidation minimizes finished hard carbon cost per kilogram while maximizing plateau electrochemical capacity. | |||||
Gas generator power demand represents the primary operational expenditure variance when introducing active oxidative pre-treatment to an established carbon production line.
A standard supply contract clause requiring a minimum initial coulombic efficiency of ninety percent shifts material rejection risk back to the powder synthesis vendor whenever pre-oxidation parameters drift outside target limits.