Electrochemical Screening Protocols for Initial Capacity Verification
Electrochemical capacity screening verifies incoming cell quality by standardizing discharge temperature, clamping pressure, and low C-rate C/10 baseline cycles.

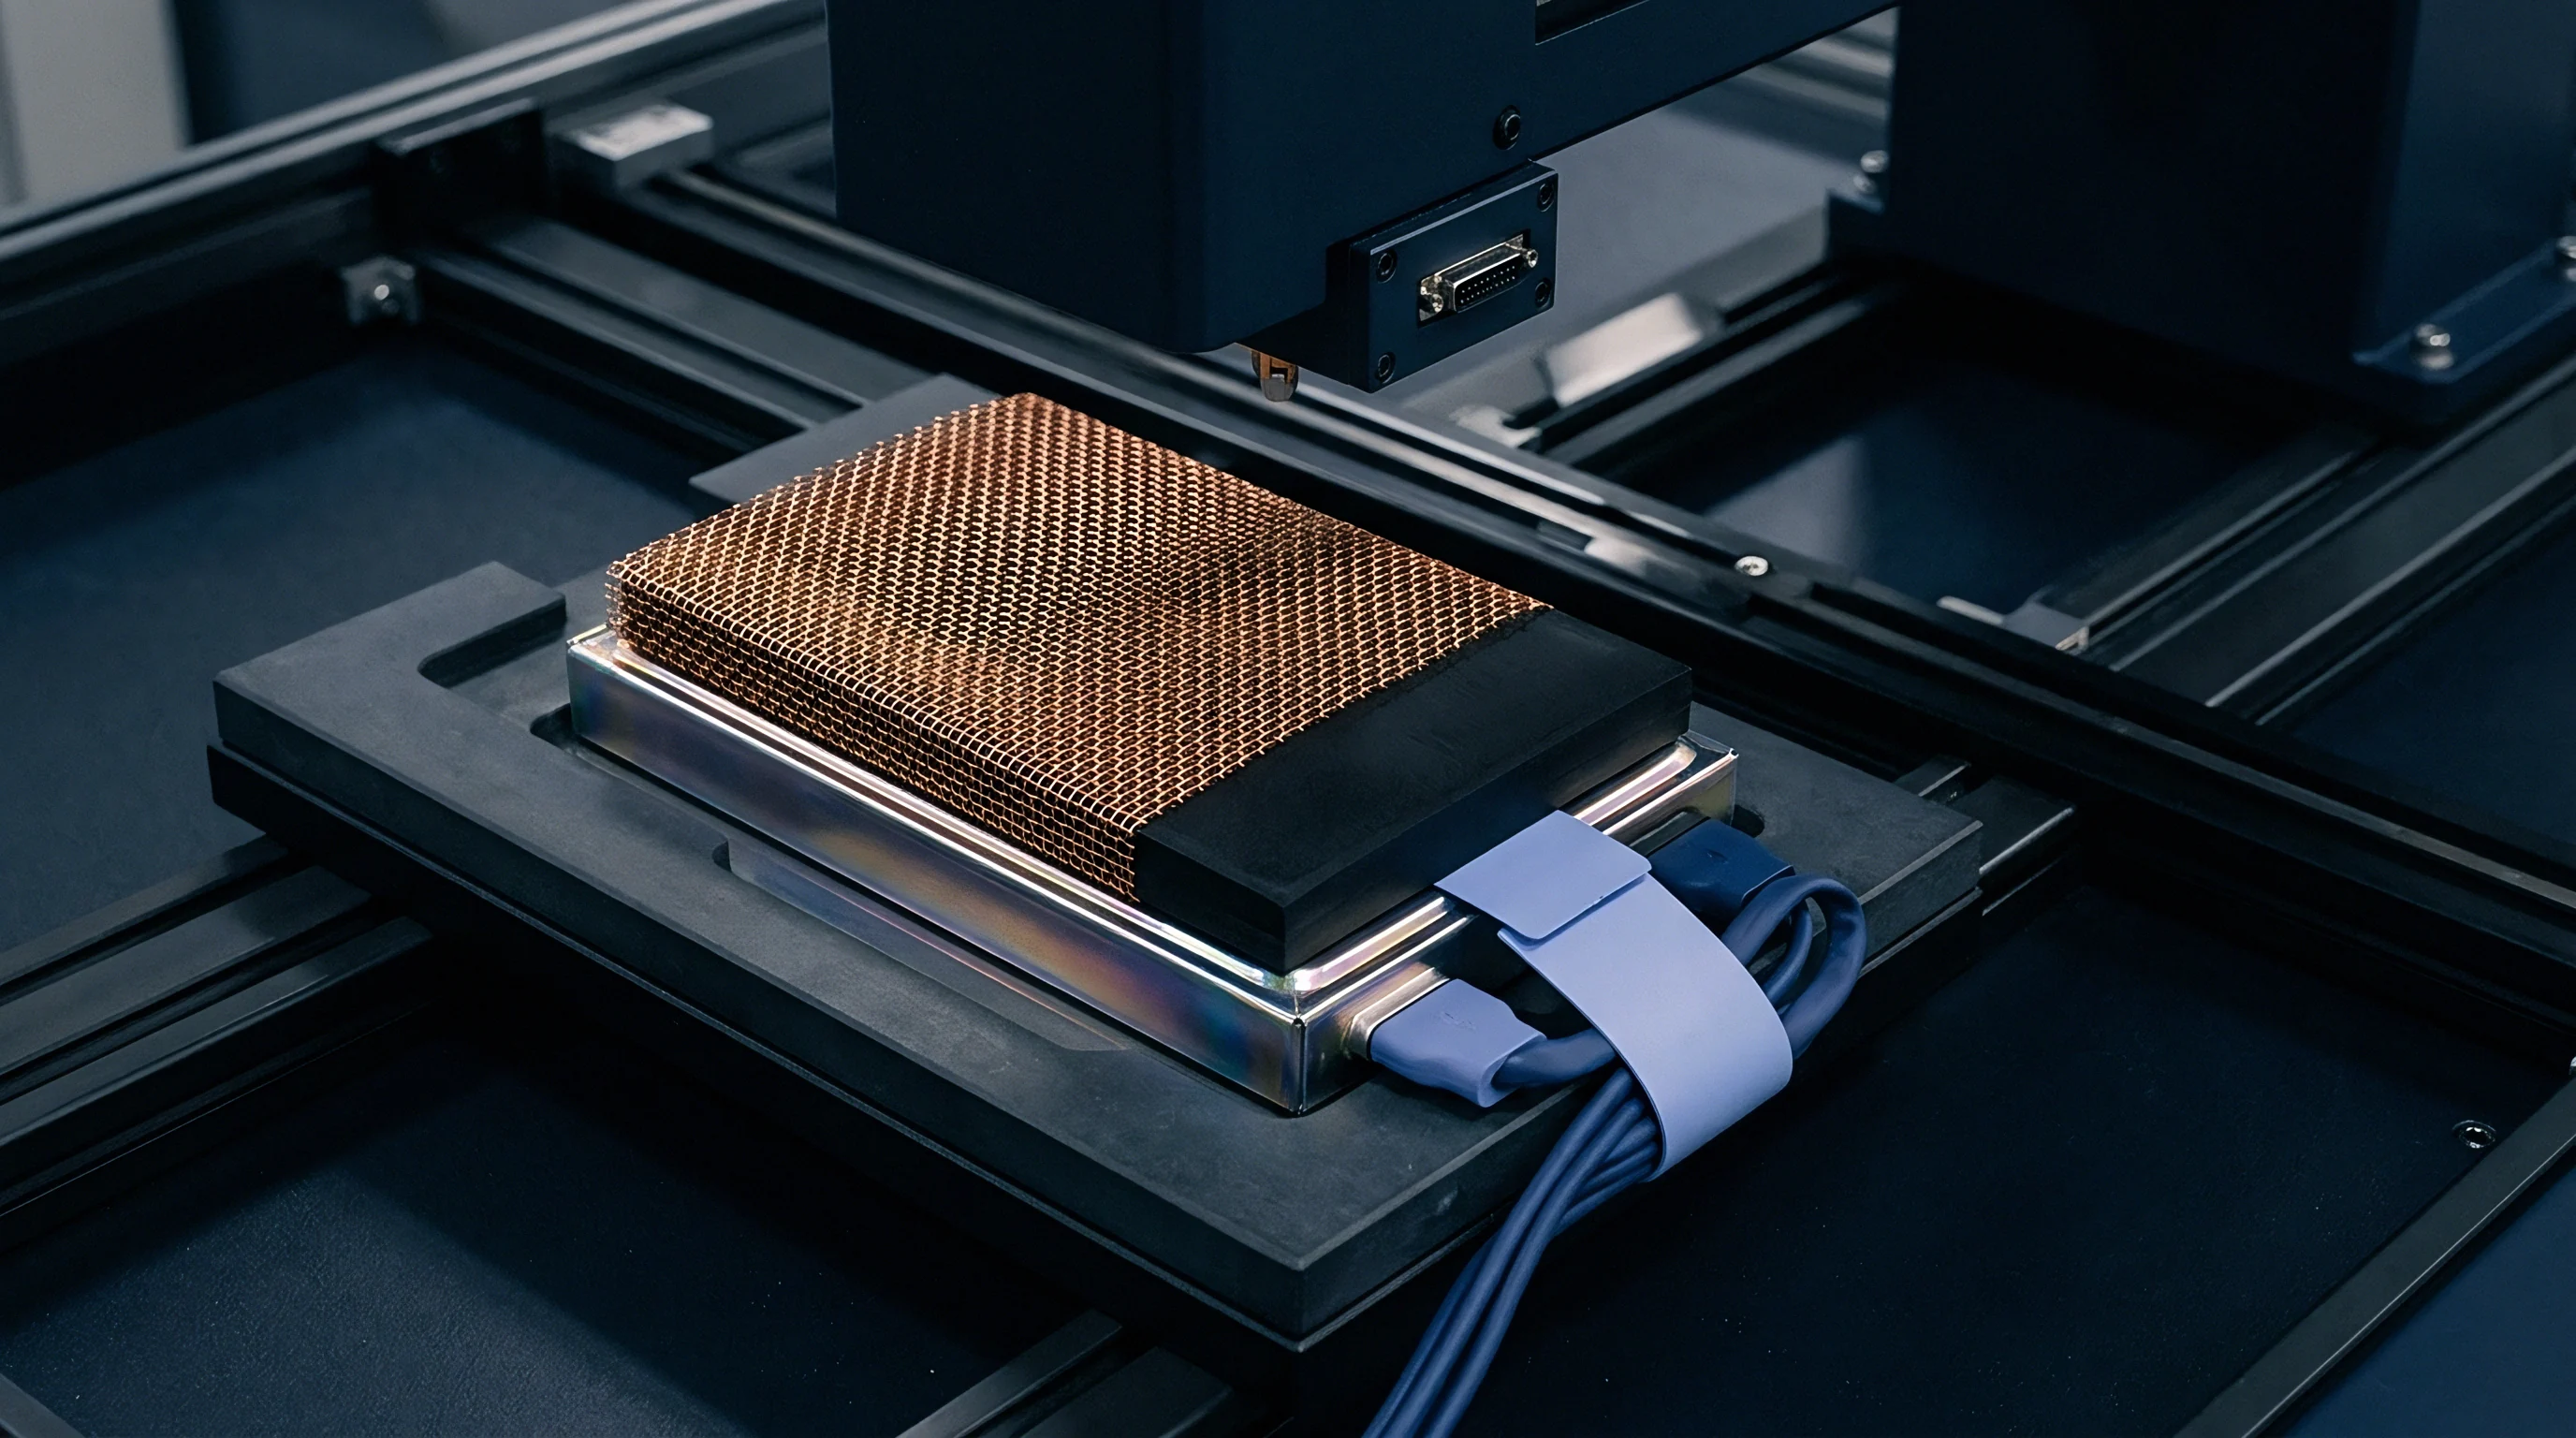
Origin
Manufacturing facilities perform initial formation cycling to establish the solid electrolyte interphase before shipping cells to buyers. During this factory phase, cells undergo one or two low C-rate charge-discharge cycles, typically at C/20 or C/10 rates under controlled temperature conditions between 25°C and 45°C. Factory test protocols record early baseline values, but these manufacturer records reflect ideal production-line conditions rather than the state of cells arriving at customer receiving docks. Storage duration, self-discharge, temperature exposure during transport, and mechanical settling alter cell electrochemistry prior to incoming qualification.
Impedance shifts baseline readings between factory testing and customer receipt. Freshly formed lithium-ion cells exhibit dynamic internal resistance during the first thirty days following production. Electrolyte species continue wetting dense ceramic-coated separators, while microscopic gas pockets generated during formation dissolve into ambient liquid electrolyte.
Capacity screening protocols executed immediately upon delivery must account for this transient electrochemical state, distinguishing temporary polarization shifts from actual material deficits.

Factory Formation Profiles and Baseline Capacity Metrics
Cell production ends with preliminary charge-discharge cycles designed to passivate internal surfaces rather than maximize discharge yields. Manufacturers record initial formation capacity on automated aging racks, storing these values in factory databases linked to two-dimensional matrix barcodes on cell cans. The factory rated capacity listed on vendor datasheets reflects the statistical average of these formation cycles under pristine thermal conditions.
Discrepancies arise when incoming screening runs fail to match datasheet ratings. A factory formation cycle executed at 45°C enhances lithium-ion mobility and lowers electrolyte viscosity, yielding an elevated initial amp-hour discharge figure. Testing those same cells upon arrival at 23°C without thermal conditioning produces lower measured capacity, triggering unnecessary lot rejections.
Screening specifications demand identical reference conditions, matching target charge cutoff voltages, end-of-charge taper currents, and environmental temperatures to factory test profiles.
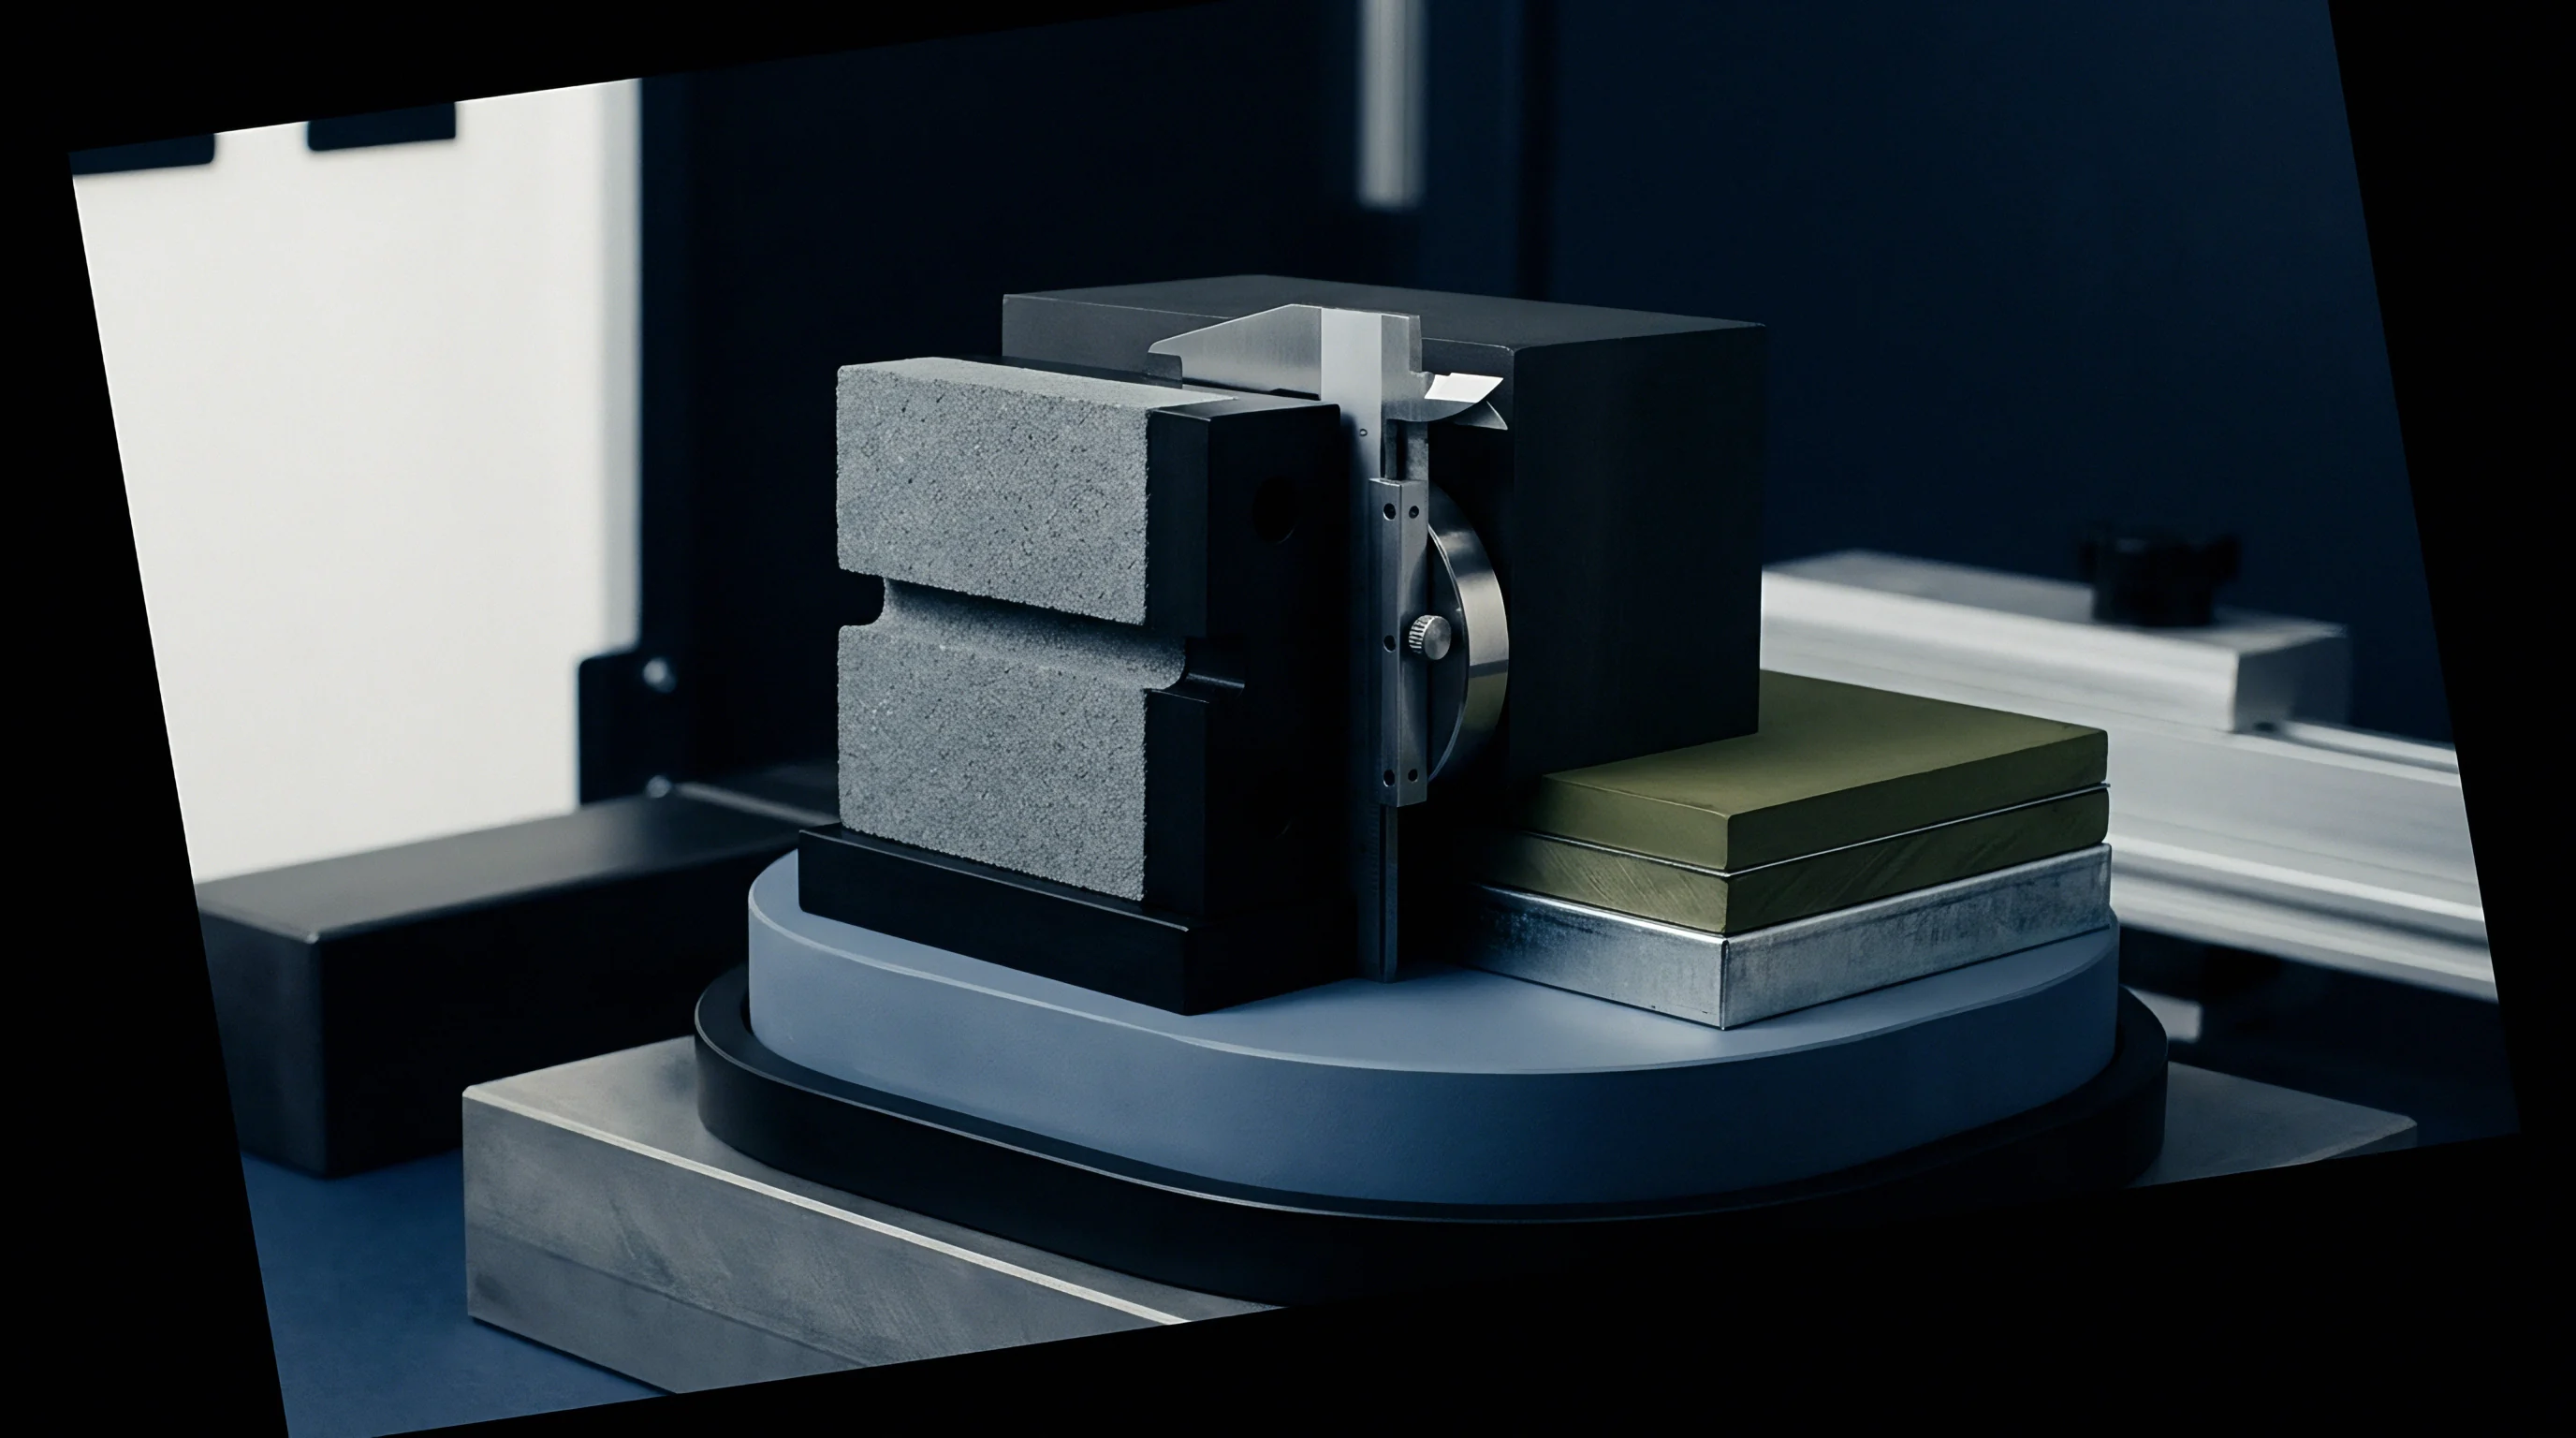
Initial Solid Electrolyte Interphase Formation and Irreversible Capacity Loss
Electrolyte components breakdown on graphite surfaces during early charge steps, consuming active lithium ions to build protective passivating films. This electrochemical reaction consumes between 5% and 15% of total lithium inventory during initial formation. The resulting irreversible capacity loss permanently sets the maximum available energy storage capacity of the cell.
Secondary growth of this passivating layer continues at reduced rates throughout early storage and initial screening cycles. High-nickel cathodes like NMC 811 and NCA experience ongoing surface restructuring, releasing trace oxygen and forming resistive rocksalt layers when stored at elevated charge states above 3.9 V. When screening protocol cycles consume additional lithium to repair micro-cracks in cathode particles, measured capacity drops slightly across consecutive baseline runs. Understanding whether a capacity deficit stems from ongoing passivation or active material loss forms the core of electrochemical screening logic.
Factory engineers routinely claim that early storage losses recover automatically during customer site commissioning.


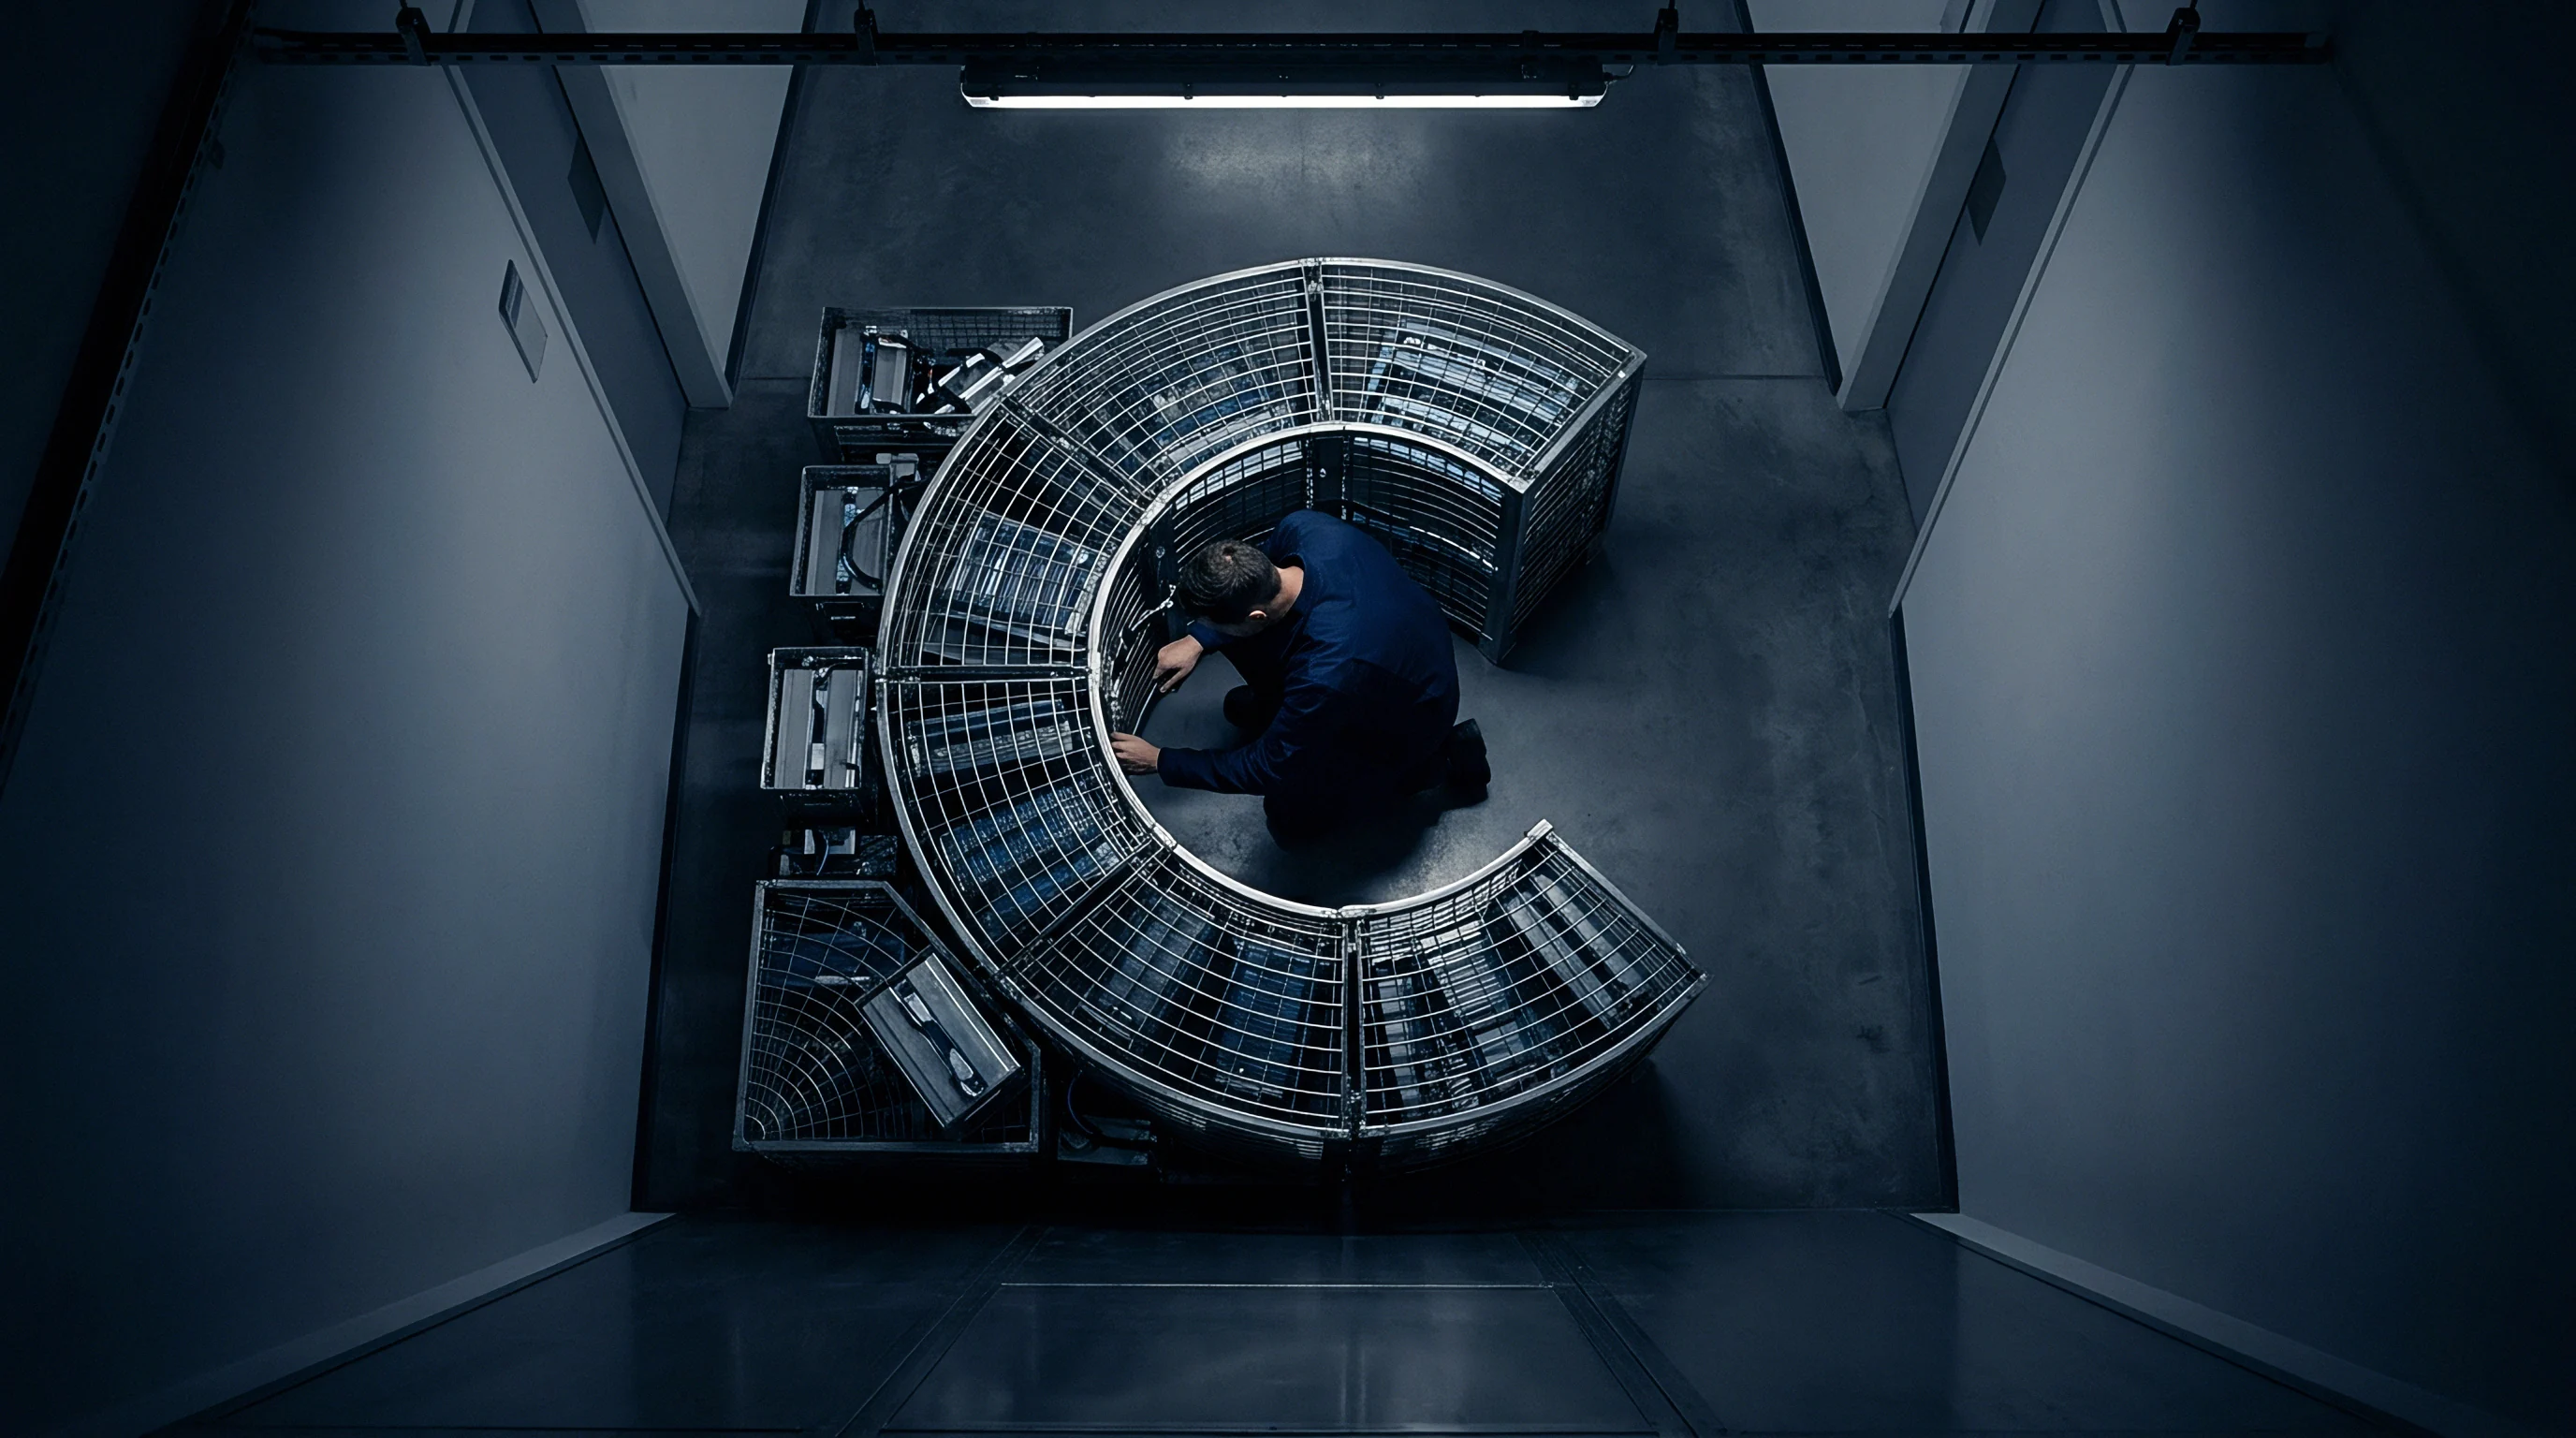
Crate
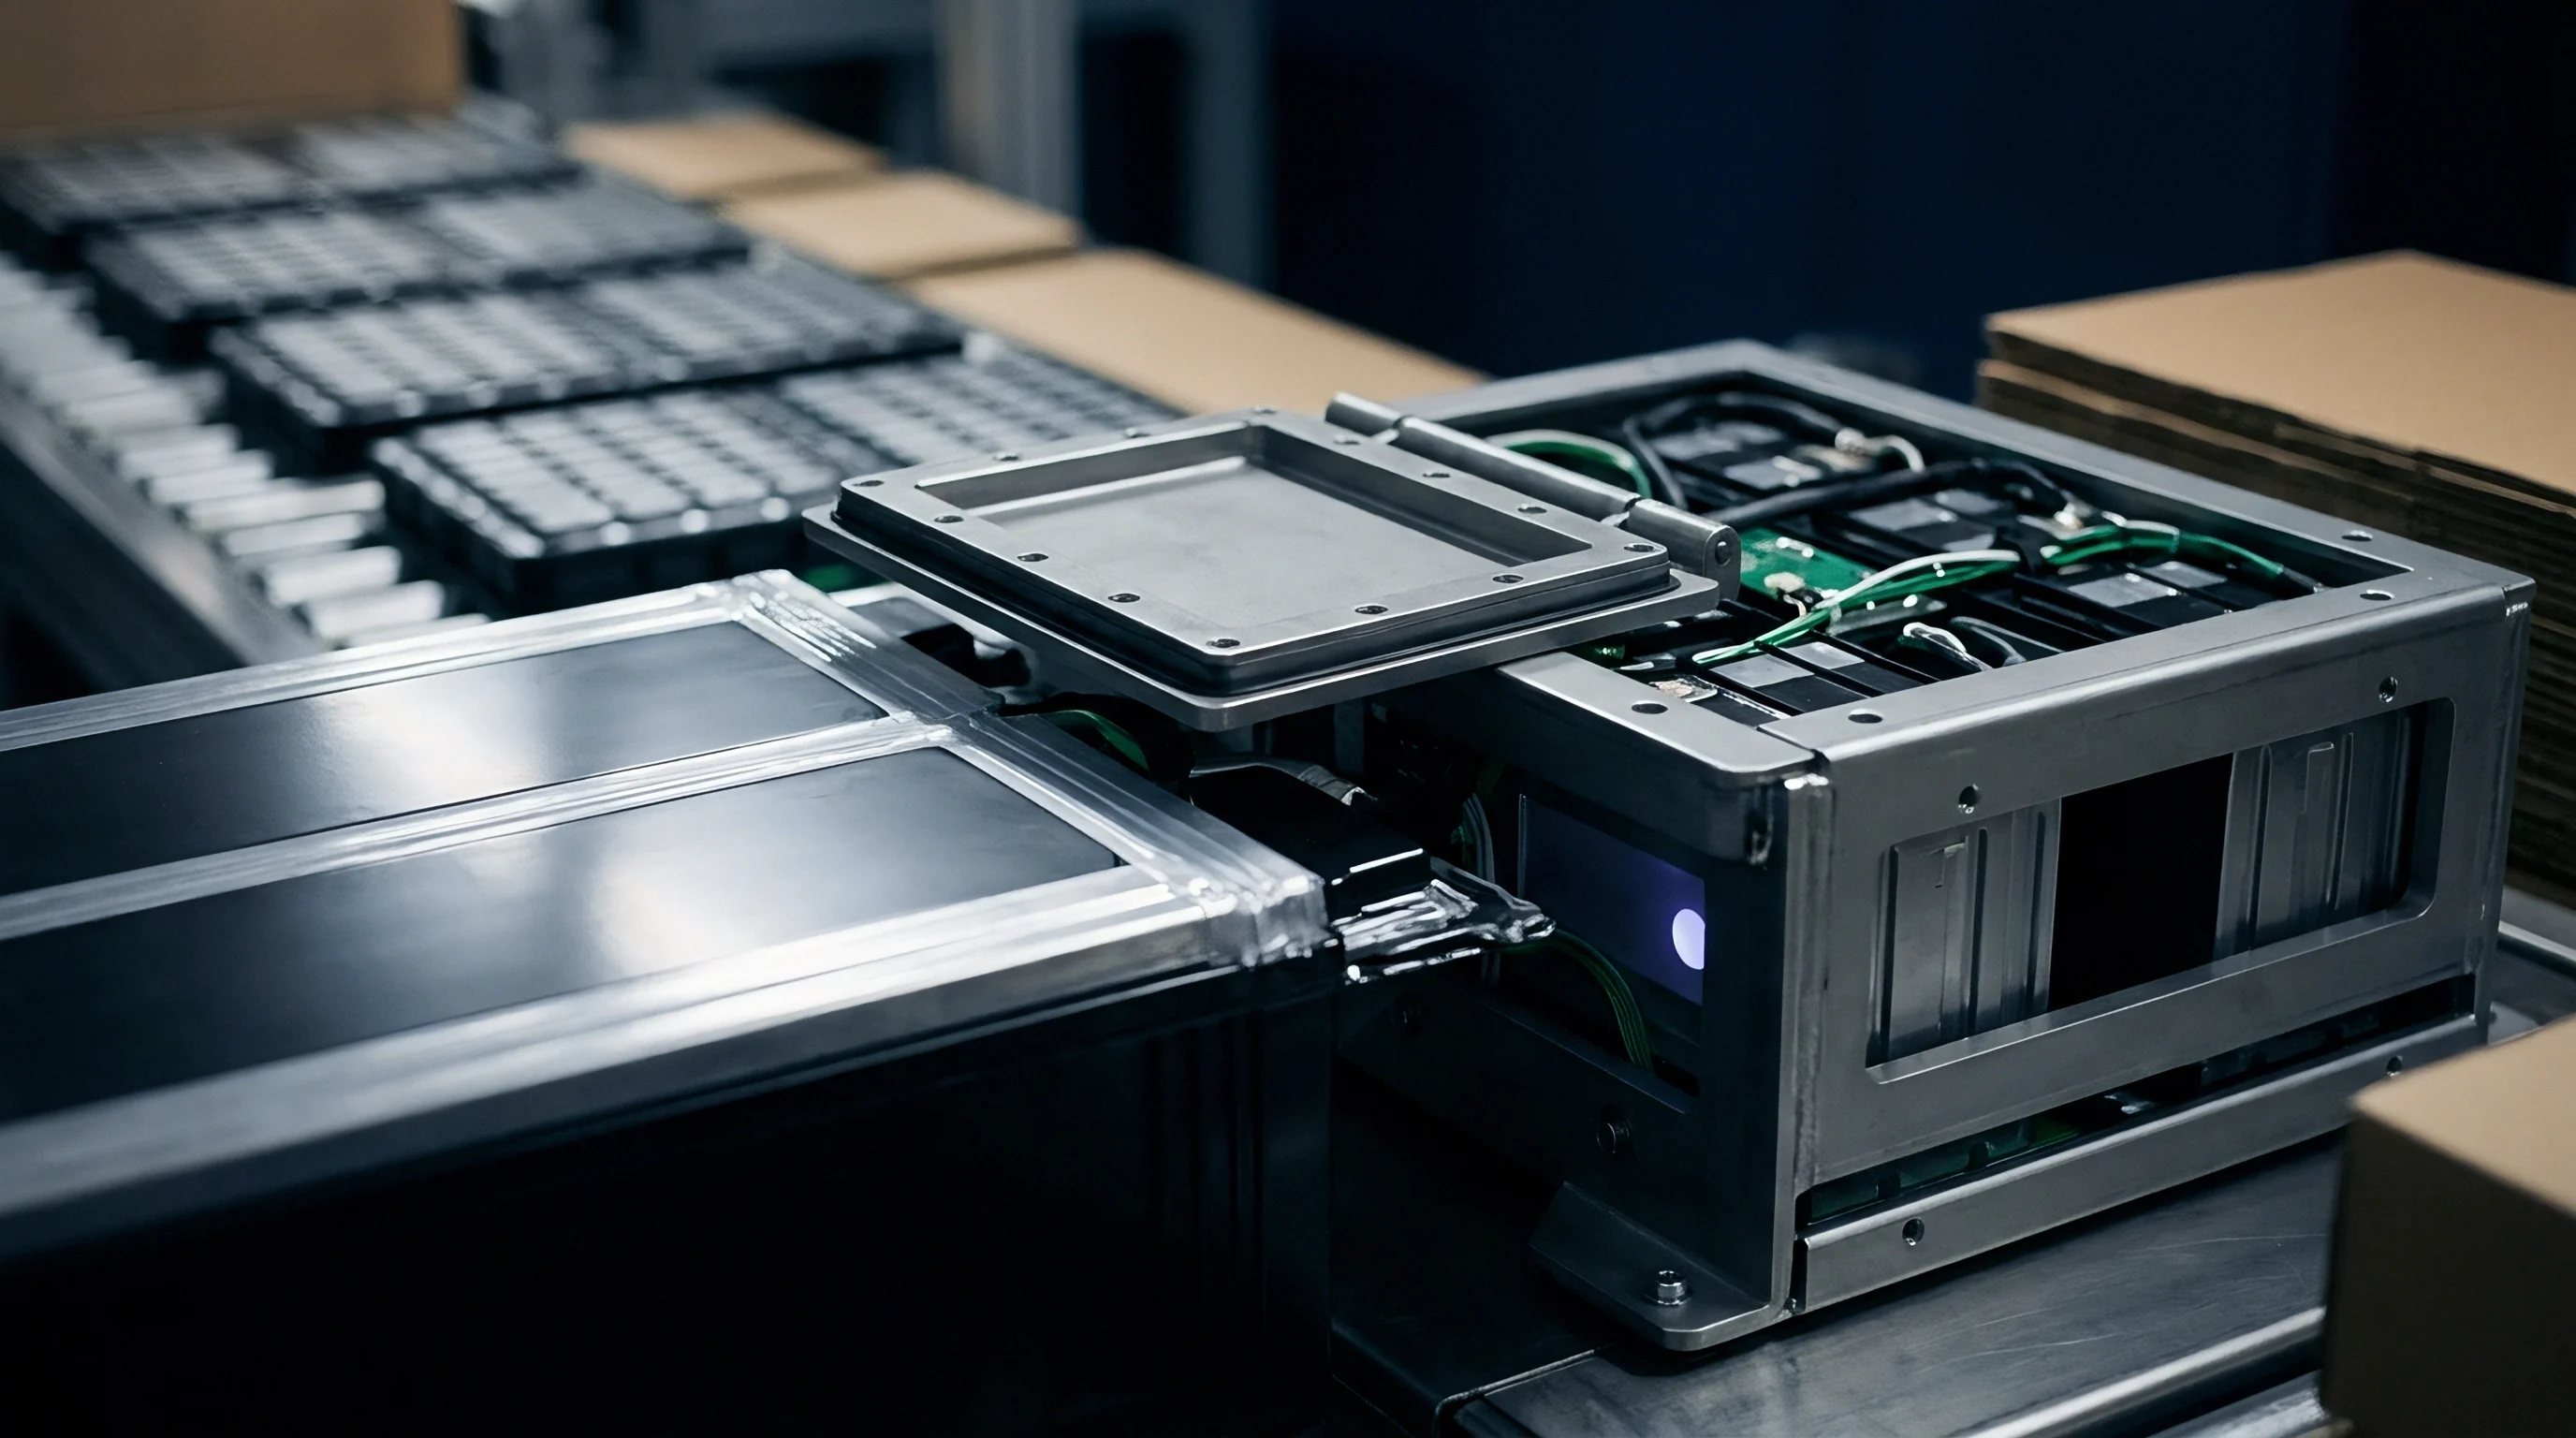
Incoming shipments endure mechanical shocks, ambient temperature swings, and prolonged open-circuit storage before reaching testing channels. Cells packed inside shipping crates experience thermal gradients where outer rows cool or heat faster than core modules. Thermal histories directly influence the rate of parasitic side reactions and self-discharge during transit.
Shipping containers stored at 35°C during ocean transit lose approximately two percent of initial charge state per month through accelerated parasitic side reactions.
Storage temperature historical records provide context for initial open-circuit voltage measurements. A cell arriving at receiving with lower voltage may simply have experienced higher transit temperatures rather than possessing an internal short circuit. Screening protocols must include a thermal stabilization soak before subjecting cells to electrical load.

Thermal Exposure and Transit Stabilization Steps
Ambient fluctuations during sea or air transport skew initial open circuit readings and internal resistance measurements. Cold cell cores increase electrolyte viscosity, elevating bulk ohmic resistance and causing artificial voltage drops during early galvanostatic discharge steps. Screening cold cells produces false low-capacity failures due to premature voltage cutoffs.
Cell stabilization requires holding incoming crates in a temperature-controlled environment at 25°C for a minimum of 24 hours prior to screening. Prismatic and large format pouch cells require up to 48 hours to reach thermal equilibrium across their core mass. Verification of core temperature equality across sample batches prevents measurement noise during initial discharge runs.

Clamping Pressure and Mechanical Restraint during Screening
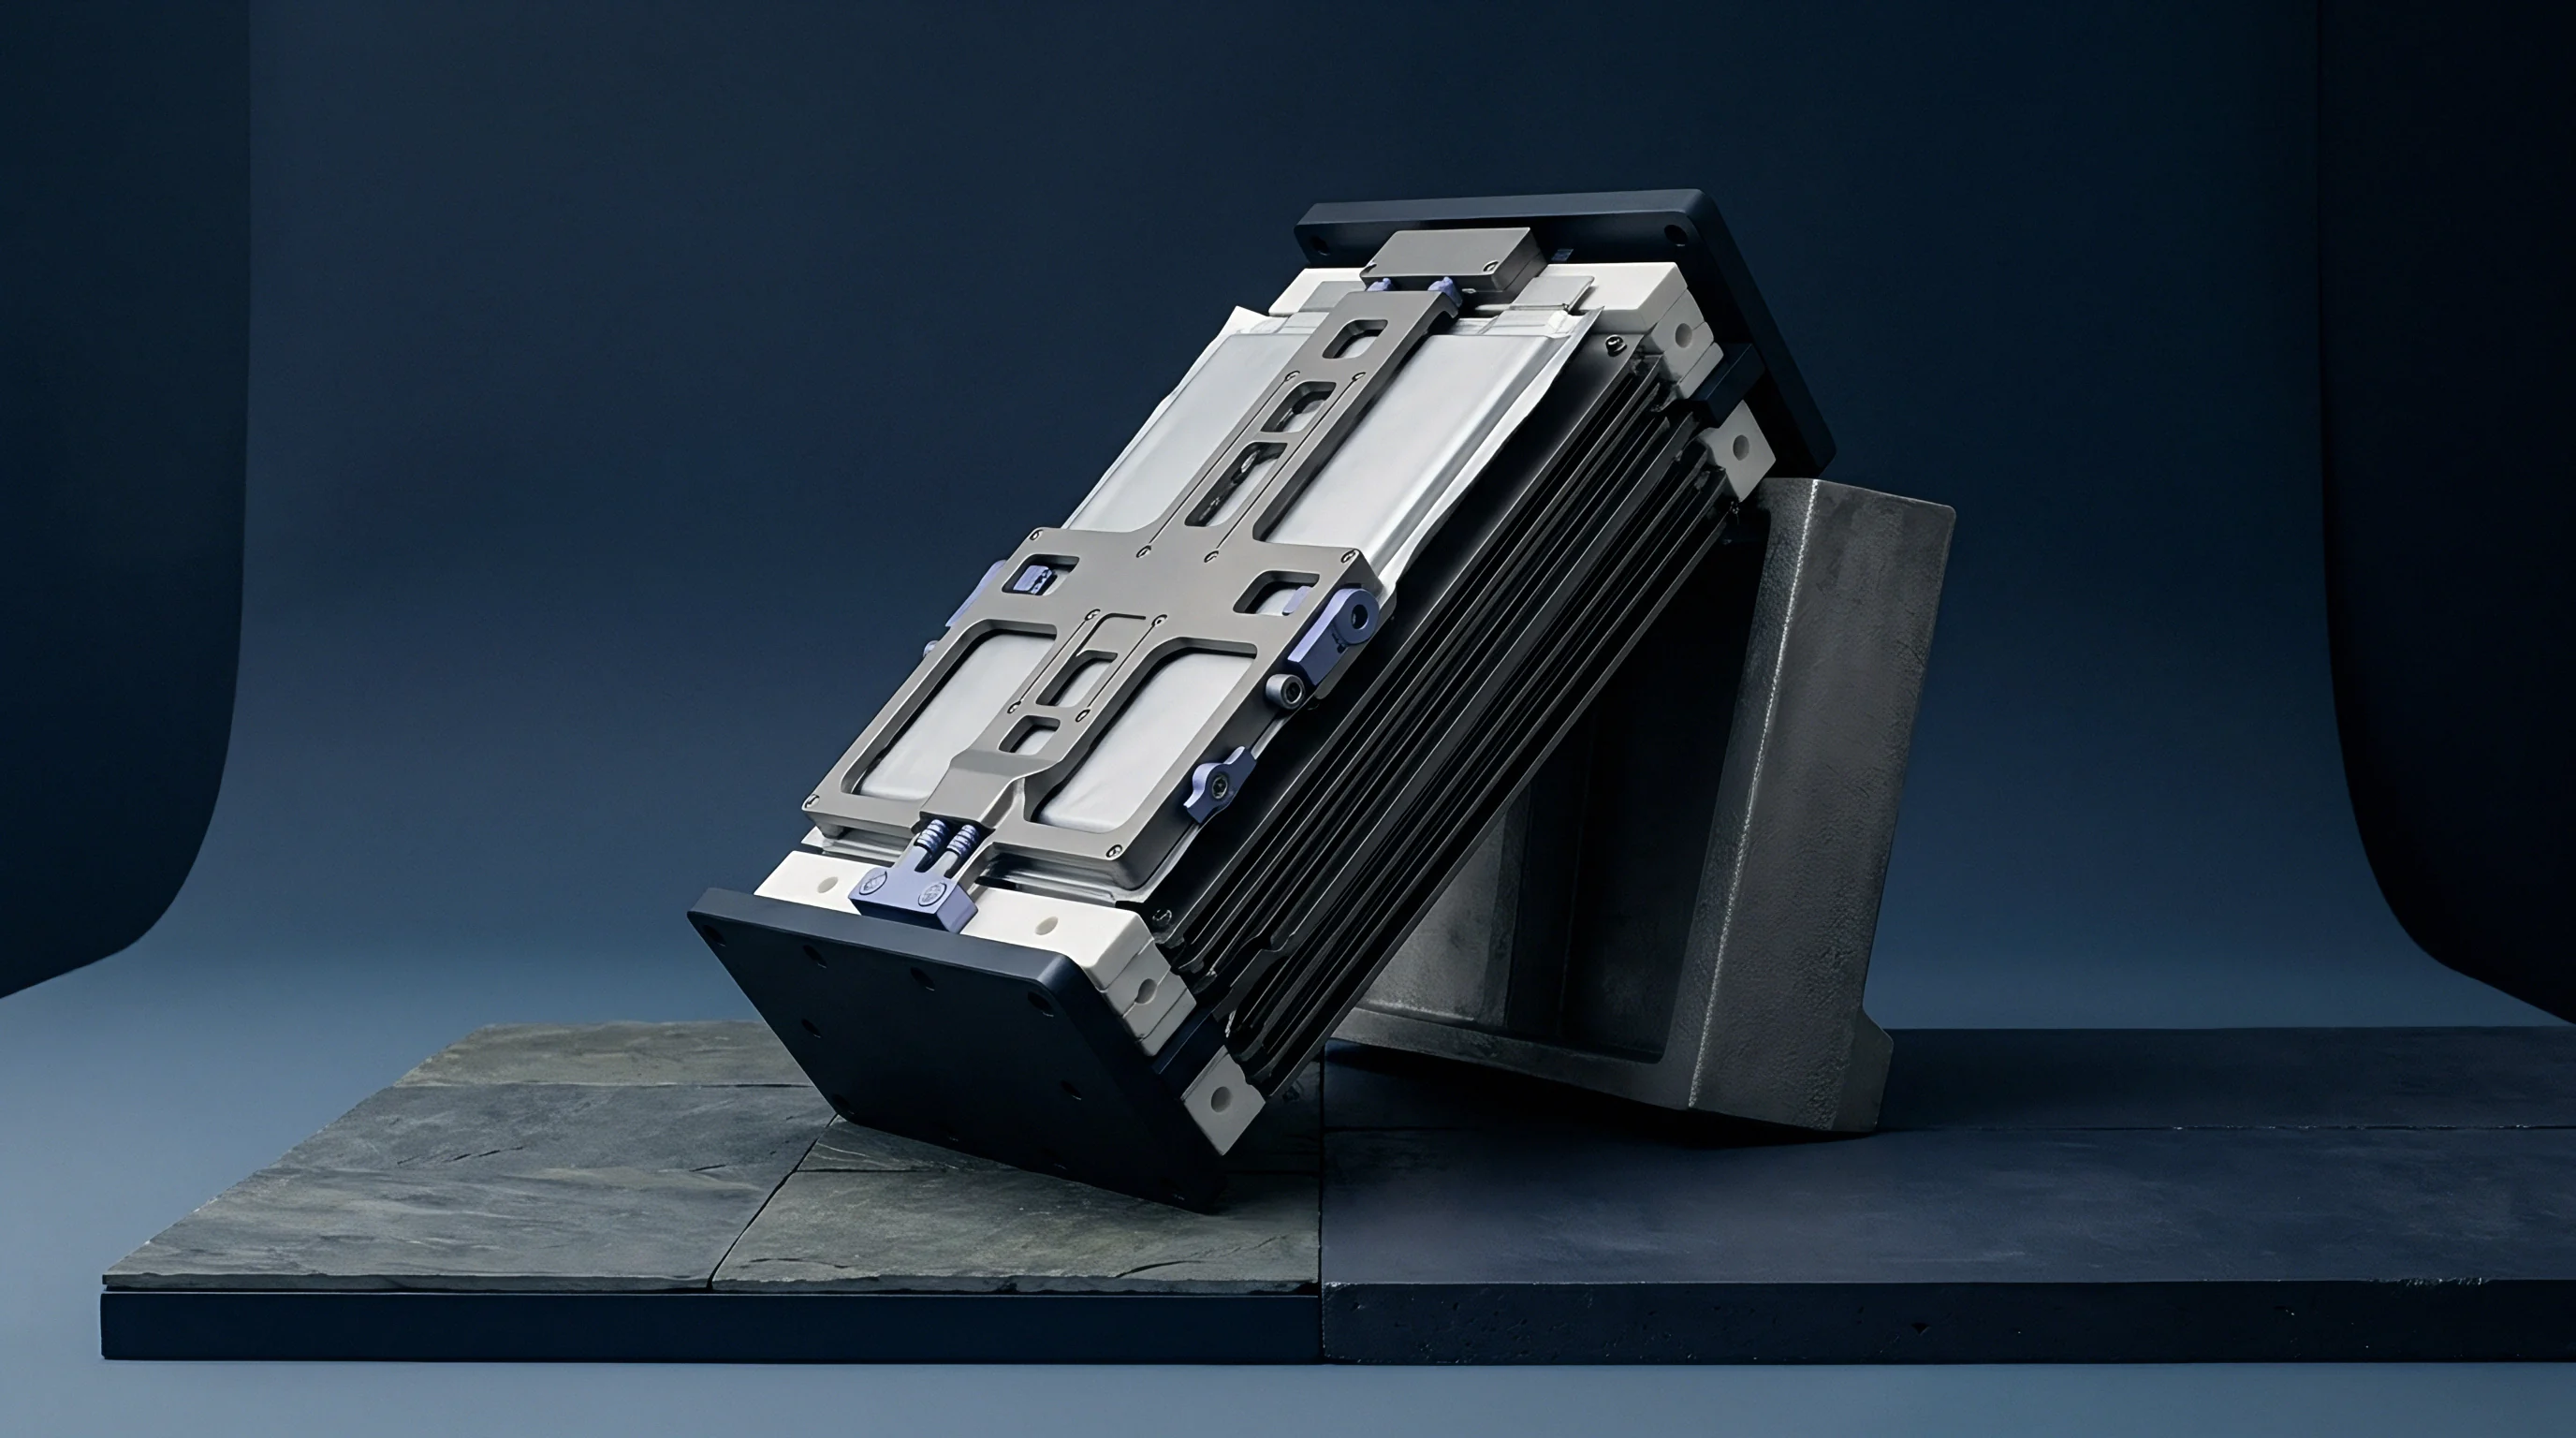
Pouch and prismatic geometries expand under lithium intercalation, generating internal mechanical stresses that alter electrode distance and ionic diffusion paths. Unrestrained pouch cells suffer localized delamination between electrode plates during initial cycling, leading to uneven current distribution and reduced measurable capacity. Proper screening protocols require standardized mechanical fixtures applying uniform compressive force across cell faces.
Fixtures designed for capacity screening utilize calibrated spring plates or torque-limited bolts to deliver pressures between 0.3 MPa and 0.8 MPa. Applying insufficient clamp force allows gassing micro-voids to isolate active electrode areas, lowering measured amp-hours. Excess compression damages separator micro-pores, creating localized high-current hot spots that accelerate lithium plating during screening charges.
| Transport Thermal Profile | Restraint Pressure (MPa) | Measured Initial Capacity (% Nominal) | 1 kHz AC Impedance Variance (%) |
|---|---|---|---|
| Isothermal 20°C | 0.5 | 101.2 | +0.4 |
| Excursion 45°C (14 days) | 0.5 | 98.7 | +4.2 |
| Isothermal 20°C | 0.0 (Unrestrained) | 96.8 | +12.1 |
| Excursion -10°C (7 days) | 0.5 | 99.1 | +1.8 |
Incoming lot acceptance screening identifies physical and electrochemical anomalies before cells enter battery module build streams.
- Micro-short self-discharge accelerates voltage decay during transit, dropping open-circuit voltage below standard storage limits prior to screening.
- Separator compression deformation occurs under excessive mechanical pallet stacking, increasing localized high-frequency AC impedance.
- Terminal post oxidation creates artificial contact resistance on test fixtures, distorting constant-voltage taper detection during screening charges.
- Electrolyte phase separation develops during extreme sub-zero transport excursions, requiring thermal conditioning cycles to re-establish dynamic ionic equilibrium.
Ignoring transit history during initial acceptance testing results in paying top-tier prices for pre-degraded inventory that fails prematurely in field deployment.

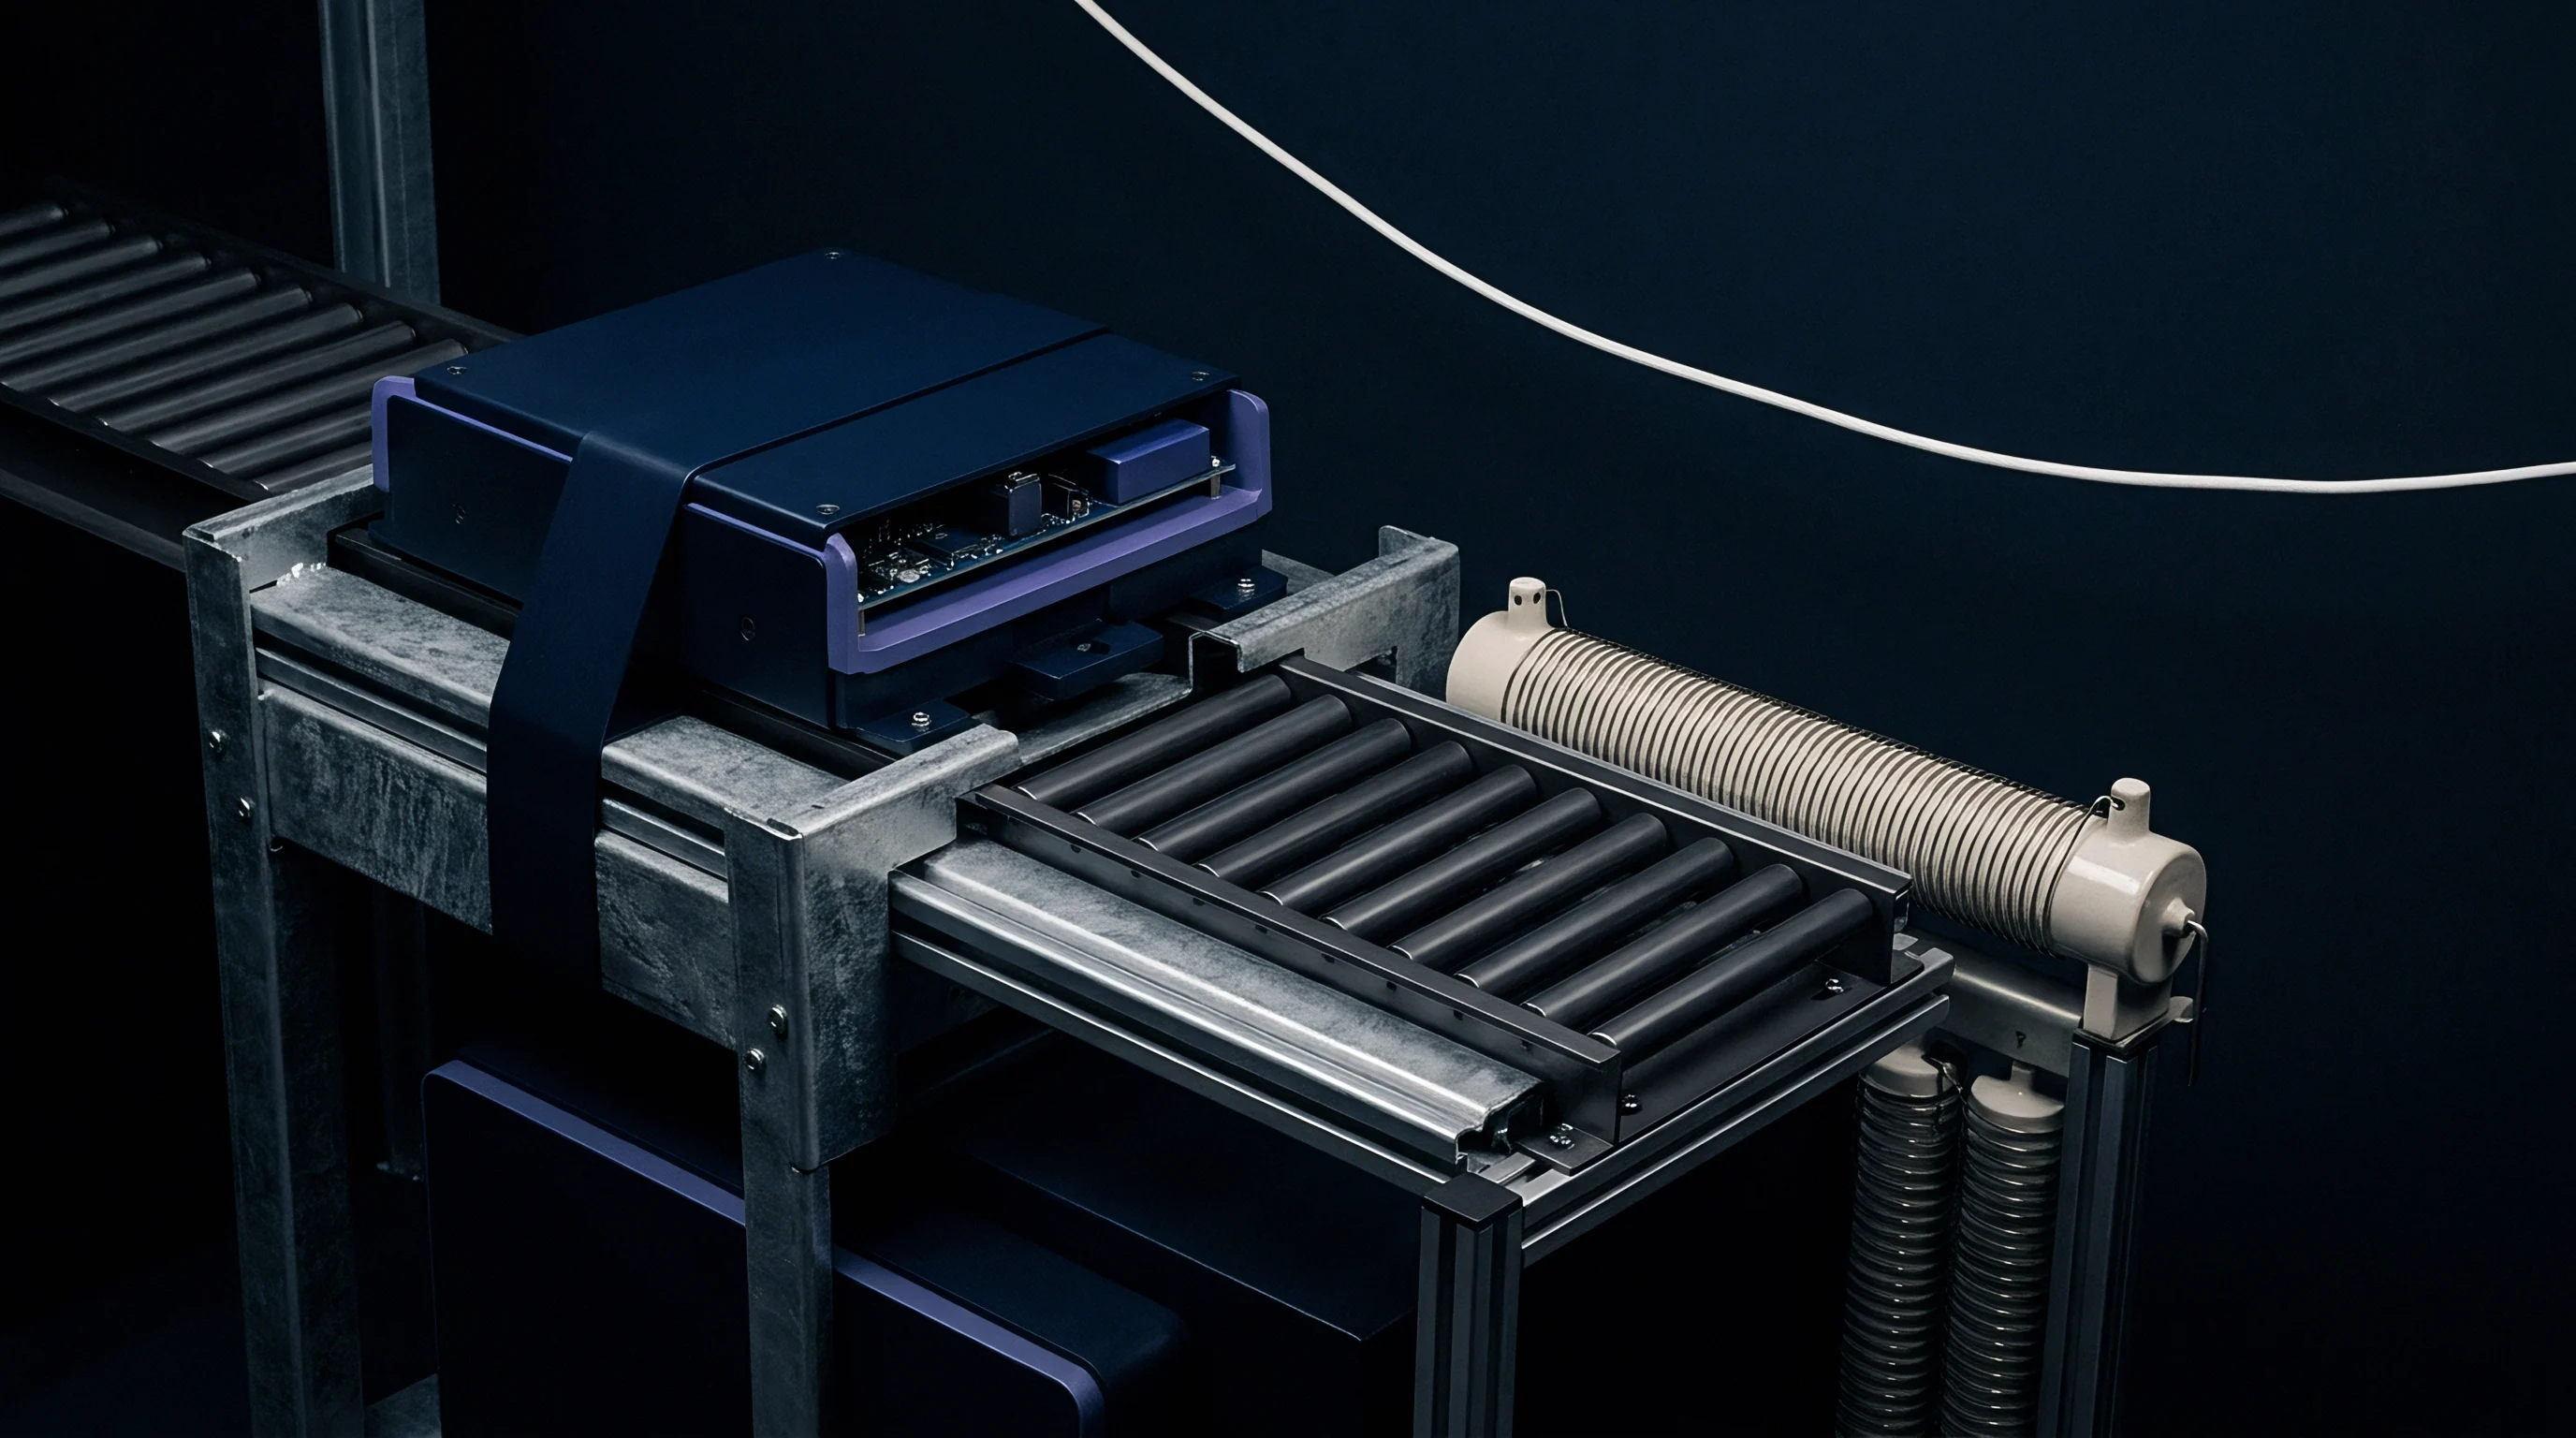
Bench
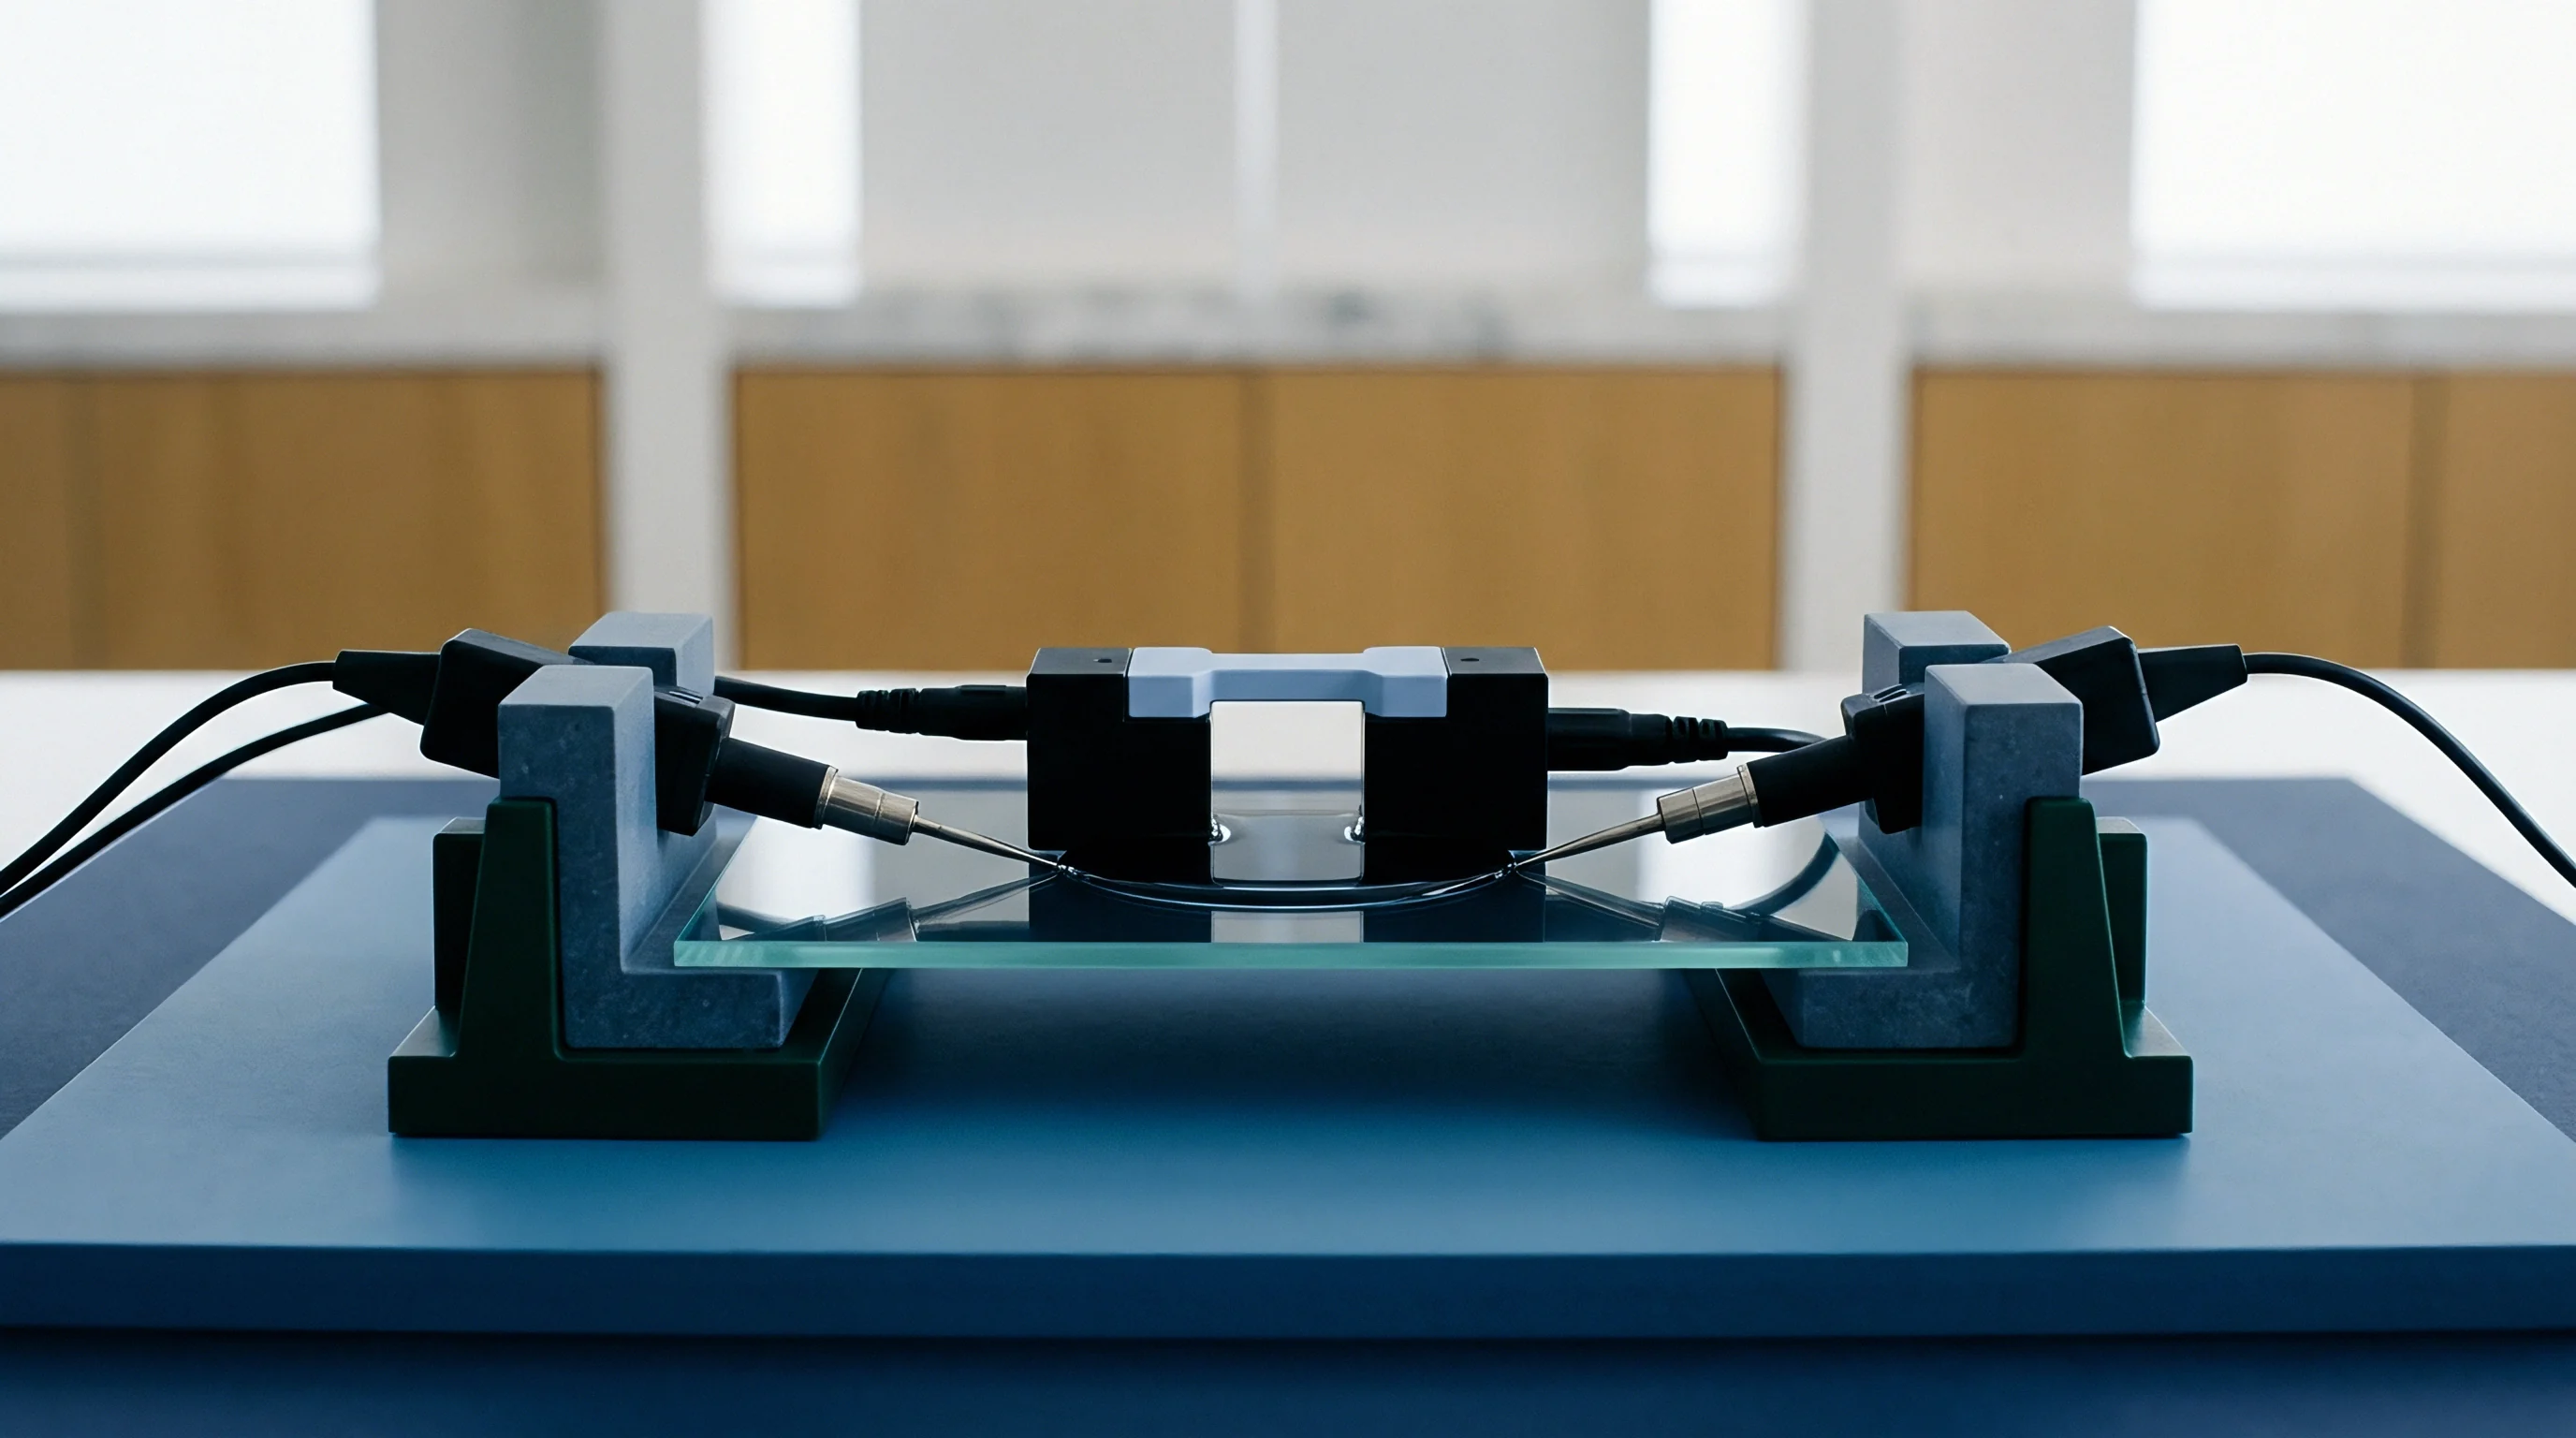
Electrochemical characterization requires controlled laboratory environments, high-precision test channels, and defined voltage-current profiles. Capacity screening is not a simple charge-discharge test; it measures true usable energy while protecting active material structures. Channel calibration, current accuracy within 0.05% of full scale, and voltage sensing precision at 0.1 mV sensitivity determine screening validity.
Test channels utilize four-wire Kelvin sensing contacts to eliminate lead wire voltage drops. When test leads carry high currents, contact resistance across crocodile clamps or spring pins introduces millivolt-level measurement errors. A 5 mV error on a 2.8 V discharge cutoff premature termination drops recorded capacity by up to 1.5% on steep LFP discharge curves.

Galvanostatic Constant Current Constant Voltage Cycling Parameters
Low discharge rates reveal the true active inventory within lithium host structures by minimizing polarization overpotentials. Screening protocols execute galvanostatic discharge steps at C/10, C/5, or C/3 rates based on chemistry specification limits. Charge steps utilize constant current constant voltage (CCCV) regimes, terminating the CV phase when charging current tapers down to C/50 or C/100 thresholds.
Incorporating IEC 61960 Clause 7.3 directly into purchase contracts replaces loose vendor declarations with enforceable discharge thresholds at identical ambient temperatures.
Charge cutoff criteria dictate initial capacity saturation levels. Setting charge taper currents too high leaves available intercalation sites unoccupied, resulting in lower measured discharge capacity on subsequent steps. Conversely, over-charging through elevated voltage cutoffs induces surface electrolyte oxidation and cathode dissolution, flatting screening repeatably metrics.

Rest Duration and Open Circuit Voltage Relaxation Analysis
Chemical species need sufficient time after current interruption to relax concentration gradients within liquid electrolyte and solid electrode particles. Rest steps inserted between charge and discharge steps allow internal cell potential to stabilize toward true open circuit voltage. Insufficient rest periods blend dynamic polarization overpotentials into subsequent discharge capacity runs.
Rest durations between 30 minutes and 2 hours ensure internal thermodynamic relaxation. Monitoring open-circuit voltage decay during rest periods provides immediate diagnostic data regarding solid interphase stability. Unusually rapid voltage relaxation during rest steps signals micro-shorting or high self-discharge behavior before full discharge testing completes.
Are Initial Capacity Variations Predictable across Cell Lots?
Production batches exhibit narrow statistical distributions when manufactured under identical raw material lots and coater settings. Variance widens across different manufacturing lots due to slight tolerances in active slurry coating weight, electrolyte fill volume, and separator thickness. Screening protocols detect these lot-to-lot shifts before cell blending operations.
- Mount cells inside thermal chamber set to 25.0°C ± 0.5°C with Kelvin sensing clamps attached to cell terminals.
- Rest cell under open-circuit condition for 120 minutes until voltage drift falls below 0.2 mV per hour.
- Charge cell at constant current C/10 rate until upper cutoff voltage limit is reached, maintaining voltage until current tapers to C/100.
- Discharge cell at constant current C/10 rate down to minimum manufacturer cutoff voltage while recording integrated amp-hour output.
| Chemistry | Charge Cutoff (V) | Discharge Cutoff (V) | Rest Time (min) |
|---|---|---|---|
| LFP (Lithium Iron Phosphate) | 3.65 | 2.50 | 60 |
| NMC 811 (Nickel Manganese Cobalt) | 4.20 | 2.80 | 90 |
| NCA (Nickel Cobalt Aluminum) | 4.20 | 2.75 | 90 |
| LTO (Lithium Titanate) | 2.80 | 1.50 | 30 |
Incorporating IEC 61960 Clause 7.3 directly into purchase contracts replaces loose vendor declarations with enforceable discharge thresholds at identical ambient temperatures.

Arithmetic
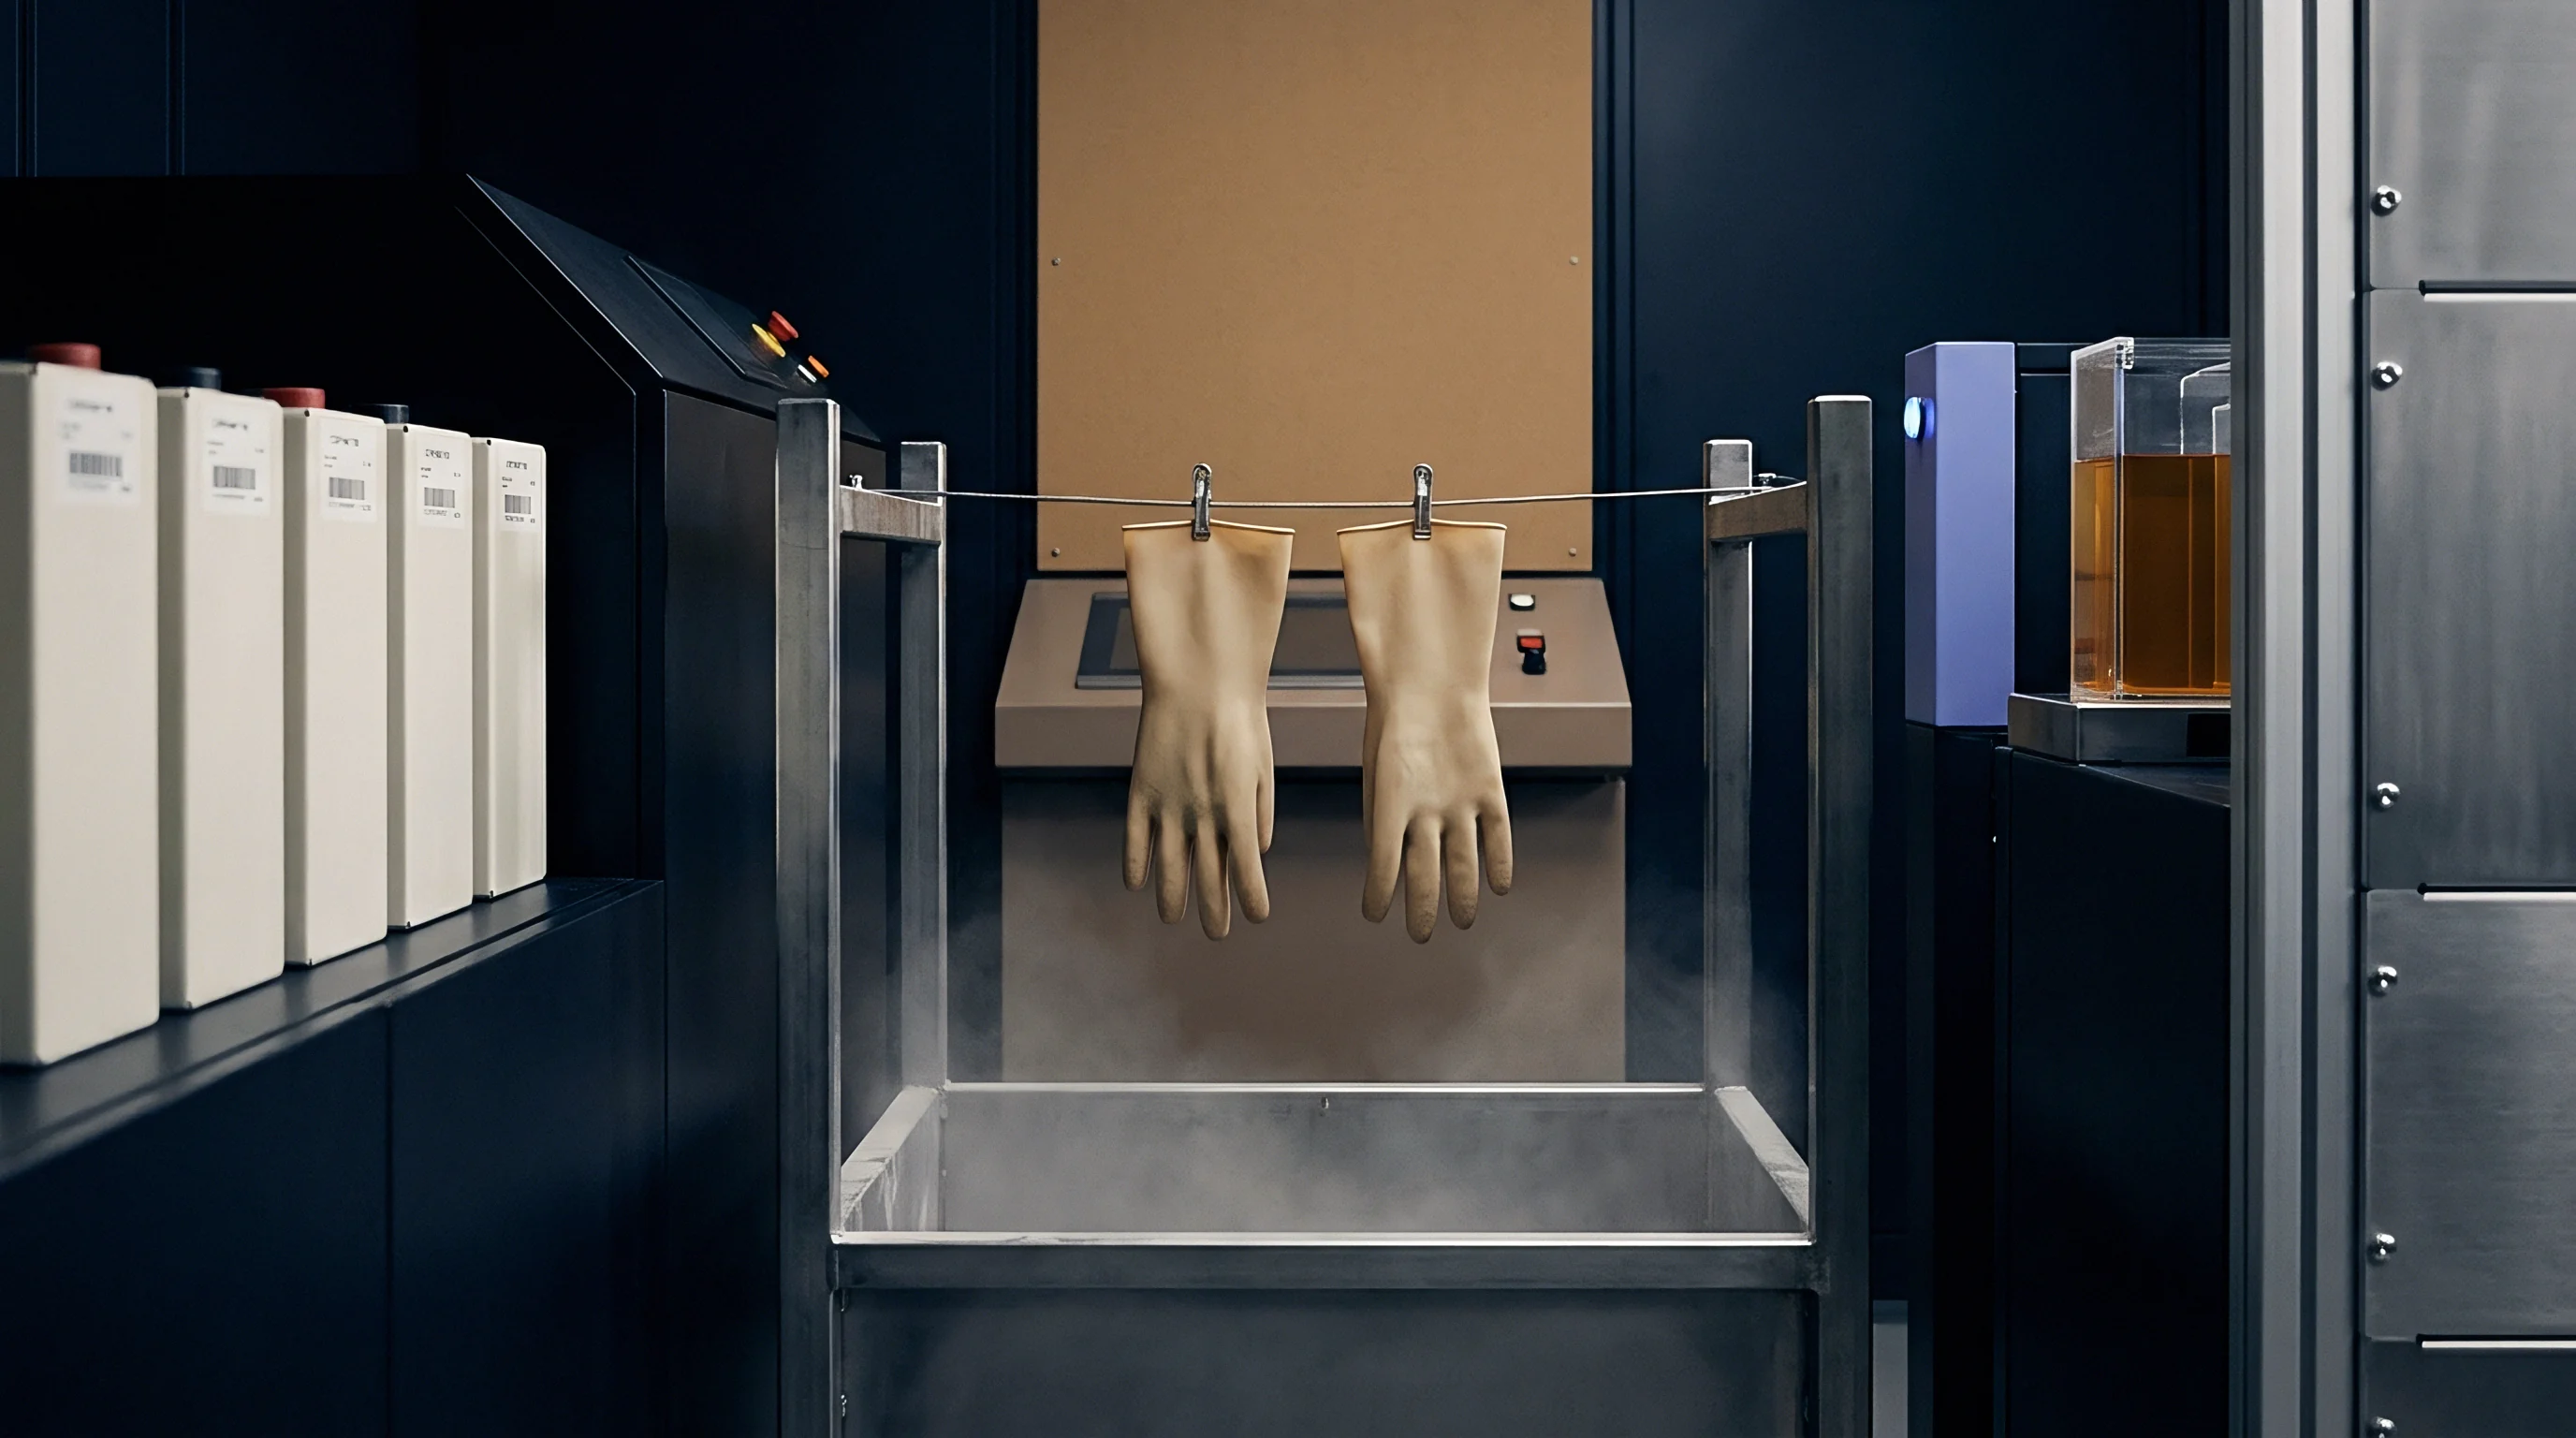
Data collected from screening channels undergoes mathematical processing to extract capacity figures, coulombic efficiency ratios, and statistical variance metrics across incoming lots. Converting raw current and time time-series arrays into integrated ampere-hour (Ah) values requires high-frequency integration using Simpson’s rule or trapezoidal numerical integration. Sampling frequencies below 1 Hz introduce integration error during rapid current transition phases.
Temperature correction math normalizes discharge output to standard 25°C reference values. Battery capacity varies by approximately 0.5% to 1.0% per degree Celsius depending on chemistry and discharge rate. Operating screening channels in ambient rooms at 20°C artificially depresses measured capacity by up to 4%, falsely triggering vendor non-conformance claims unless mathematical temperature compensation is applied.

Mathematical Modeling of Discharged Capacity and Temperature Normalization
Raw amp-hour readings fluctuate based on internal temperature during galvanostatic steps. Discharged capacity calculation follows the time integral of measured current:
Q_dis = ∫ I(t) dt
where Q_dis is total discharged capacity in Ah, I(t) is instantaneous current in amperes, and t is discharge time in hours. Normalizing measured capacity to 25°C uses an Arrhenius thermal correction factor:
Q_norm = Q_meas /
where Q_norm is normalized capacity, Q_meas is measured capacity, T_meas is average core temperature during discharge in °C, and α is the chemistry-specific thermal capacity coefficient (typically 0.008 per °C for LFP cells between 15°C and 35°C).
Worked Case Screening Calculation for Commercial Cell Acceptance
Evaluating a shipment of 50,000 lithium iron phosphate cells with 280 Ah nominal output illustrates the screening workflow. Sampling protocols under ANSI/ASQ Z1.4 Level II General Inspection specify a sample size of 500 cells selected randomly across all shipping pallets. Screening channel logs yield an average measured discharge capacity of 276.4 Ah at an average test chamber temperature of 21.5°C under C/10 discharge conditions.
Applying temperature correction math calculates true normalized baseline capacity:
Q_norm = 276.4 /
Q_norm = 276.4 /
Q_norm = 276.4 / = 276.4 / 0.972 = 284.36 Ah
Temperature normalization reveals that the actual capacity delivers 284.36 Ah, exceeding nominal specification (280 Ah) by 1.55%, despite raw bench readings showing a 3.6 Ah deficit.
Raw discharge readings recorded at 21.5°C understate true ambient capacity by nearly three percent when uncorrected for thermal transport dynamics.
Coulombic efficiency calculation compares discharged capacity against preceding charge capacity:
CE = (Q_dis / Q_ch) 100
For the sample lot, average charge input equals 285.80 Ah, yielding an initial coulombic efficiency of:
CE = (284.36 / 285.80) 100 = 99.496%
Initial coulombic efficiency values below 99.2% on C/10 screening runs signal ongoing parasitic side reactions, electrolyte contamination, or active lithium consumption due to localized plating. Statistical pass-fail thresholds reject lots where the 3-sigma capacity distribution falls below minimum contractual limits.
Statistical process control uses z-score evaluation to define lot rejection bounds:
Z = (Q_limit – Q_mean) / σ
where Q_mean is sample mean capacity, Q_limit is minimum contractual capacity (280.0 Ah), and σ is sample standard deviation. Assuming σ = 1.8 Ah for the tested sample:
Z = (280.0 – 284.36) / 1.8 = -4.36 / 1.8 = -2.42
A Z-score of -2.42 corresponds to an estimated non-conformance rate of approximately 0.78% across the entire 50,000-cell lot, which falls within acceptable quality limits (AQL) under standard commercial procurement terms.
Cooler baseline measurements consistently understate actual cell capability while hot screening runs hide active material defects.

Fade
Distinguishing early irreversible side reactions from true active decay requires diagnostic analysis beyond simple amp-hour integration. Initial capacity screening must differentiate between temporary lithium inventory trapping and permanent cathode crystal lattice destruction. Differential capacity analysis converts subtle voltage plateaus into defined diagnostic peak curves.
Peak shifting on dQ/dV curves reveals specific thermodynamic failure modes. As cells undergo early cycling, changes in peak height and voltage position indicate whether capacity losses stem from loss of lithium inventory, loss of active positive material, or loss of active negative material. Early identification prevents building packs from cells with active particle cracking.
Differential Capacity Analysis for Early Phase Degradation Identification
Plotting derivative charge changes against cell potential translates subtle chemical transitions into distinct mathematical peaks. Differential capacity curves (dQ/dV versus V) serve as non-destructive electrochemical biopsies of incoming cells during C/10 screening runs.
| dQ/dV Feature Shift | Potential Region (V) | Primary Chemical Mechanism | Impact on Long-Term Cycle Life |
|---|---|---|---|
| Peak height reduction (Graphite) | 3.15 – 3.30 | Loss of active lithium inventory (SEI growth) | Linear, predictable baseline capacity roll-off |
| Peak voltage shift (Cathode) | 3.65 – 3.85 | Increased internal resistance / Polarization | Accelerated voltage cutoff under high C-rates |
| Peak area collapse (NMC) | 4.05 – 4.18 | Cathode transition metal dissolution | Rapid non-linear capacity drop-off (Knee point) |
| Asymmetric peak broadening | 2.85 – 3.00 | Inhomogeneous current density distribution | Localized lithium plating risk during fast charge |
Differential capacity signature tracking identifies sub-grade cell batches before thermal and cycle life testing reveals macro failures.
Peak area loss at high potential regions indicates structural cathode breakdown rather than benign solid interphase growth.

Active Material Dissolution versus Solid Interphase Reorganization
Structural shifts within cathode lattices release transition metal ions like manganese, nickel, or cobalt into liquid electrolyte. Dissolved metal ions migrate across the separator to the graphite anode, poisoning the protective interphase layer and triggering ongoing secondary lithium consumption. This degradation pathway reduces measured capacity continuously across initial screening cycles.
Reorganization of the solid electrolyte interphase behaves differently, stabilizing after two or three baseline cycles. Solid interphase growth consumes lithium ions without destroying cathode host structures. Tracking the rate of capacity change across three consecutive screening cycles isolates continuous chemical degradation from self-limiting passivation dynamics.
- Stable interphase passivation exhibits exponentially decaying capacity loss across three consecutive screening cycles, flattening to zero decay.
- Cathode particle cracking produces constant linear capacity decay between consecutive low C-rate screening cycles.
- Lithium plating onset manifests as an asymmetric plateau during open-circuit voltage rest steps immediately following charge termination.
- Electrolyte oxidation displays elevated charging capacity relative to discharge capacity, dropping coulombic efficiency below 99.0%.
The precise threshold where microscopic particle cracking transitions into unrecoverable capacity loss across varied nickel-rich chemistries remains uncertain.


Paperwork
Technical testing results convert directly into legal leverage during commercial quality disputes. Purchase agreements and supply contracts define mandatory cell specifications, acceptable quality levels, and incoming lot inspection protocols. A screening report showing initial capacity deficits provides zero contractual protection unless testing methodologies align precisely with contractually mandated standards.
Vendor datasheets and certificates of analysis (CoA) report factory-gate metrics that frequently conflict with incoming dock bench testing. CoAs present batch average capacity values recorded under manufacturer formation conditions. Contracts must define explicit empirical screening criteria, specifying exact equipment tolerances, ambient thermal bounds, rest durations, and sampling methodology required for lot rejection enforcement.

Mapping Bench Verification Metrics to Purchase Specifications
Translating laboratory capacity outputs into purchase contract parameters eliminates ambiguity during lot acceptance reviews. Purchase specifications must explicitly reference international test standards like IEC 61960-3 or UL 2580 while incorporating customized thermal compensation rules developed during bench characterization.
Contractual capacity tolerances define minimum acceptable single-cell capacity alongside total lot average minimums. A shipment may deliver a compliant overall average amp-hour rating while containing individual cells with unacceptable capacity variance. Restricting maximum cell-to-cell capacity variance to within ±1.5% of lot mean prevents severe pack-level cell unbalance during field operation.

Commercial Dispute Resolution and Rejection Protocol Mechanics
Vendor negotiations depend on rigorous data generated under mutually accepted test parameters. Rejection protocols specify mandatory re-testing timelines and third-party laboratory arbitration clauses when vendor CoAs conflict with buyer screening reports. Upon generating non-conforming screening data, written notice including raw time-series channel files must be transmitted to the supplier within 30 days of shipment receipt.
Third-party validation laboratories must use identical Kelvin-sensing hardware and thermal chambers to resolve capacity disputes. If independent testing confirms a capacity deficit exceeding contractual AQL limits, contract clauses mandate full lot replacement, supplier-funded scrap processing, or financial rebates equal to the missing energy capacity value.
Aligning empirical screening data with contractually binding acceptance limits enforces vendor compliance before payment releases.