Establishing Laboratory Qualification Protocols for Evaluating Lithium Iron Phosphate Capacity Retention
Laboratory qualification of LiFePO4 cells demands precise mechanical clamping, strict IEC cycling regimes, and Arrhenius acceleration to verify true capacity retention.
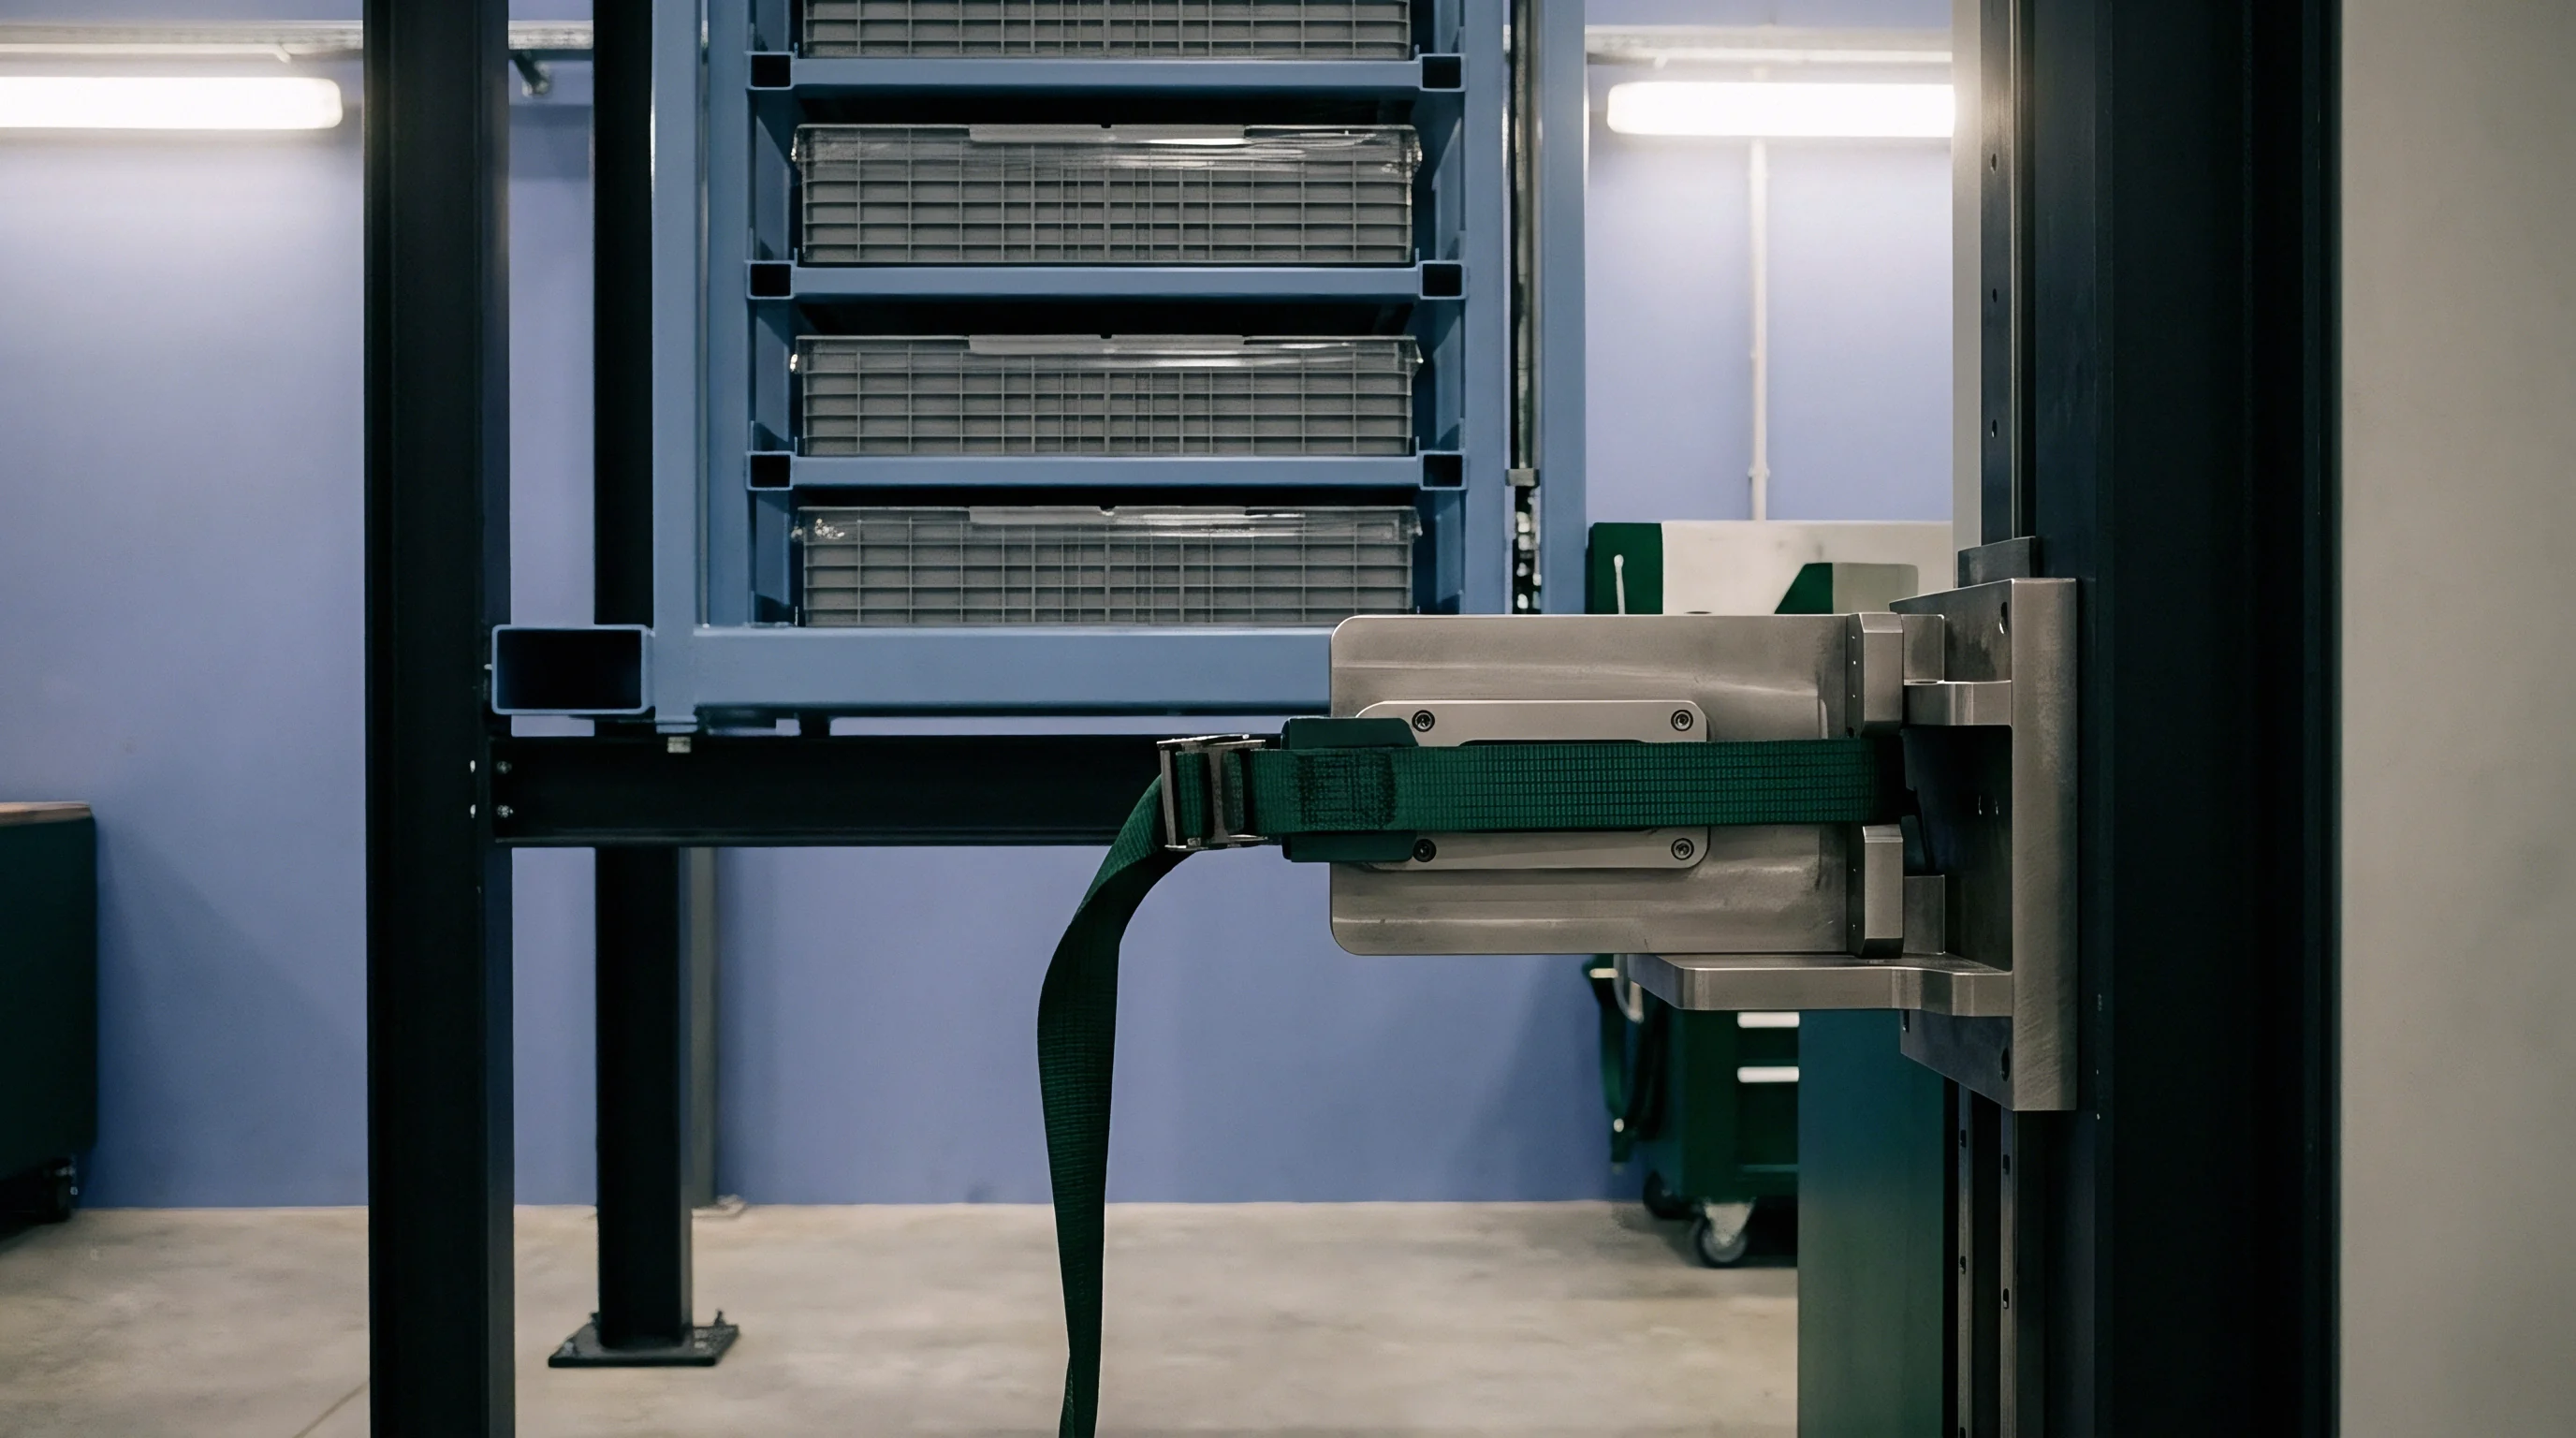

Fixture
Incoming prismatic cells sit on test channels with four-wire Kelvin sensing leads clamped to nickel-plated aluminum terminals. Connecting voltage sense lines directly to the terminal base instead of the current-carrying lugs eliminates contact resistance artifacts from high-current busbars. Ambient thermal regulation maintains the test bay at 25 degrees Celsius within a tight window of plus or minus 1 degree across every cycling bay.
Mechanical boundary conditions dictate the physical degradation rate of lithium iron phosphate (LiFePO4) chemistry. Pouch and prismatic cells experience continuous unit cell volume swings between the fully lithiated FePO4 phase and the delithiated state, generating anisotropic expansion of roughly 6.8 percent along the lattice axes during charge. Qualification fixtures apply constant mechanical pressure across the wide cell faces using calibrated spring plates or load-cell-monitored end plates.
Unconstrained prismatic cells exhibit premature capacity loss from electrode delamination at 800 cycles, while identical lots held at 300 kilopascals sustain 3500 cycles to 80 percent retention.
Rigid aluminum fixtures prevent pouch swelling and suppress inter-particle contact loss inside the composite cathode. When cells cycle without mechanical compression, delamination occurs at the current collector foil interface, causing rapid impedance spikes and apparent capacity fade that does not originate from active chemical degradation. Testing without fixed compressive loading distorts laboratory qualification dossiers, invalidating cycle-life projections for field enclosures.
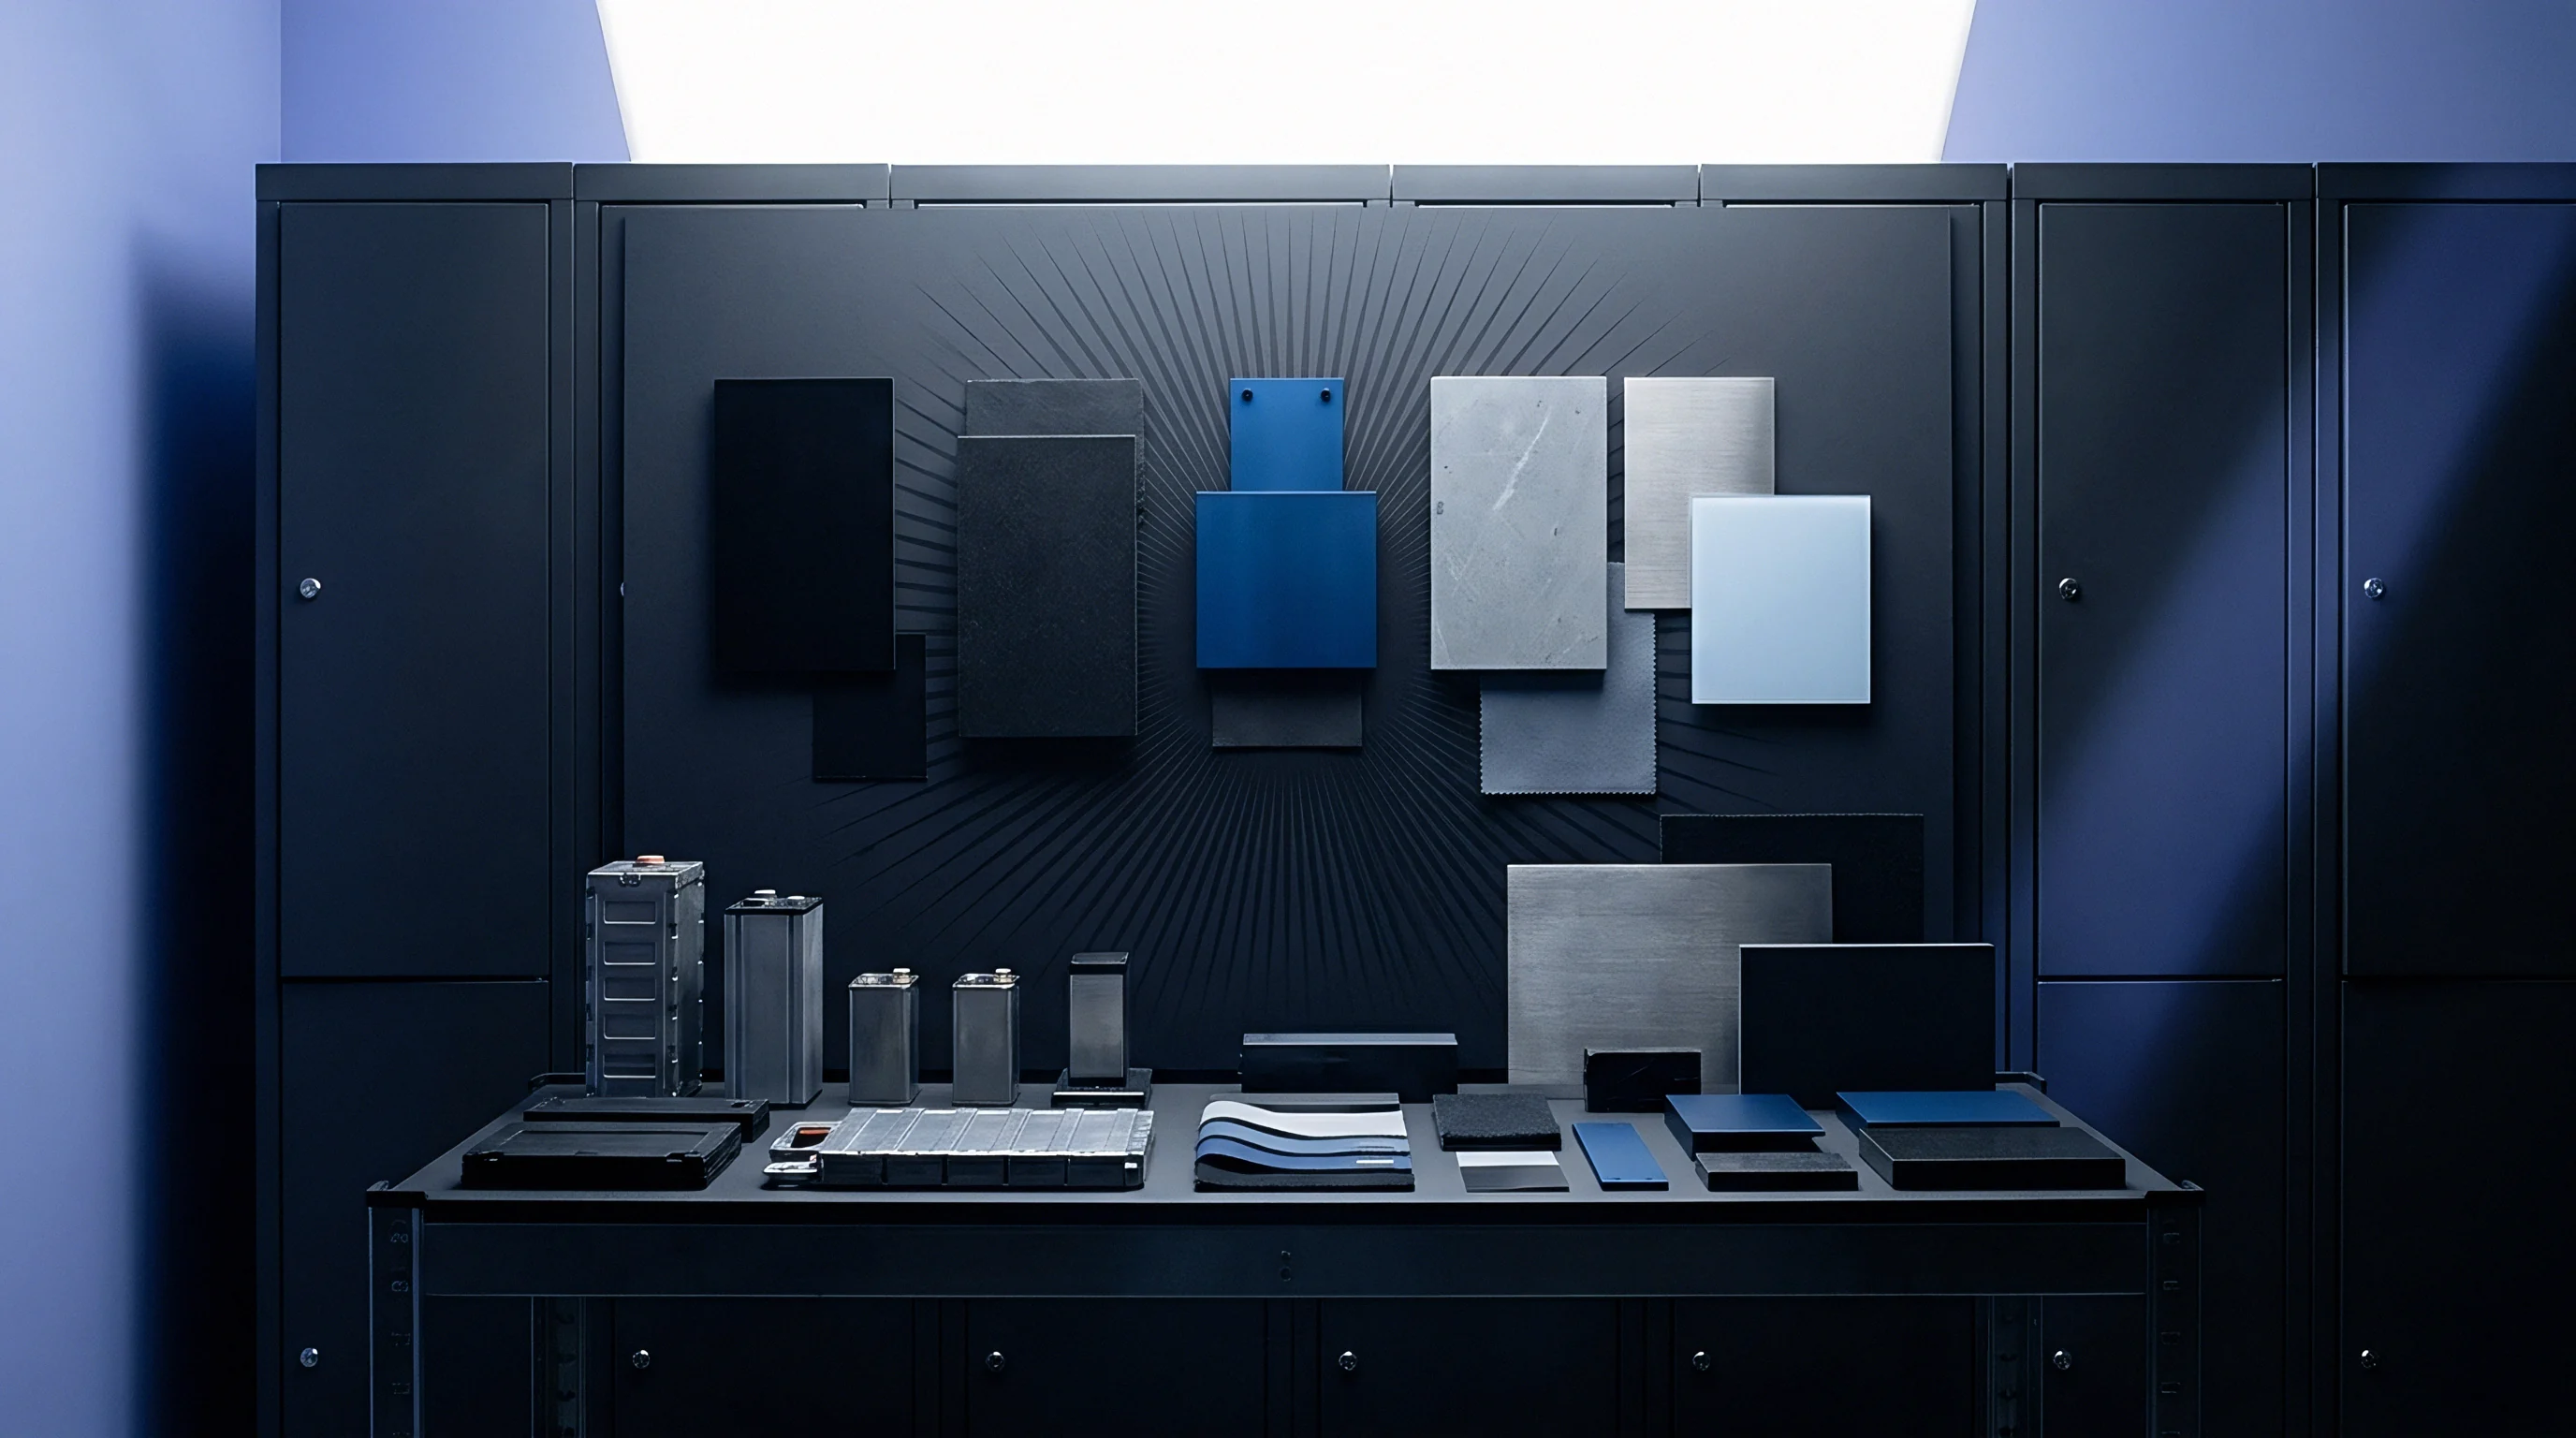
Mechanical Clamping Parameters
Rigid end plates secured by high-tensile threaded tie rods distribute force evenly across the cell package. Torquing bolts to a specified tension compresses calibrated die springs, sustaining uniform pressure throughout prolonged volumetric cycling. Load cells installed in series with the fixture assembly monitor dynamic force evolution during intercalation stages.
Compression parameters vary by cell format, cell volume, and mechanical casing rigidity:
- Initial Static Preload fixes the mechanical contact boundary at 200 to 300 kilopascals under 30 percent state of charge.
- Dynamic Force Limits prevent localized separator yield when electrode expansion peaks near 100 percent state of charge.
- Uniform Pressure Distribution prevents localized current crowding across the interior jelly-roll edges.
- Thermal Isolation Gaskets shield the testing fixture from acting as an uncontrolled secondary heat sink.
Neglecting mechanical containment in qualification cycling yields premature warranty claims, misallocates warranty reserves, and prompts incorrect lot rejections on supplier deliveries.
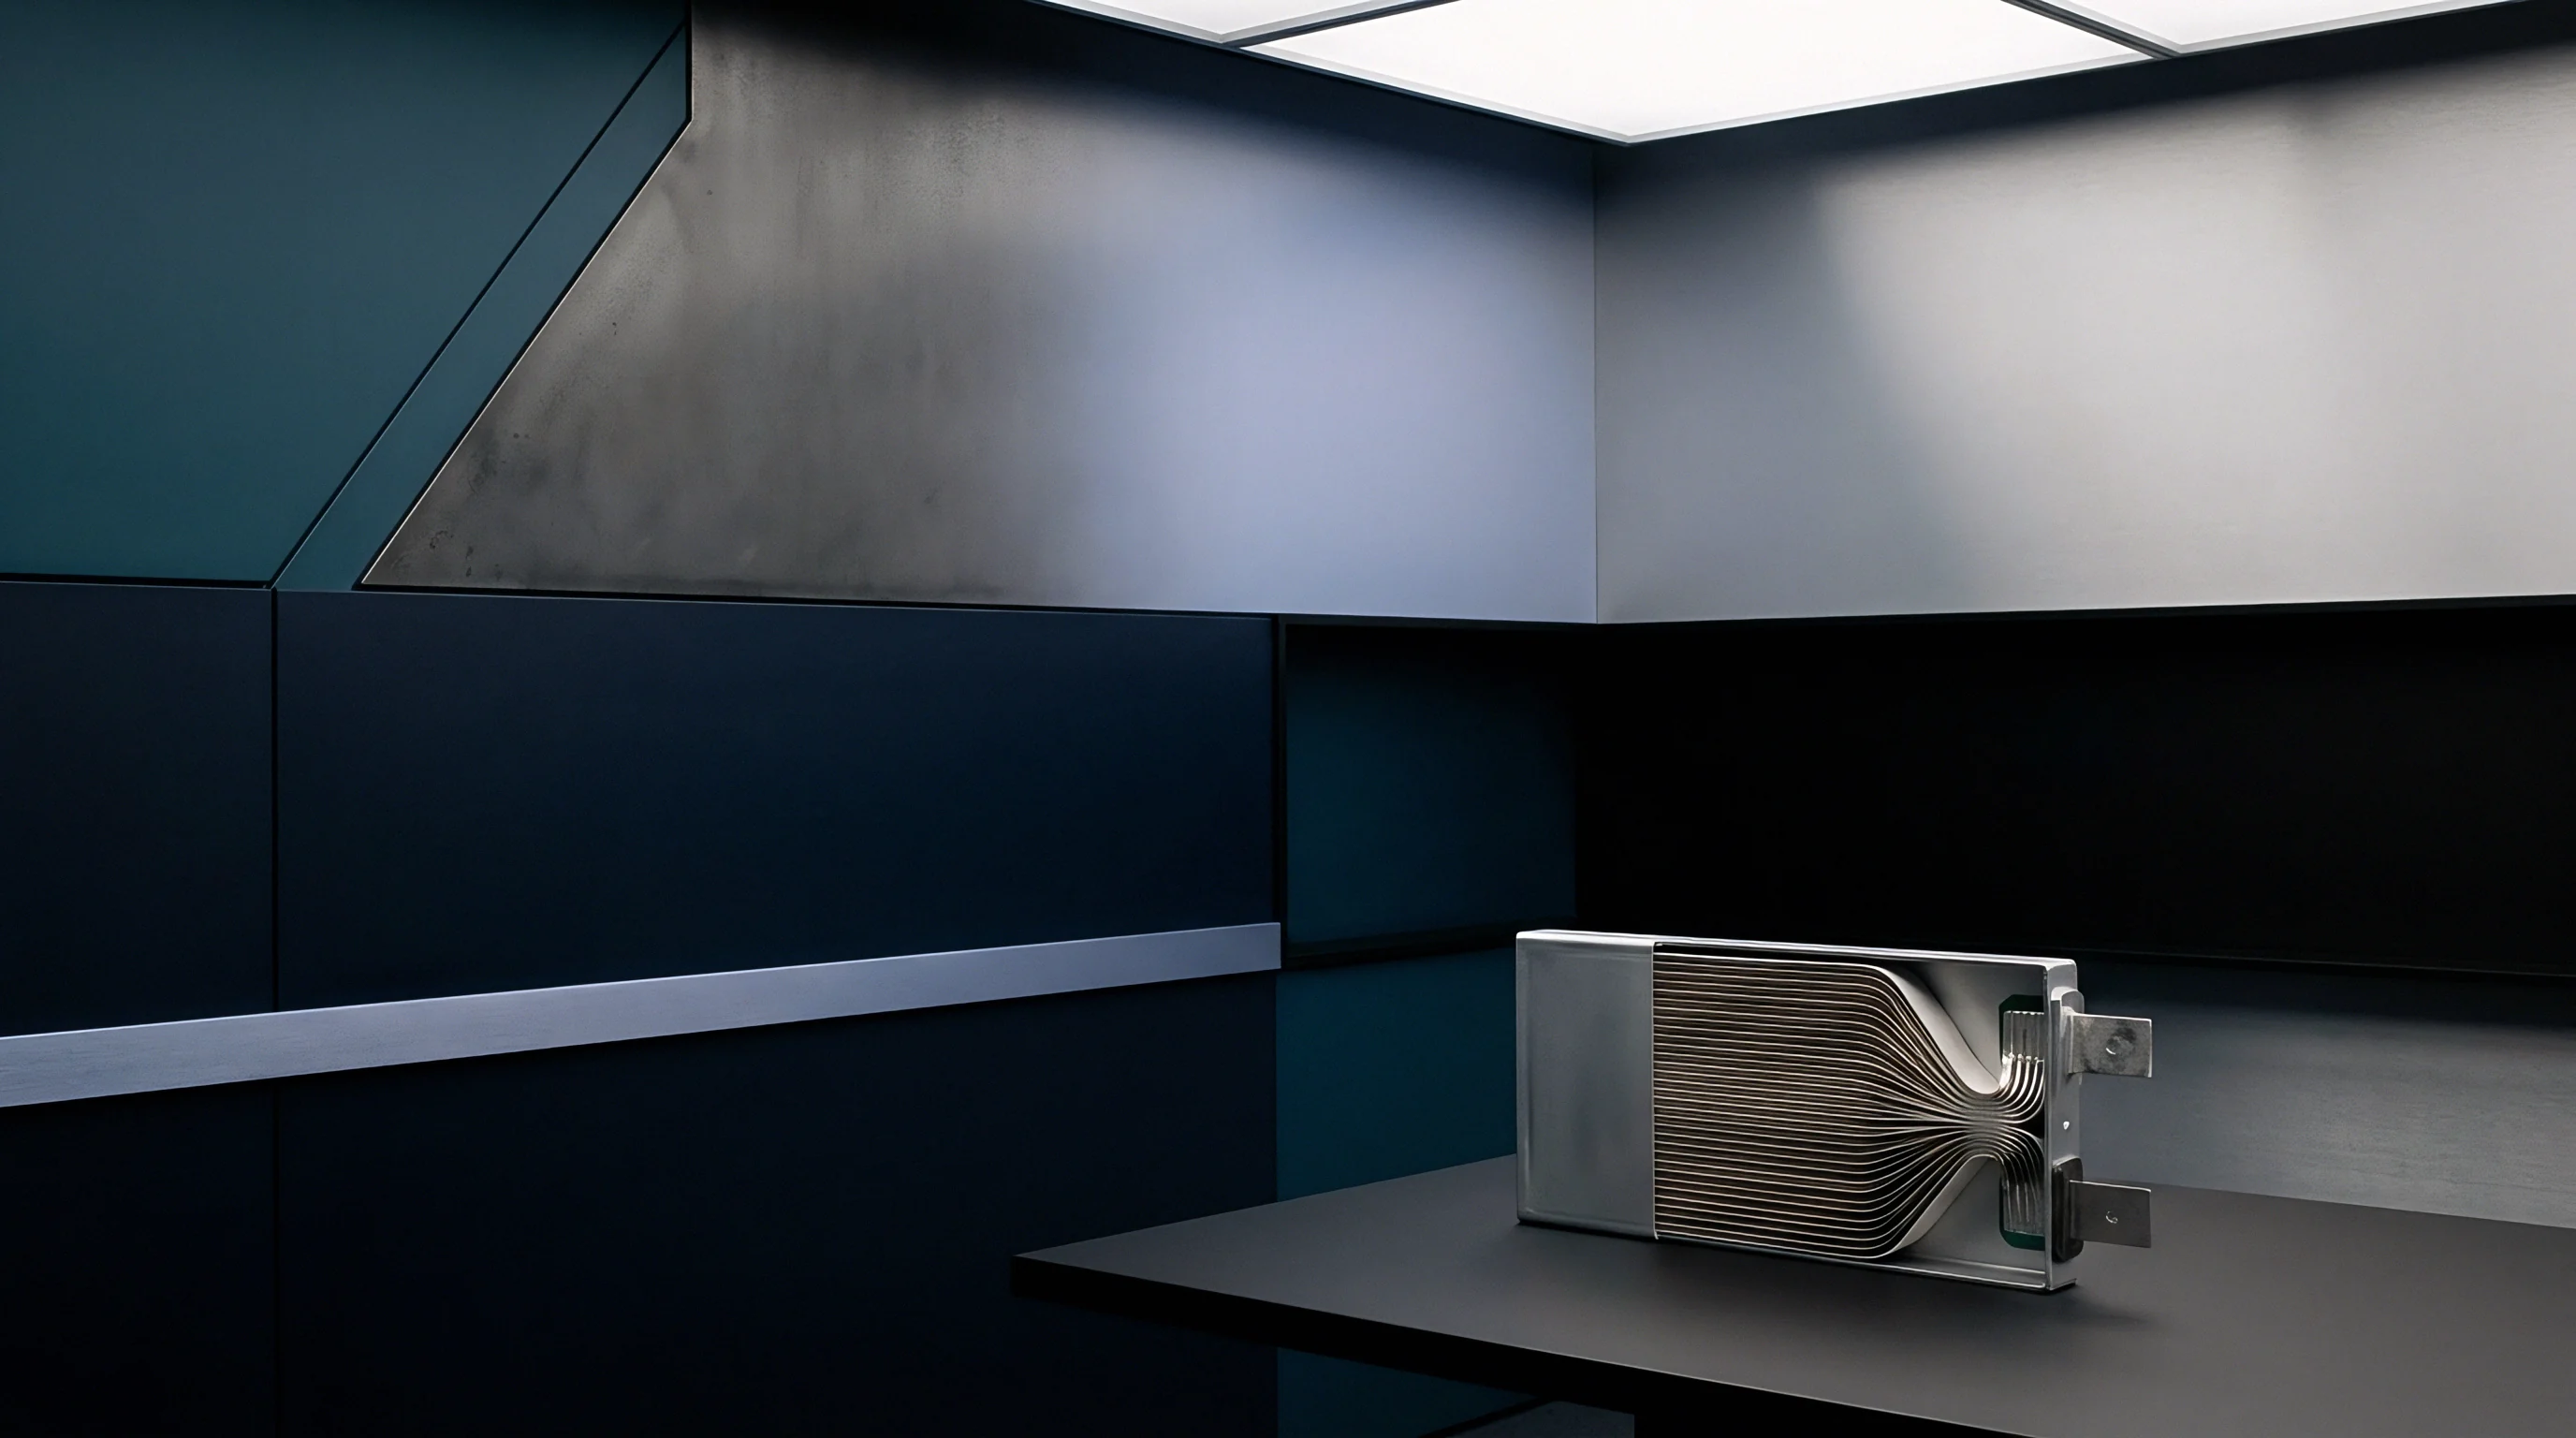
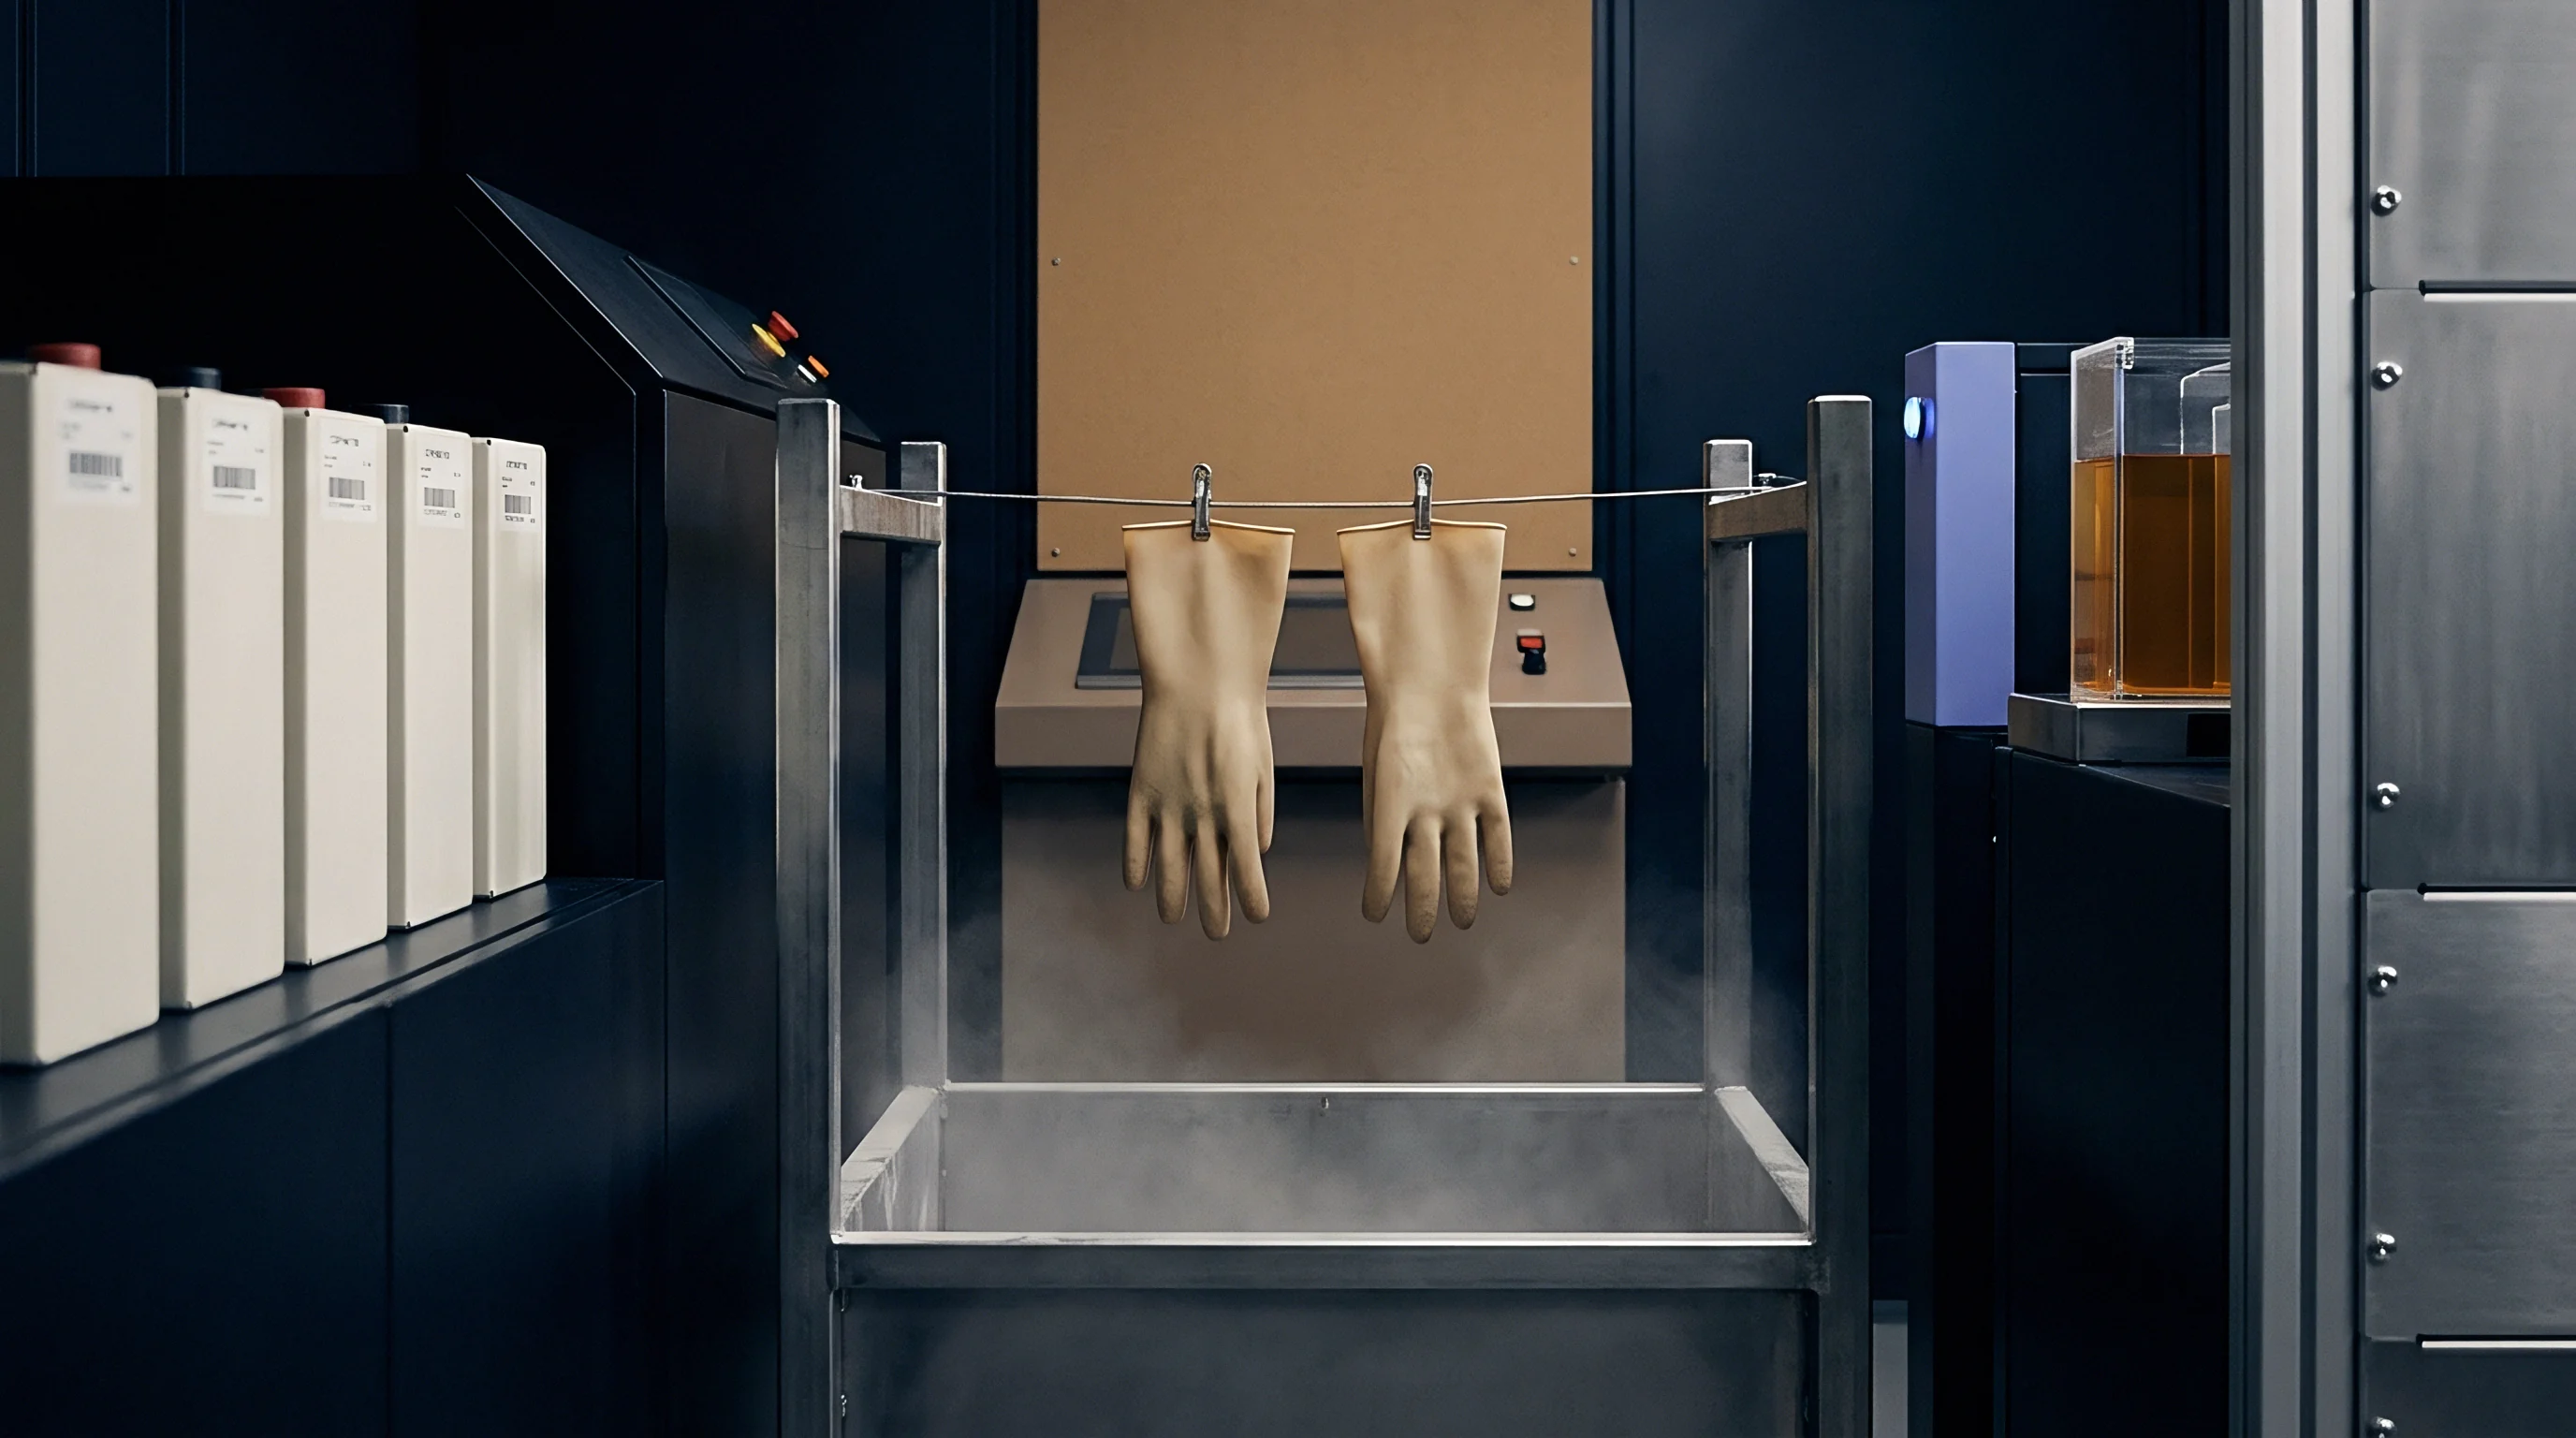
Regime
Cycling routines specify current rates, voltage cutoffs, and pause durations precisely. Standard qualification protocols run continuous galvanostatic charge and discharge steps governed by IEC 62660-1 test guidelines for industrial traction and stationary storage cells. Testing profiles mandate constant current charging at 0.5C to 3.65 volts, holding constant voltage until taper current decays below 0.05C, followed by a mandatory 30-minute rest period.
Discharge proceeds at 1.0C down to a lower voltage limit of 2.50 volts, terminating with another 30-minute rest interval. These rest periods give internal concentration gradients time to equilibrate, clear localized thermal buildup, and allow open-circuit voltage stabilization. Shortening rest periods elevates local core temperatures, artificially accelerating solid electrolyte interphase formation and masking baseline electrochemical stability.
Standard IEC 62660-1 Clause 6.2.2 establishes 0.5C charge and 1.0C discharge at 25 degrees Celsius as the reference capacity determination standard for industrial secondary cells.
Reference Performance Tests (RPT) interrupt continuous cycling at predefined intervals, typically every 100 or 200 cycles. An RPT sequence applies low-rate 0.1C and 0.2C discharge sweeps to determine true usable thermodynamic capacity separate from kinetic polarization losses. Electrochemical impedance spectroscopy (EIS) sweeps across 10 kilohertz to 10 millihertz capture bulk electrolyte resistance and charge transfer resistance shifts throughout cycling.

Cycling Parameter Comparison
Test parameters alter the degradation trajectory and qualification duration across different screening tracks:
| Test Profile | Charge Current | Discharge Current | Voltage Range | Rest Duration | Target Cycles |
|---|---|---|---|---|---|
| Standard Screening | 0.5C CCCV | 1.0C CC | 2.50V to 3.65V | 30 minutes | 4000 |
| Fast-Charge Qualification | 1.0C CCCV | 1.0C CC | 2.50V to 3.65V | 20 minutes | 3000 |
| Extended Grid Profile | 0.25C CCCV | 0.5C CC | 2.80V to 3.45V | 45 minutes | 6000 |
| Extreme Thermal Screening | 0.5C CCCV | 1.0C CC | 2.50V to 3.65V | 30 minutes | 2000 |
Voltage limits define the operational boundary of the qualification test. Driving cells to 3.65 volts maximizes available capacity but places the organic carbonate electrolyte solvents near their anodic oxidation limits. Truncating the charge cutoff to 3.45 volts retains 97 percent of rated amp-hour capacity while reducing electrolyte decomposition at the positive electrode interface.
IEC 61960-3 Clause 5.3 mandates that reported rated capacity values match the mean discharge capacity of five sampled cells cycled at 0.2C after constant-current constant-voltage charging, preventing nominal capacity claims measured under unachievable laboratory conditions.

Mechanics
Electrochemical capacity decline in lithium iron phosphate cells stems from distinct degradation mechanisms rather than a single uniform wear mode. Loss of lithium inventory constitutes the primary aging pathway during standard ambient cycling. Active lithium ions consume themselves during parasitic reactions at the negative electrode surface, reinforcing the solid electrolyte interphase layer over thousands of cycles.
Solid electrolyte interphase growth continuously depletes cyclable lithium while active olivine host material remains largely undamaged. Iron dissolution presents a secondary failure vector under sustained elevated temperatures. Trace moisture contamination in the hexafluorophosphate electrolyte generates hydrofluoric acid, leaching divalent iron cations from the LiFePO4 lattice into the liquid phase.
Parasitic side reactions consume cyclable lithium ions at the negative graphite surface without degrading the primary iron phosphate crystal structure.
Dissolved iron cations migrate across the porous polyethylene separator toward the negative electrode. Upon reaching the graphite anode, these cations reduce to metallic iron clusters on the carbon surface, compromising the passivation layer. This reduction reaction catalyzes further electrolyte decomposition, accelerating lithium inventory loss and driving rapid polarization growth.

Electrode Degradation Pathways
Quantifying distinct degradation pathways enables laboratory technicians to diagnose whether capacity retention loss originates from material defects or test stress:
- Lithium Inventory Depletion reduces available mobile charge carriers via sustained parasitic electrolyte decomposition at the graphite interphase.
- Active Material Loss manifests as particle cracking and binder detachment triggered by repetitive volume swings.
- Conductive Network Disruption occurs when current collector corrosion increases interfacial resistance at the foil substrate.
- Electrolyte Dry-Out develops as continuous passivation consumption exhausts available liquid solvent inside the porous separator.
Differential voltage analysis provides non-destructive tracking of phase transition staging across cycling life. Plotting dV/dQ against discharge capacity reveals shifting voltage plateaus corresponding to graphite intercalation stages. Contraction of the distance between graphite staging peaks directly tracks loss of lithium inventory without requiring destructive cell teardowns.
Early capacity drop often stems from graphite staging variations, where an initial rapid loss levels off before reaching warranty thresholds.

Acceleration
Long cycle lives of industrial LiFePO4 cells make ambient qualification testing commercially challenging. Running 4000 full cycles at 0.5C charge and 1.0C discharge requires over 500 calendar days of continuous cycling channel occupancy. Accelerated life testing protocols condense this qualification window into manageable commercial timelines through elevated temperature and stress regimes.
Arrhenius thermal modeling establishes a structured framework for temperature-accelerated cycling. Elevating chamber temperatures to 45 degrees Celsius and 55 degrees Celsius increases parasitic reaction rates in a predictable, mathematically projectable manner. The apparent activation energy for capacity fade in graphite-LiFePO4 systems typically spans 30 to 45 kilojoules per mole under normal operating windows.
Arrhenius acceleration breaks down when test temperatures exceed 55 degrees Celsius. Extreme thermal fields trigger non-linear aging knees where binder decomposition, severe iron dissolution, and separator shrinkage initiate sudden catastrophic cell failure. These failure modes do not occur in field deployments operating under 35 degrees Celsius.

Thermal Acceleration Calculation
Consider a qualification batch of 280-Ah prismatic energy storage cells subjected to accelerated screening. Assume an activation energy of 35 kilojoules per mole, a baseline field operating temperature of 25 degrees Celsius (298.15 Kelvin), and a qualification test chamber temperature of 45 degrees Celsius (318.15 Kelvin). Applying the Arrhenius reaction rate equation determines the acceleration factor:
The temperature shift generates an acceleration factor of 2.37. Cycling cells for 1000 equivalent full cycles at 45 degrees Celsius delivers degradation equivalent to 2370 cycles at 25 degrees Celsius ambient conditions. Testing duration drops from 300 days down to 126 days per channel.
Testing laboratories run parallel multi-stress matrix arrays across varying temperatures and C-rates to confirm that the activation energy remains constant across the entire test band.
Accelerated aging models lose mathematical projection validity when thermal stresses trigger phase degradation pathways that remain dormant under ambient operating conditions.
Stress Matrix Structure
Evaluating multi-parameter sensitivity demands structured allocation of test assets across defined environmental conditions:
| Test Group | Cell Count | Temperature | Charge / Discharge Rate | Depth of Discharge | Duration |
|---|---|---|---|---|---|
| Baseline Reference | 4 units | 25 deg C | 0.5C / 1.0C | 100 percent | 365 days |
| Thermal Accelerated | 8 units | 45 deg C | 0.5C / 1.0C | 100 percent | 150 days |
| Thermal Stress Limit | 4 units | 55 deg C | 0.5C / 1.0C | 100 percent | 90 days |
| Kinetic Accelerated | 6 units | 25 deg C | 1.0C / 2.0C | 100 percent | 180 days |
| Shallow Cycle Swing | 6 units | 45 deg C | 0.5C / 1.0C | 80 percent | 150 days |
| All channels maintain continuous 300 kPa mechanical fixture containment. | |||||
A key question is whether acceleration factors established on pristine factory lots remain predictive for cells subject to long transit storage periods.

Settlement
Incoming cell batches face commercial sign-off criteria founded on standardized laboratory data sets. Procurement contracts for utility-scale battery projects tie milestone payments and warranty guarantees directly to laboratory capacity retention benchmarks. Cell buyers execute statistical acceptance sampling based on ISO 2859-1 general inspection level II, pulling representative units from production lots before authorizing factory release.
Landed cost calculations incorporate capacity fade trajectories into long-term financial modeling. When cells degrade faster than qualification curves predict, battery system integrators must overbuild initial system capacity or schedule premature module augmentation. Factoring degradation metrics into levelized cost of storage calculations dictates commercial returns across multi-megawatt installations.
Batch qualification protocols define pass and fail thresholds for delivered inventory. A standard purchase specification mandates that five sampled cells per master production lot must demonstrate a minimum of 98.5 percent rated capacity during incoming 0.2C reference screening. The protocol mandates that 50 continuous qualification cycles must yield less than 0.08 percent average capacity loss per cycle.

Batch Acceptance Protocol
Technicians follow a set validation sequence upon arrival of qualification samples from manufacturing facilities:
- Receiving inspection checks external dimensions, bar code serialization, terminal flatness, and shipping open-circuit voltage stability.
- AC impedance testing at 1000 hertz verifies internal ohmic resistance within plus or minus 5 percent of factory specification.
- Pre-conditioning cycles execute three full 0.2C charge and discharge sweeps inside thermal chambers at 25 degrees Celsius.
- Baseline reference performance testing records initial discharge energy, Coulombic efficiency, and voltage plateau profiles.
- Accelerated 50-cycle stress testing screens for latent electrode manufacturing defects, delamination risks, and abnormal gas generation.
Qualification dossiers link test data to shipping documentation, dangerous goods transport compliance, and UN 38.3 test summary verification. Cells lacking rigorous cycle qualification testing create unacceptable exposure during commercial deployment and warranty reconciliation.
A qualification protocol proves its commercial value when empirical laboratory wear curves match the capacity fade measured across operating field installations.