Operando Three Electrode Metrology for Separating Charge Transfer Resistance from Solvation Stripping Kinetics
Operando three-electrode metrology isolates desolvation energy barriers from charge transfer kinetics, defining true lithium plating overpotential limits.


Architecture
Inserting a third electrode into a sealed lithium-ion cell inevitably perturbs local current density. Standard two-electrode measurements lump cathode, anode, and bulk electrolyte contributions into one overall voltage drop or impedance spectrum. An inserted reference electrode isolates the individual working and counter potentials during operando tests, but poor placement introduces severe geometric distortions.
If ionic current streamlines bend around the probe, measured overpotentials capture physical potential drops across the electrolyte rather than pure interfacial kinetics.
Three main configurations dominate three-electrode testing: pouch cells with embedded micro-wires, specialized fixtures with coaxial reference channels, and modified Swagelok cells. Pouch formats reflect production hardware most closely, yet slipping a probe between double-coated electrodes interferes with stack pressure and local separator wetting. Swagelok designs seal reliably, but their excessive electrolyte volume distorts transport kinetics and inflates bulk ohmic resistance.
In practice, selecting an architecture requires balancing physical containment against the need for uniform primary and secondary current distributions across active coatings.

Geometric Principles of Reference Electrode Placement
Any probe placed within the cell envelope alters ionic streamlines. Under ideal planar conditions, current density runs strictly perpendicular between active electrode faces. A conductive or insulating probe breaks that symmetry by sampling potential at an isolated point in the separator.
If positioned closer to one electrode margin, uncompensated ohmic drop skews the reading toward that interface.
Placing the sensing tip outside the inter-electrode current path introduces high-frequency phase shifts. This edge-reference geometry produces spurious capacitive arcs or inductive loops in Nyquist plots above 1 kilohertz. Avoiding these artifacts demands embedding the sensing tip directly within the separator between overlapping active areas.
For this reason, micro-wire probes must have outer diameters well under the separator thickness to prevent pinching the active coatings or initiating soft shorts.

Mitigating Ionic Current Stream Distortions
Unbalanced potential drops across planar electrodes create measurement errors under dynamic loads. When a working electrode overhangs the counter, edge current lines compress, forcing the reference to register an averaged potential field that drifts with current magnitude and state of charge. Clean operando metrology therefore requires tight margin alignment to keep equipotential surfaces planar across the separator.
Probe surface chemistry governs potential stability across extended cycling. Lithium wire remains common due to its direct Li/Li+ thermodynamic baseline, but continuous reactions with carbonate solvents lead to steady drift and growing interfacial impedance. Pre-passivating the wire via controlled chemical or electrochemical alloying establishes a more resilient interphase for long fast-charging protocols.
| Probe Chemistry | Equilibrium Potential vs Li/Li+ (V) | Drift Rate (mV per 24 hours) | HF Phase Artifact Onset (kHz) | Primary Contamination Risk |
|---|---|---|---|---|
| Lithium Metal Wire | 0.000 | 1.5 to 4.2 | 1.2 | Continuous SEI growth, dendrite formation |
| Lithium-Aluminum Alloy (Li-Al) | 0.385 | 0.1 to 0.4 | 8.5 | Volume expansion cracking, mechanical dissolution |
| Lithium-Bismuth Alloy (Li-Bi) | 0.820 | 0.05 to 0.2 | 12.0 | Minor bismuth dissolution under oxidation |
| Gold-Coated Tungsten Wire (Li-Au) | 0.320 | 0.2 to 0.6 | 15.0 | Incomplete lithiation leading to dual-phase drift |
| Lithium Iron Phosphate Micro-Wire | 3.420 | 0.02 to 0.1 | 22.0 | Partially delithiated phase instability at high temperature |
| Data acquired at 25 °C in standard 1.0 M LiPF6 EC:EMC (3:7 by volume) electrolyte under continuous operando galvanostatic cycling. High-frequency artifact onset defines the frequency above which reference phase angle error exceeds 2 degrees. | ||||
Micro-reference electrodes based on lithium-bismuth alloys offer far better stability than neat lithium. The two-phase equilibrium of the Li-Bi system buffers reference potential against the minute leakage currents drawn by high-impedance electrometers, holding drift under 0.2 millivolts per day across multi-week experiments. A low probe surface impedance also preserves signal-to-noise ratios during high-frequency impedance acquisition.
In pouch cells prepared for operando studies, spatial alignment governs data quality. Shifting the wire by even 50 micrometers off the separator centerline can distort calculated charge transfer resistance by up to 25 percent. Reliable workflows rely on optical alignment jigs and high-resolution X-ray computed tomography to confirm wire location before cell testing begins.
Reference wire diameter should never exceed one tenth of the separator thickness to prevent ionic field distortion.
Asymmetric cell builds, such as those with capacity-mismatched electrodes, exacerbate geometric sensing errors. Current stream distortion increases with C-rate, generating artificial non-linear overpotentials above 2C. Finite element models parameterized with electrolyte conductivity, separator tortuosity, and local discharge rates help untangle these artifacts and extract true electrode potentials from raw test data.
Precise alignment of electrode margins inside pouch cells suppresses fringing fields near active material edges. Anchoring the probe tip in the central, uniform current zone ensures relaxation curves capture true solid-state and interfacial dynamics rather than stray electrolyte ohmic drops.
Keeping electrolyte volume low prevents artificial shifts in transport kinetics. Flooding a test cell alters effective pore diffusion lengths and flattens concentration gradients that develop under production conditions. Metering electrolyte volume during assembly maintains realistic porosity dynamics and produces kinetic data representative of commercial cells.
To preserve field symmetry, reference leads should exit the pouch perpendicular to the main current tabs. Running leads in parallel creates mutual inductance that couples high-frequency AC signals into the sensing circuit. Grounded coaxial braiding on external leads prevents phase distortion during high-frequency EIS sweeps.
Placing a reference electrode parallel to the active material plane outside the primary current path guarantees distorted charge transfer measurements.

Wire
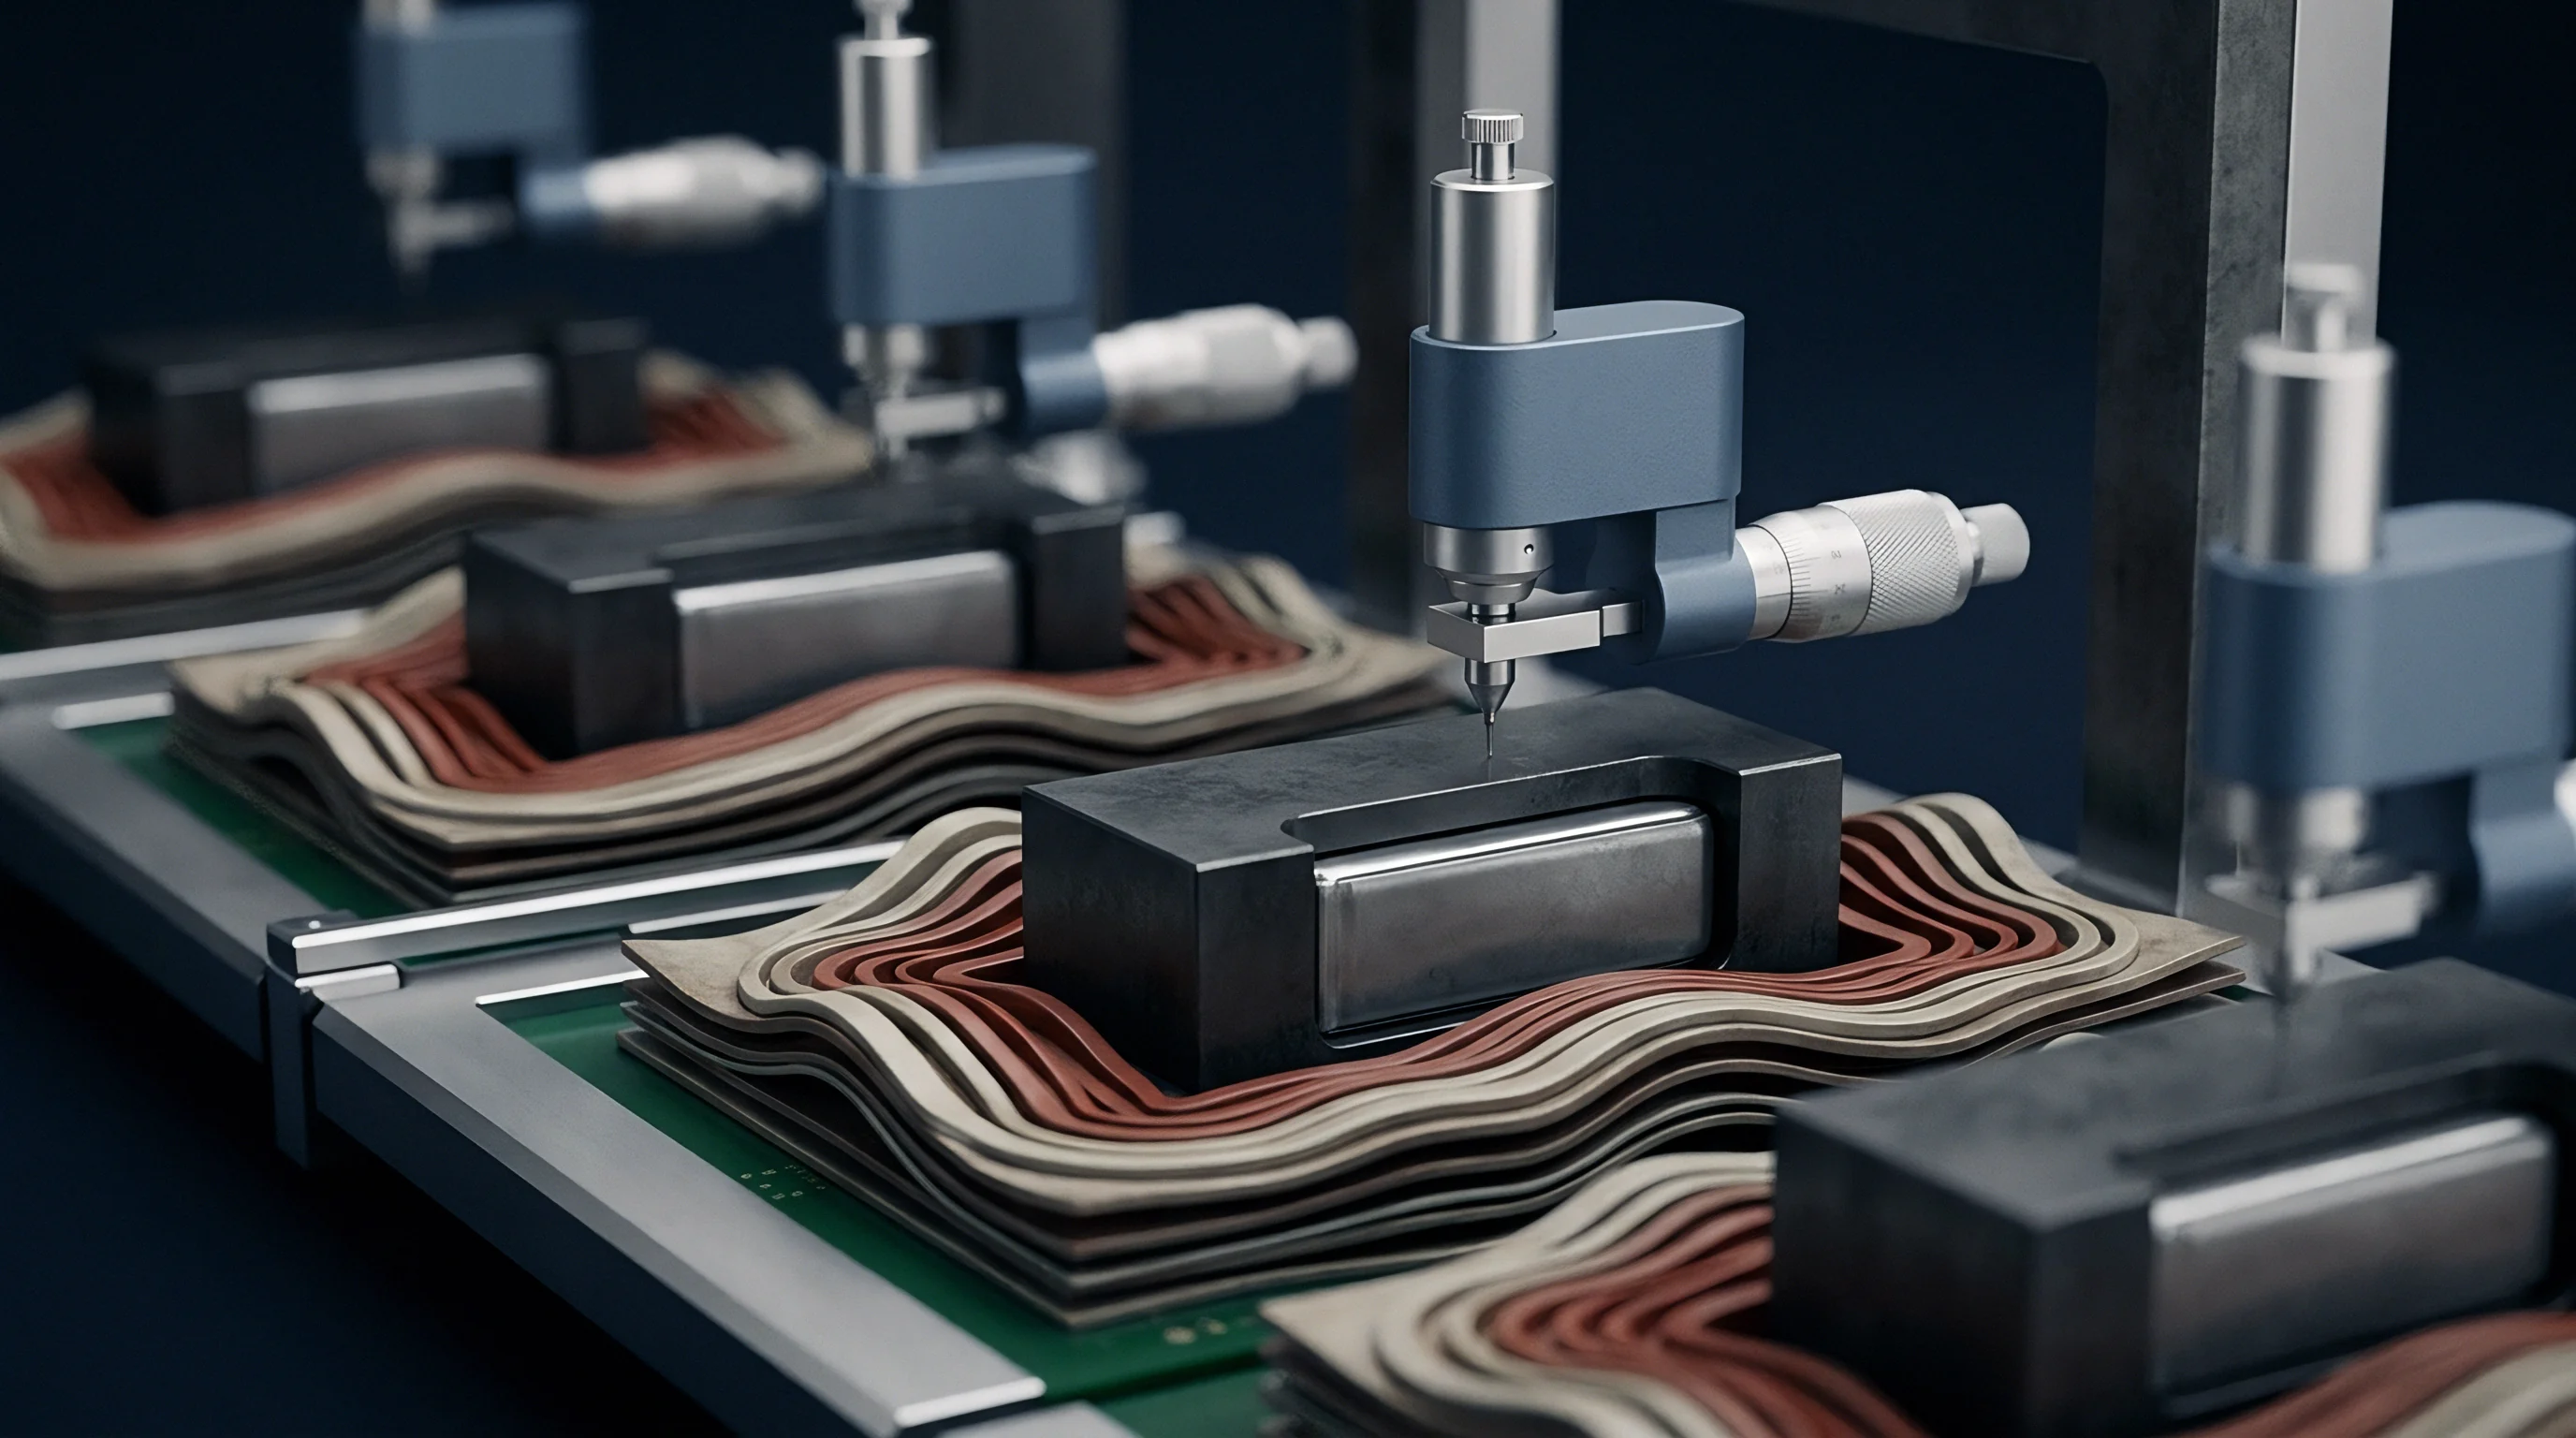
Fabricating micro-scale probes demands precise control of wire diameter and dielectric insulation. Bare copper or tungsten cores protected by thin polymer sheaths form the basis of durable reference electrodes. Polyimide and fluorinated ethylene propylene both provide effective barriers against corrosive carbonate solvents.
Etching the exposed tip to a diameter between 10 and 25 micrometers creates a localized contact that minimizes physical disruption to the separator matrix.
Alloying the exposed tip with lithium sets a dependable reference potential. Lithiating a gold or bismuth core in situ inside the sealed cell prevents exposure to ambient air and moisture. Tracking coulombs during this step fixes the phase stoichiometry, stabilizing the thermodynamic potential.

Micro-Electrode Fabrication and Insulation Geometry
Substrate selection dictates both the operational potential window and mechanical rigidity of the probe. Tungsten provides the stiffness needed to resist bending during vacuum sealing and mechanical clamping. Gold coatings promote fast, uniform lithiation at modest cathodic overpotentials.
The polyimide sleeve must adhere cleanly to the core wire to prevent electrolyte creep, which shifts the effective sensing plane away from the tip.
Leaving excessive metal exposed at the tip increases interfacial capacitance. High tip capacitance combines with electrometer input impedance to create a low-pass filter, attenuating high-frequency signals and distorting Nyquist arcs above 5 kilohertz. Restricting the exposed tip length to under 50 micrometers maintains spatial resolution and limits tip capacitance to a few picofarads.
Electrometer Impedance Matching Protocols
Measuring potential without drawing current requires exceptionally high input impedance. Standard potentiostat channels typically provide around 10 gigohms in parallel with 20 picofarads. For micro-electrodes with minimal surface area, this is often insufficient; even nanoampere leakage currents can polarize the micro-tip and induce baseline drift.
Buffer amplifiers mounted directly on the test fixture minimize cable capacitance and signal attenuation. Input impedances exceeding 10 teraohms and bias currents below 50 femtoamperes isolate the micro-wire from instrument load. Driving an active guard shield at the reference potential suppresses stray capacitive losses across the harness.
- Chemically etch tungsten micro-wire filaments down to a uniform tip diameter of 15 micrometers using an electrochemical sodium hydroxide bath.
- Apply a conformal polyimide dielectric coating along the filament shaft, heat curing at 350 degrees Celsius to guarantee chemical resistance against carbonate solvents.
- Expose exactly 30 micrometers of bare metal tip using a precision laser ablation pulse calibrated to remove insulation without damaging the tungsten core.
- Mount the insulated filament within an optical positioning jig inside an argon-filled glovebox, inserting the tip into the separator matrix between double-sided active coatings.
- Perform controlled galvanostatic cathodic lithiation at a current density of 50 microamperes per square centimeter to establish a stable lithium-bismuth alloy phase at the exposed tip.
- Verify reference potential stability against an unpolarized secondary lithium foil standard for 12 hours, confirming a drift rate below 0.1 millivolts per hour.
Input capacitance matching becomes critical during operando impedance spectroscopy above 10 kilohertz. Cable capacitance introduces uncompensated phase shifts that push the imaginary impedance across the real axis prematurely, producing false inductive loops. Driven shielding prevents this attenuation, delivering clean high-frequency signals to the digitizer.
Vibration and mechanical pressure fluctuations inside the test chamber degrade potential stability. Thermal expansion and nearby equipment generate microphonic noise, disturbing the contact interface between the wire tip and electrolyte. Operating cells inside Faraday cages on vibration-isolated optical tables suppresses these transient artifacts during long runs.
Thermal gradients across the micro-wire create thermoelectric voltage offsets via the Seebeck effect. Even subtle differences generate several hundred microvolts per degree Celsius, drifting the baseline. Clamping terminal junctions inside isothermal aluminum blocks stabilizes the thermal environment, ensuring measured overpotentials represent pure cell chemistry.
Relaxation peak shifts across differing solvent blends clearly demonstrate how mechanical probe defects distort raw spectra. Fissures in the insulation allow electrolyte contact away from the tip, introducing parallel conduction paths that compromise spatial resolution. Running high-voltage leakage checks on the insulation before cell assembly identifies these flaws early.
Electrolyte depletion around the wire tip represents another failure mode during high-rate cycling. High local current density and localized heating boil off volatile linear carbonates, creating dry micro-voids in the adjacent separator. These voids interrupt ionic continuity, driving reference impedance up by orders of magnitude and introducing severe noise into potential measurements.
Deploying micro-reference probes without ultra-high input impedance buffer amplifiers polarizes the reference phase, ruining kinetic deconvolution and rendering custom operando cell hardware useless.


Resolution
Isolating specific polarization mechanisms from full-cell impedance data requires mathematical transformation of the frequency response. Standard Nyquist representations lump discrete processes into overlapping semicircles. Desolvation, solid electrolyte interphase (SEI) transport, and Butler-Volmer charge transfer all occur across overlapping windows between 0.1 hertz and 100 kilohertz, making simple equivalent circuit fits inadequate for kinetic separation.
Distribution of Relaxation Times (DRT) maps impedance onto a continuous time-constant spectrum. By treating cell behavior as an infinite array of parallel RC elements, DRT deconvolutes overlapping arcs into resolved peaks. The area beneath each peak directly reflects polarization resistance, while peak positions mark characteristic relaxation times for distinct electrochemical phenomena.

Where Does Solvation Resistance Mask Interfacial Kinetics?
Overlapping time constants often obscure kinetic barriers that share similar frequency windows. Stripping the solvent coordination shell from a lithium ion requires energy at the outer edge of the electric double layer, immediately prior to SEI transport and interfacial charge transfer. At room temperature, the characteristic frequency of desolvation sits so close to that of charge transfer that their respective impedance features coalesce into a single arc.
Modulating cell temperature separates these overlapping features. Solvation stripping carries a higher activation energy than solid-state transport or Butler-Volmer electron exchange. Cooling an operando cell from 25 degrees Celsius down to sub-zero temperatures shifts the desolvation peak toward lower frequencies much faster than the charge transfer peak, resolving the two in the DRT spectrum.
DRT algorithms solve an ill-posed inverse problem that demands carefully tuned regularization. Raw numerical inversion magnifies noise, producing spurious peaks. Applying Tikhonov regularization with cross-validation balances peak resolution against artifact generation, filtering out high-frequency noise while preserving true kinetic features.
- High-Frequency Phase Distortions introduced by mutual inductance between signal leads produce false high-frequency peaks in the DRT spectrum below one microsecond relaxation time.
- Uncompensated Ohmic Drops caused by asymmetric reference wire positioning shift relaxation peak positions along the time axis during dynamic current pulsing.
- Temperature Fluctuations exceeding 0.1 degrees Celsius during spectral sweeps introduce low-frequency baseline instability, causing broadening of charge transfer peaks.
- Non-Stationary Cell States during rapid state-of-charge transitions violate the fundamental stationarity requirement of impedance spectroscopy, generating artificial relaxation peaks.
- Over-Regularization Filters applied during mathematical DRT transformation overly smooth the spectrum, merging closely spaced desolvation and SEI transport peaks into a single unresolvable bump.
Integrating the area under individual DRT peaks over discrete time intervals isolates specific resistance contributions. This analysis shows that desolvation resistance dominates total cell polarization at low temperatures and elevated states of charge. At -20 degrees Celsius, desolvation accounts for over 60 percent of total anode polarization in standard carbonate electrolytes, making it the primary rate-limiting step during fast charging.
Charge transfer resistance follows Butler-Volmer kinetics, scaling exponentially with overpotential and temperature. As state of charge changes, graphite lithiation alters exchange current density. Tracking charge transfer resistance across charging intervals reveals distinct local minima tied to stage transitions in the graphite.
In contrast, solvation stripping resistance remains largely stable across state of charge, dictated by solvent shell structure and local field strength.
Charge transfer kinetics at the graphite edge plane proceed faster than the solvent stripping step in standard carbonate mixtures.
Pairing the Galvanostatic Intermittent Titration Technique (GITT) with high-frequency pulse impedance provides an independent kinetic check. Under high-rate pulses, transient overpotential splits into an instantaneous ohmic drop, fast interfacial polarization, and slow diffusion relaxation. Isolating the ohmic step from fast interfacial decay confirms the true magnitude of desolvation resistance under aggressive currents.
Low-temperature sweeps reveal an activation energy of 52 kilojoules per mole for desolvation, illustrating how high-resolution metrology distinguishes between electrolyte candidates. Solvation binding strength directly establishes this barrier: strongly coordinating solvents require higher local fields or additional thermal energy to release the lithium cation.
Improper regularization parameters during DRT transformation can falsely suggest improved charge transfer kinetics when excessive filtering has merely smoothed out the desolvation peak.

Distribution of Relaxation Times Regularization
Converting impedance sweeps into continuous relaxation distributions involves solving a Fredholm integral equation of the first kind. Direct matrix inversion fails because ill-conditioned matrices magnify minor measurement noise into extreme spectral oscillations.
Tikhonov regularization introduces a derivative penalty to stabilize the inversion. The L-curve criterion provides a systematic way to select the regularization parameter by plotting solution norm against residual norm; the optimal point sits at the corner of maximum curvature, preserving peak resolution without admitting numerical noise.
Maximum Entropy Methods (MEM) offer an alternative inversion technique that avoids explicit derivative constraints. MEM calculates the most probable distribution of relaxation times consistent with measured data and experimental error. This approach works particularly well for separating closely spaced doublets, such as inner and outer SEI transport resistances.
Validating a regularization routine requires benchmarking it against synthetic impedance spectra with known equivalent circuits. Injecting Gaussian noise tests whether the algorithm can recover true component values and relaxation times without generating phantom peaks before processing actual three-electrode datasets.
Mapping DRT spectra across states of charge reveals evolving reaction kinetics. Two-dimensional contour maps plotted against lithiation depth highlight the onset of rising charge transfer resistance, clearly separating invariant bulk electrolyte contributions from dynamic interfacial processes.
Sparse or uneven frequency sampling compromises DRT peak integration. Covering the relaxation spectrum requires logarithmically spaced sweeps with at least 10 points per decade. Cutting off data collection below 10 kilohertz truncates the desolvation peak, severely understating low-temperature desolvation resistance.

Overpotential
Distinguishing thermodynamic driving force from kinetic resistance clarifies the true energy loss incurred during fast charging. Overpotential measures the shift of electrode potential from equilibrium under load. At a lithium-ion anode, this total potential drop comprises bulk ohmic losses, liquid-phase concentration gradients, SEI transport overpotential, Butler-Volmer charge transfer, and the desolvation step.
Solvation overpotential reflects the work required to remove polar solvent molecules from the primary coordination sphere of the lithium ion. In conventional ethylene carbonate (EC) formulations, four solvent molecules coordinate tightly around each cation. Overcoming this electrostatic well requires a steep potential drop across the double layer, consuming energy that would otherwise facilitate charge transfer.
Arrhenius Parameter Extraction across Thermal Ranges
Thermal impedance sweeps between -30 and +45 degrees Celsius yield activation energies for individual electrochemical mechanisms. Arrhenius plots of DRT resistance values produce characteristic slopes, where steeper gradients reflect higher activation barriers that limit rate capability at sub-ambient temperatures.
Activation energy for lithium intercalation into graphite typically spans 30 to 40 kilojoules per mole, whereas desolvation in conventional EC-EMC blends requires 50 to 70 kilojoules per mole. As temperature drops, desolvation resistance escalates far more rapidly than charge transfer, forming the primary barrier to low-temperature fast charging.
| Electrolyte System Formulation | Desolvation Ea (kJ/mol) | Charge Transfer Ea (kJ/mol) | Rsolv at 25 °C (Ω·cm2) | Rsolv at -20 °C (Ω·cm2) | Plating Onset Margin at 2C (mV) |
|---|---|---|---|---|---|
| Standard Carbonate (1.0 M LiPF6 EC:EMC 3:7) | 58.4 | 34.2 | 1.8 | 42.5 | -15 |
| Fluorinated Additive (Standard + 10% FEC) | 52.1 | 35.0 | 1.4 | 28.1 | +8 |
| Low-Solvation Ether (1.2 M LiFSI DME:BTFE) | 38.6 | 32.1 | 0.5 | 6.2 | +85 |
| High-Concentration Solvate (4.2 M LiFSI ACN) | 44.2 | 38.5 | 0.9 | 12.4 | +42 |
| Weakly Coordinating Ester (1.0 M LiFSI EA:FEC) | 32.5 | 31.0 | 0.3 | 3.8 | +110 |
| Data evaluated using operando three-electrode pouch cells with graphite working anodes at 50% state of charge. Plating onset margin represents anode potential relative to Li/Li+ at 80% SOC under 2C charge driving force. Negative values indicate active lithium plating. | |||||
Modern electrolyte development targets the coordination strength of the solvation sheath. Introducing weakly coordinating co-solvents, such as fluorinated ethers or carboxylic esters, weakens cation-solvent interactions. This drops the desolvation activation energy below 40 kilojoules per mole, curtailing low-temperature overpotentials and delaying lithium plating toward higher charging rates.
High-concentration and localized high-concentration formulations fundamentally reshape the solvation structure. By incorporating anions directly into the primary coordination shell, they form contact ion pairs and aggregates. Displacing an anion requires considerably less energy than extracting a strongly bound neutral solvent molecule, lowering the desolvation overpotential.
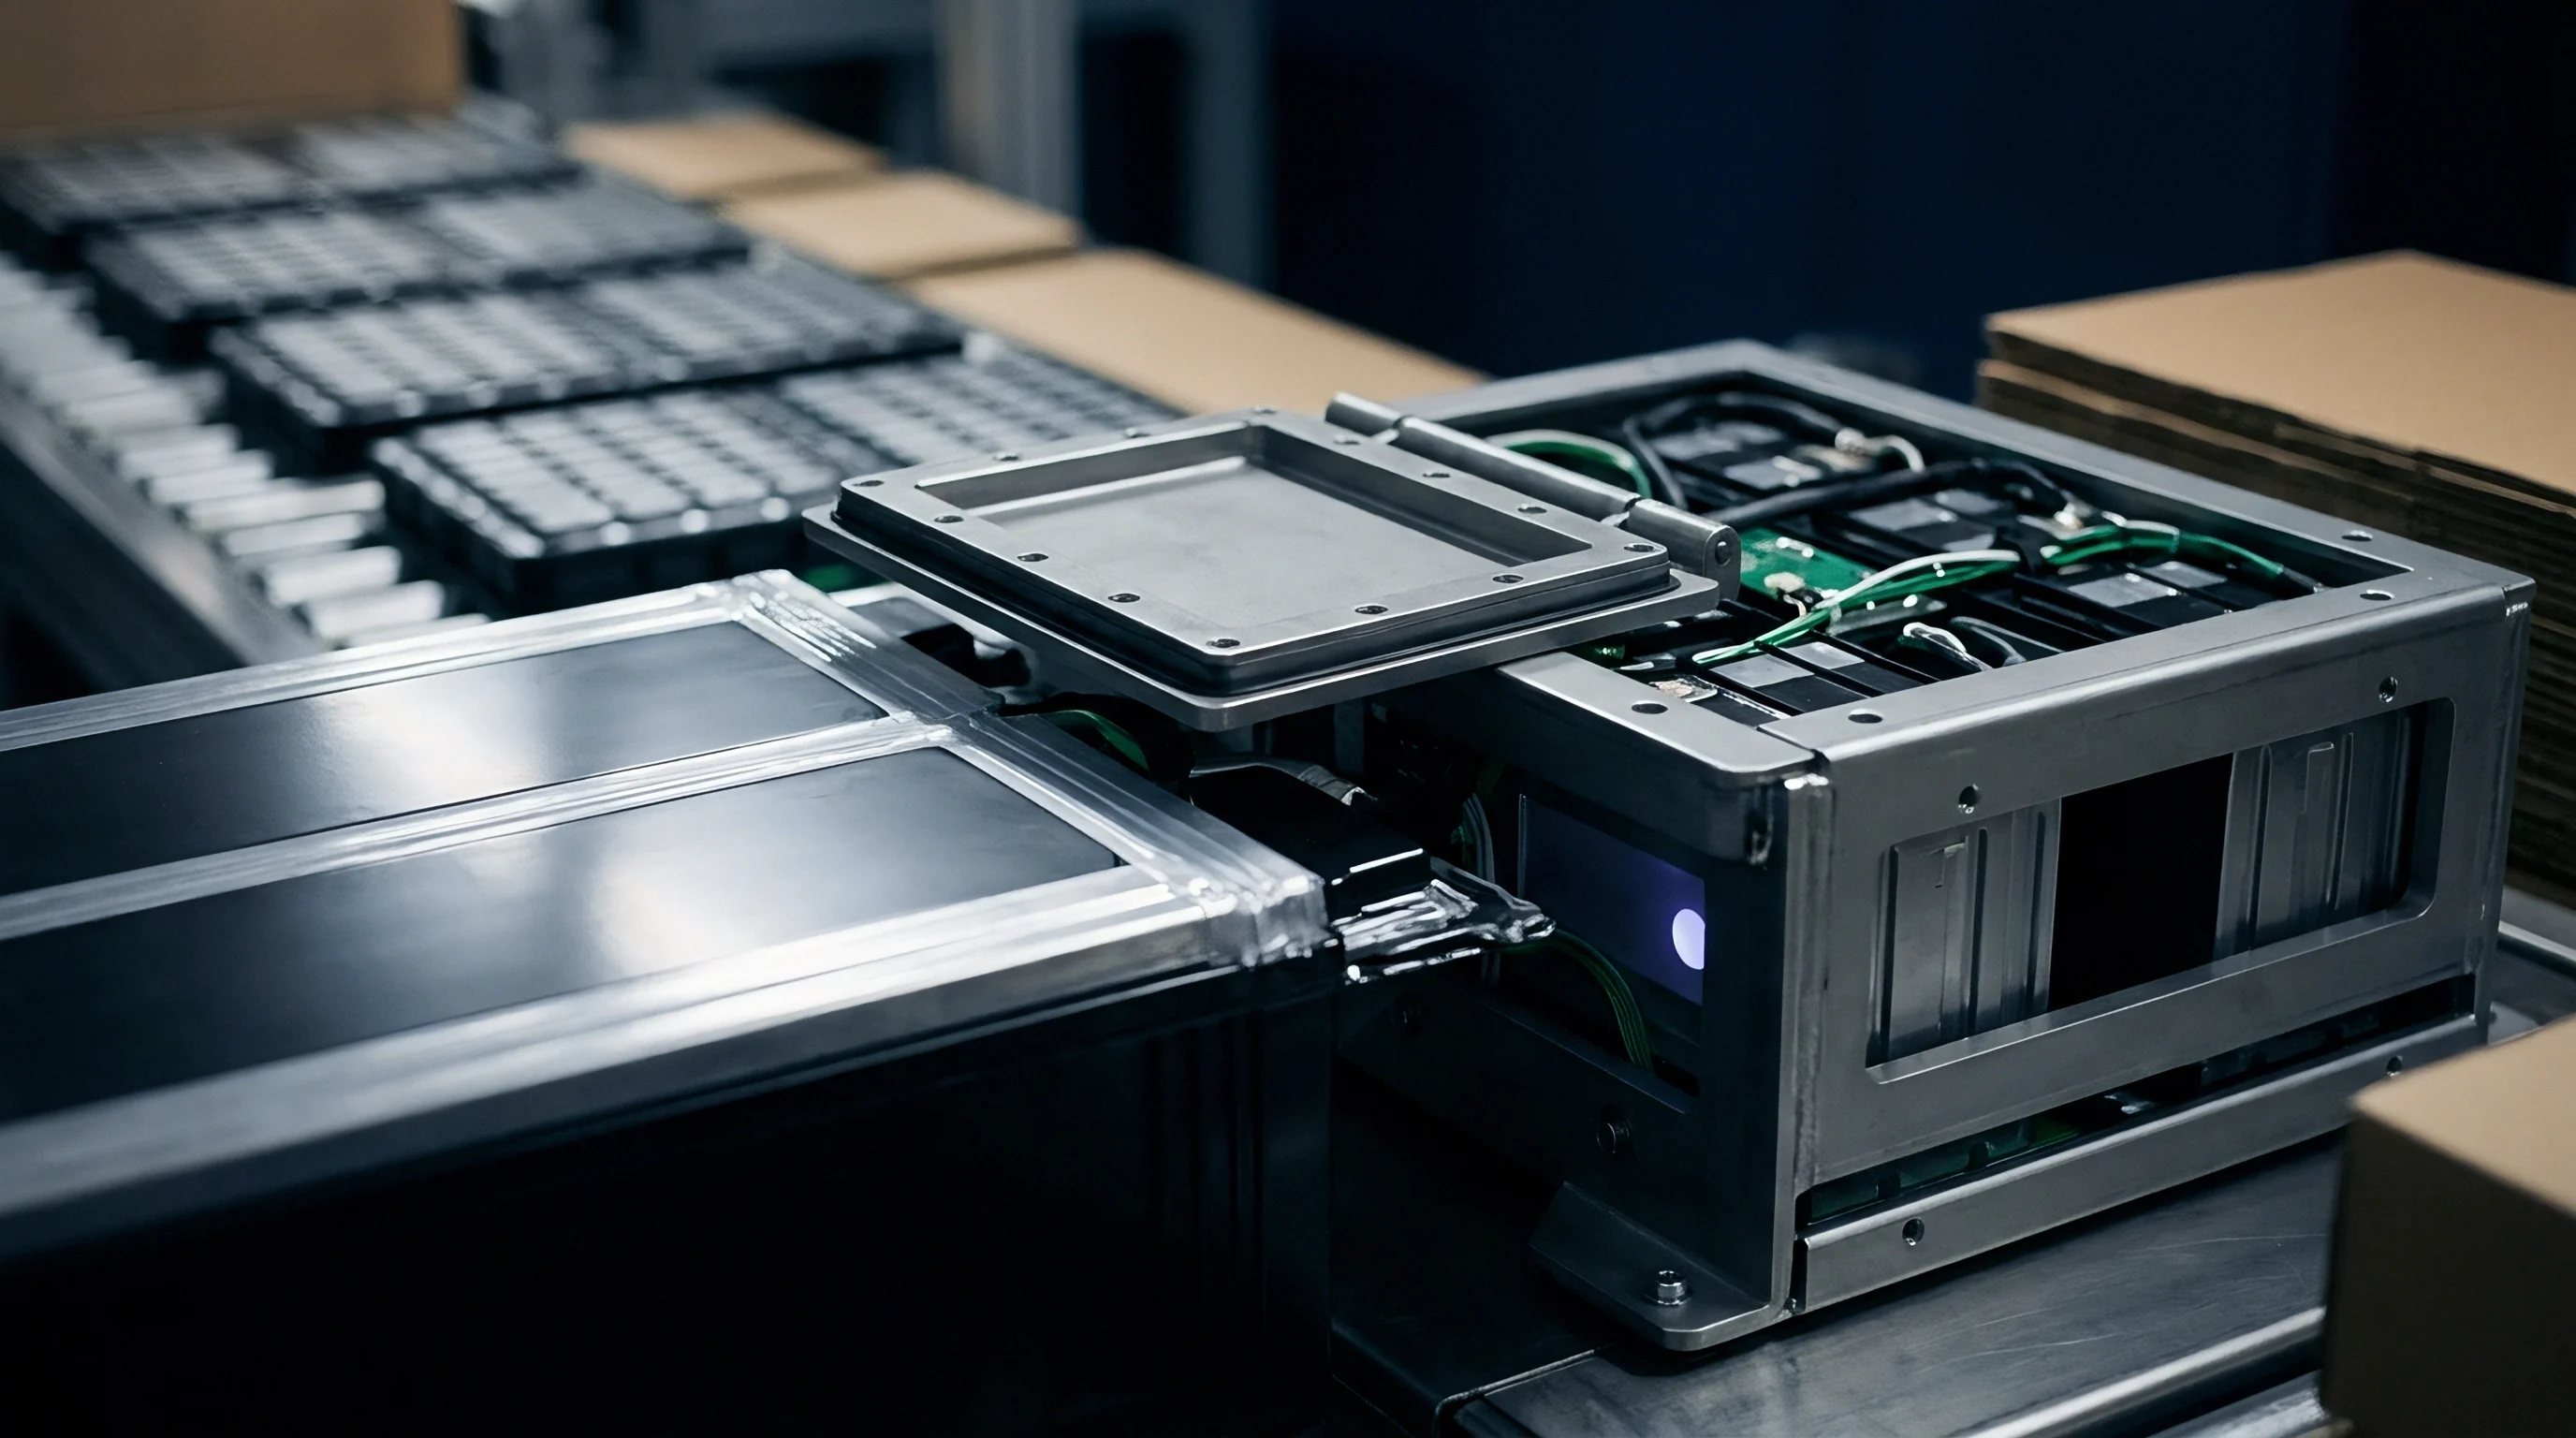
Electrolyte Solvation Sheath Restructuring
The solvent shell around a lithium cation imposes an energetic hurdle before charge transfer can proceed. In conventional EC electrolytes, molecular dynamics simulations confirm that the high dipole moment of ethylene carbonate forms a deep energy well. Stripping this shell as the ion enters the SEI demands substantial restructuring energy.
Replacing high-dipole solvents with weakly coordinating fluorinated compounds reduces this reorganization penalty. Operando three-electrode data confirm that lower desolvation energy shrinks the high-frequency DRT peak. This reduction in desolvation overpotential keeps the graphite anode above zero volts versus Li/Li+ during aggressive 15-minute charge cycles.
Desolvation activation energies above 60 kilojoules per mole force lithium deposition at temperatures below 10 degrees Celsius under a 2C charge rate.
Anode surface chemistry also affects desolvation dynamics. Functional groups on the outer SEI surface can serve as intermediate coordination sites that facilitate stepwise solvent removal. Fluorine-rich interphases derived from fluoroethylene carbonate (FEC) decomposition reduce the interfacial barrier, accelerating cation desolvation and subsequent solid-state migration.
High-speed voltage logging during current pulses shows that solvation overpotential establishes itself almost instantaneously. While concentration overpotentials take seconds to build across the separator, desolvation polarization manifests within microseconds. This immediate response makes desolvation resistance a primary driver of voltage spikes during high-rate regenerative braking pulses.
Monitoring the potential difference between working and reference terminals separates anode and cathode polarizations cleanly. Under fast-charge regimes, the negative electrode accounts for more than 70 percent of overall cell voltage hysteresis in early charging stages, highlighting the need to target anode interfacial kinetics when formulating electrolytes.
Structural reorganization of the solid electrolyte interphase during extended cycling may permanently shift the balance between desolvation resistance and charge transfer resistance.


Diagnostic
Converting impedance data into clear quality criteria helps engineering teams define precise cell specifications. Datasheet DC resistance values derived from brief pulses mask the underlying mechanisms driving cell polarization. Specs relying solely on bulk DC resistance fail to detect degradation modes that impede fast charging while leaving low-rate capacity unchanged.
Operando three-electrode diagnostics capture kinetic degradation before capacity loss appears in standard cycling. Rising desolvation resistance signals solvent breakdown or additive depletion. In contrast, increases in charge transfer resistance point to active material cracking, electronic isolation, or loss of electrochemically active surface area.

Lithium Plating Onset Verification
Tracking working electrode potential during fast charging identifies the threshold where metallic lithium begins to deposit. Thermodynamically, plating occurs whenever the intercalation anode potential falls below zero volts versus Li/Li+. High-rate charging pushes the anode potential negative through combined solvation and charge transfer overpotentials.
Operando metrology detects the characteristic voltage plateau marking the onset of lithium plating. Below zero volts, metallic lithium nucleates on the graphite through a competing reduction pathway. When current stops, the relaxation curve shows an unmistakable flat plateau near zero volts as the plated metal chemically re-intercalates into the host matrix.
The length of this plateau provides a direct measure of reversibly plated lithium mass.
- Anode Potential Margin Verification requires holding working anode potential strictly above 15 millivolts vs Li/Li+ across all validated fast-charge operating windows.
- Desolvation Peak Tracking mandates that the high-frequency DRT resistance contribution must not exceed 25 percent of total cell polarization at room temperature.
- Temperature Sensitivity Index specifies that the ratio of anode interfacial impedance at -10 degrees Celsius to that at 25 degrees Celsius remains below a factor of 8.0.
- Reference Drift Audit Protocols demand that reference potential drift must remain below 0.5 millivolts over a continuous 48-hour operando testing sequence.
- Solvent Depletion Screening establishes that growth in desolvation polarization exceeding 15 percent over 500 fast-charge cycles triggers mandatory electrolyte compositional analysis.
Measuring plating onset overpotentials allows development of adaptive fast-charging protocols. Instead of running rigid constant-current steps, battery management systems can adjust charging current in real time to keep anode potential safely above the zero-volt plating line. Operando three-electrode measurements provide the empirical baseline needed to calibrate these control loops.
Electrolyte qualification requires temperature-resolved three-electrode impedance sweeps. Two-electrode cell evaluations often yield false positives because low cathode impedance can hide severe anode polarization. Isolating anode kinetics via micro-reference testing ensures selected chemistries provide fast-charge capability without sacrificing stability or calendar life.
Impedance spectra recorded without secondary reference phase verification violate ISO 12405 battery qualification standards and invalidate cell warranty claims.
Batch quality audits also benefit from micro-reference sampling. Fluctuations in coating weight, slurry consistency, and calendering density produce noticeable shifts in charge transfer resistance. Catching these kinetic variances at incoming inspection prevents substandard cells from entering high-voltage modules where they limit overall charging speed.

Electrolyte Formulation Qualification Criteria
Commercial supply contracts increasingly depend on explicit empirical limits. Procurement specifications for fast-charging cells must detail test methodologies, including calibration standards, temperature hold times, and DRT extraction parameters. Ambiguity in test procedures invites costly commercial disputes when cells underperform in production.
Purchase agreements typically set maximum allowable growth rates for individual impedance components over life. A standard specification clause may require that following 1,000 fast-charge cycles at 3C and 25 degrees Celsius, anode desolvation resistance determined via three-electrode DRT must not exceed 1.5 times the initial value, with working anode potential remaining positive versus Li/Li+ up to 70 percent state of charge.
Such terms require manufacturers to control additive stability and interphase durability directly. Adding excess electrolyte cannot satisfy the requirement, as surplus solvent promotes gas generation and cuts volumetric density. Meeting the target requires optimizing the solvation shell and stabilizing the interphase.
Applying operando three-electrode testing to root-cause failure analysis accelerates warranty investigations. When field returns exhibit premature power fade during fast charging, micro-reference analysis distinguishes whether the drop stems from electrolyte degradation raising the desolvation barrier or mechanical particle isolation restricting charge transfer.
Standard screening methods that omit kinetic deconvolution frequently misdiagnose low-temperature power loss as SEI thickening, overlooking the gradual loss of low-solvation-energy co-solvents to side reactions.
Incorporating micro-reference requirements into technical procurement documentation guarantees that battery suppliers submit empirical kinetic validation rather than theoretical modeling.

Margin
Electrolyte formulation and electrode design directly influence cell manufacturing costs, warranty reserves, and pack-level cooling architecture. Using high-performance fluorinated solvents or imide salts like lithium bis(fluorosulfonyl)imide (LiFSI) drives up raw material expense per cell. However, this premium is often recovered through simpler, lower-cost thermal management systems at the pack level.
Reducing desolvation resistance curbs internal heat generation under high charge rates. Cells using low-desolvation electrolytes generate up to 40 percent less Joule heating during 4C charging. This lower thermal load permits smaller cooling plates, reduced chiller capacity, and lighter thermal insulation, yielding a net reduction in overall pack cost.

Fast Charge Warranty Risk Allocation
Warranty liabilities between cell suppliers and pack integrators depend heavily on verified kinetic limits. Fast-charge warranties carry substantial financial exposure for both EV manufacturers and grid storage operators. When cells suffer premature capacity loss from lithium plating driven by severe desolvation overpotentials, field replacement costs quickly erase operating margins.
Operando measurements define the operating boundaries necessary to maintain warranty coverage. Integrators operating cells within temperature-dependent limits validated by three-electrode testing can hold cell manufacturers accountable for premature degradation. Operating beyond those established limits voids warranty terms, returning financial risk to the integrator.
| Evaluation Criterion | Standard Carbonate Electrolyte | Advanced Fluorinated Electrolyte | Low-Solvation Ether Electrolyte |
|---|---|---|---|
| Raw Cell Manufacturing Cost ($/kWh) | $52.10 | $58.40 | $64.20 |
| Pack Thermal System Credit ($/kWh) | Baseline ($0.00) | -$4.20 | -$7.50 |
| 15-Minute Fast Charge Warranty Exposure | High (3.2% reserve) | Low (0.8% reserve) | Negligible (0.2% reserve) |
| UN 38.3 Transport Class Compliance Risk | Standard Pass | Standard Pass | Requires Gas Suppression Venting |
| Cycle Life to 80% Retention (4C Charge) | 450 cycles | 1,400 cycles | 2,100 cycles |
| Net Delivered Energy Cost ($/kWh/cycle) | $0.128 | $0.046 | $0.034 |
Delivered cost per kilowatt-hour over operating life remains the critical metric for cell selection. While advanced electrolytes increase upfront cell costs by 12 to 23 percent, extended fast-charge cycle life lowers total cost per delivered kilowatt-hour by over 60 percent. Procurement strategies that focus only on initial unit cost miss these lifecycle savings.
Regulatory compliance requirements also track electrolyte solvent choice. Volatile ethers and low-boiling esters designed to minimize desolvation resistance can alter off-gas composition during thermal runaway, creating flammability and toxicity concerns. Meeting UN 38.3 transport standards and UL 1973 stationary storage rules may necessitate additional pack venting provisions, partially offsetting the financial gains of lower cell impedance.

Pack Level Thermal Management Economics
Lower cell impedance at cold temperatures cuts pack pre-heating requirements. Packs built with high-desolvation cells require substantial energy from high-voltage PTC heaters to reach 25 degrees Celsius before fast charging can start. This pre-conditioning consumes battery capacity, cuts into cold-weather driving range, and extends station dwell times.
Low-desolvation formulations permit fast charging at 0 degrees Celsius without prior heating, conserving energy and shortening charging sessions. Reduced dwell times improve operational uptime and fleet efficiency for commercial operators, materially lowering total cost of ownership.
Balancing fast-charge performance and financial margin requires aligning chemistry specifications, BMS control strategies, and warranty terms around empirical operando three-electrode data. Standardizing micro-reference qualification protects integrators from premature field failures while capturing the cost benefits of low-impedance designs.
Insurance underwriting rates for utility-scale energy storage depend on demonstrated cell safety and verified plating margins. Facilities using cells with confirmed positive anode potential under dynamic charging qualify for lower property risk premiums. Empirical data from operando testing provide underwriters with the verification needed to assess project risk.
Investing in operando three-electrode metrology hardware pays dividends by shortening cell qualification cycles and clarifying supplier warranty terms. Understanding how to separate solvation stripping kinetics from charge transfer resistance enables technical teams to specify battery systems that deliver high cycle life, safety, and commercial return.