Interphase Degradation Mechanisms Driving Early Resistance Rise in Commercial Lithium Cells
Early lithium cell resistance rise stems from passive layer growth and cathode microcracking, shifting procurement risk to initial DCIR specifications.
Foil
Interphase growth on current collector surfaces sets baseline internal impedance before a commercial lithium cell ever undergoes cycle testing. Metallic foils provide the substrate where primary passivating films nucleate during formation. Standard cylindrical and prismatic designs use aluminum as the positive collector and copper as the negative.
Both metals oxidize differently when brought into contact with non-aqueous liquid electrolytes containing fluorinated salts such as lithium hexafluorophosphate (LiPF6).

Passivation Dynamics at Metallic Current Collectors
Wetting a foil with liquid electrolyte triggers electron transfer on contact. Exposure to ambient air during electrode manufacturing leaves an irregular native oxide containing hydroxides, carbonates, and non-stoichiometric oxides. Following cell fill, residual moisture reacts with hexafluorophosphate anions to form hydrofluoric acid, which strips these unstable surface species and etches the bare metal substrate.
Interfacial resistance rises noticeably before any measurable capacity loss appears in cycle data.
This localized corrosion alters contact resistance between the current collector and active coating. On the positive side, aluminum passivates in carbonate solvents above 3.0 volts relative to lithium metal, developing a surface film of insoluble aluminum fluoride (AlF3) and residual aluminum oxides. If electrolyte salt concentrations are sufficient, this layer halts corrosion.
Otherwise, micro-pitting develops across the foil surface, introducing several milliohms of interfacial contact resistance during the opening cycle blocks.

Anodic Dissolution and Surface Oxide Passivation
Commercial-grade aluminum positive collectors depend on this thin barrier layer. As formation charging drives potentials beyond 4.2 volts, native hydroxides convert into a dense halide film. The protective quality of the film depends on salt concentration and solvent chemistry: linear carbonates such as dimethyl carbonate (DMC) promote uniform film growth, whereas cyclic carbonates like ethylene carbonate (EC) possess higher dielectric constants that marginally increase the solubility of aluminum salts.
Contact resistance between aluminum foil and cathode slurry drifts upward when local current densities become uneven. Microscopic voids at the interface restrict electron transport into the cathode matrix, shifting the high-frequency ohmic intercept upward in early AC impedance spectra. To stabilize this interface against hydrofluoric acid attack, manufacturers frequently coat the foil with a 1 to 3 micrometer conductive carbon layer.

Cathodic Interface Kinetics on Copper Substrates
Negative collectors exhibit distinct surface chemistry during early film nucleation. Copper reduces at low potentials during the initial charge. Below 1.5 volts relative to lithium, native CuO and Cu2O reduce or dissolve, releasing soluble copper ions into the adjacent interphase.
These ions either redeposit as metallic dendrites or become embedded inside the solid electrolyte interphase on the graphite anode.
Direct current internal resistance grows by 18 percent within 300 cycles at 45 degrees Celsius when native oxide layer thickness on copper current collectors exceeds 4.5 nanometers prior to electrolyte filling.
Copper dissolution across these lower potential boundaries yields an irregular interphase. During deep discharge, if the negative electrode climbs past 3.5 volts, copper oxidation accelerates. Dissolved copper crosses the separator and deposits onto the cathode, establishing localized micro-shorts and driving up charge-transfer resistance.
Keeping raw copper foil clean and minimizing native oxide thickness limits early direct current internal resistance (DCIR) growth during storage and cycling.
Initial DCIR increases often reflect minor wetting variability across dense electrode rolls rather than interphase breakdown.


Growth
Solid electrolyte interphase growth on graphite anodes governs early capacity fade and impedance rise. Between 0.8 and 0.2 volts relative to lithium metal, organic carbonate solvents reduce into a passivating barrier that blocks electron tunneling from the graphite while allowing lithium-ion conduction. Ongoing structural rearrangement and mechanical degradation of this layer consume electrolyte and thicken the interphase continuously.

Thermodynamic Instability of Inorganic Passivation Components
Carbonate solvents are thermodynamically unstable at the operating potentials of lithiated graphite. The resulting SEI forms a bilayer structure: an inorganic inner layer against the graphite substrate and an organic outer layer facing bulk electrolyte. The inner region contains low-molecular-weight species, primarily lithium fluoride (LiF), lithium oxide (Li2O), and lithium carbonate (Li2CO3).
Their wide bandgaps and low electronic conductivity arrest parasitic electron transfer, provided the film remains intact.
Lithium Ethylene Dicarbonate Decomposition Paths
Ethylene carbonate reduction yields volatile ethylene gas alongside insoluble organic salts, predominantly lithium ethylene dicarbonate (LEDC) in the outer interphase layer. Formed through single-electron reduction during initial formation, LEDC is only metastable in standard commercial electrolytes. Above 40 degrees Celsius, it decomposes into lithium carbonate, ethylene, and carbon dioxide.
Failure to meet the storage test provisions of IEC 62660-1 section 7.6 forfeits manufacturer replacement rights for cells displaying direct current resistance growth above baseline.
This thermal decomposition disrupts the structural integrity of the film. As LEDC breaks down, the layer turns porous, exposing bare graphite facets to solvent and prompting further reduction reactions that thicken the interphase. Symmetric cell testing in 1.0 M LiPF6 in EC:EMC between 20 and 50 degrees Celsius gives an activation energy of 0.65 electron-volts for lithium-ion transport through the organic layer; higher salt concentrations or the addition of 2 percent fluoroethylene carbonate increases this value to 0.78 electron-volts as dense LiF precipitates.

Solvent Depletion Kinetics and Interphase Densification
Continuous solvent reduction thickens the surface film over operational life. As volatile compounds and organic salts break down, the interphase shifts toward an inorganic composition dominated by lithium fluoride and lithium carbonate. Although LiF is chemically stable, its bulk ionic conductivity falls well below that of the organic components it supplants.
| Layer Component | Chemical Formula | Ionic Conductivity (S/cm at 25°C) | Activation Energy (eV) | Primary Degradation Mechanism |
|---|---|---|---|---|
| Lithium Fluoride | LiF | 1.0 × 10⁻⁹ | 0.72 | Precipitation from HF reaction, high resistance |
| Lithium Carbonate | Li2CO3 | 1.0 × 10⁻⁸ | 0.58 | LEDC thermal decomposition, gas generation |
| Lithium Ethylene Dicarbonate | (CH2OCO2Li)2 | 1.0 × 10⁻⁶ | 0.45 | Thermal breakdown into inorganic phases |
| Lithium Oxide | Li2O | 1.0 × 10⁻¹⁰ | 0.85 | Trace moisture reaction, dense barrier layer |
| Lithium Alkyl Carbonates | ROCO2Li | 5.0 × 10⁻7 | 0.50 | Solvent oxidation cross-linking and swelling |
| Data derived from symmetric cell impedance spectroscopy and differential electrochemical mass spectrometry across standard commercial electrolyte formulations. | ||||
This densification impedes lithium-ion transport into the graphite host lattice. As the film grows from roughly 5 nanometers after formation to 50 nanometers over several hundred cycles, the activation barrier for ion migration climbs. The resulting increase in charge-transfer resistance impairs power capability, particularly at lower operating temperatures and high discharge currents.
The accumulation of resistive products at the graphite interphase steadily reduces active surface area through several distinct mechanisms:
- Hydrofluoric Acid Attack occurs when ambient water traces react with lithium salt, accelerating inorganic layer dissolution and micro-cracking.
- Solvent Molecule Co-Intercalation ruptures surface graphite layers, creating fresh reaction sites that accelerate interphase growth.
- Gas Generation Dynamics cause localized delamination of organic interphase components, inducing uneven current distribution across the electrode plate.
- Lithium Trap Accumulation locks active lithium ions permanently into insoluble interphase salts, reducing cell inventory.
- Additive Oligomerization forms high-molecular-weight poly-carbonates that increase electrolyte viscosity at the porous separator boundary.
Elevated storage temperatures shift the underlying reaction pathways at the interphase.
Cells stored at 45 degrees Celsius exhibit double the resistance growth of baseline samples held at 25 degrees Celsius. Thermal stress destabilizes organic constituents, converting them into resistive inorganic salts faster than standard parabolic kinetics predict. Pairing high storage temperatures with high states of charge accelerates this pathway, generating measurable resistance offsets well before any noticeable drop in capacity.
Storage under elevated ambient temperatures accelerates interphase restructuring far more severely than continuous low-rate cycling.

Cracking
Mechanical degradation within positive electrode particles repeatedly exposes fresh crystal facets to liquid electrolyte. High-nickel layered oxides, including NMC811 (LiNi0.8Mn0.1Co0.1O2) and NCA (LiNi0.85Co0.10Al0.05O2), experience anisotropic lattice strain during lithium insertion and extraction. Dimensional changes along the crystallographic c-axis generate internal micro-strain throughout polycrystalline secondary particles, forming intra- and inter-granular microcracks during high-voltage cycling.

Cathode Electrolyte Interphase Degradation under High Voltages
Operating high-nickel chemistries above 4.15 volts vs Li/Li+ induces surface phase transformations, converting the layered crystal lattice into an inactive NiO-like rocksalt structure. This oxygen-depleted surface possesses poor electronic and ionic conductivity, forming a resistive cathode electrolyte interphase (CEI).
The resulting CEI differs in composition from the anode SEI. At high cathode potentials, oxidative solvent breakdown yields polyether- and carbonate-based oligomers mixed with inorganic LiF. As operating voltages approach 4.4 volts, accelerated oxidation generates acidic byproducts that corrode the active material surface.
Particle Micro-Fracturing and Fresh Surface Exposure
Anisotropic lattice strain fractures secondary polycrystalline particles along primary grain boundaries during cycling. This internal cracking allows liquid electrolyte to penetrate deep into particle interiors, where freshly exposed crystal facets oxidize immediately on contact.
Mechanical fracturing creates an ongoing degradation loop: newly exposed surfaces consume active lithium and solvent to passivate. As CEI material builds up within internal fissures, grain swelling electrically isolates primary particles from the conductive network, appearing in impedance spectra as a steep rise in intra-particle charge-transfer resistance during early cycling.
Transition Metal Dissolution and Anode Interphase Poisoning
Dissolved manganese, nickel, and cobalt migrate across the separator along concentration gradients. HF in the electrolyte attacks transition metal cations at exposed crack boundaries. Manganese leaches readily as Mn2+, diffusing through the porous separator to the negative electrode.
Published kinetic rates for transition metal crossover from high-nickel cathodes to the graphite anode interphase vary by more than 300 percent depending on separator porosity and electrolyte additive formulations. Because laboratory calibration cannot isolate this crossover rate in finished commercial cells without teardown, buyers often apply an upper cutoff voltage buffer 50 millivolts below supplier limits during field commissioning.
Higher continuous upper cutoff voltages accelerate cathode surface reconstruction into resistive rock-salt phases before bulk lithium loss manifests in discharge capacity curves.
At the negative electrode, transition metal cations displace lithium within the SEI. Deposited manganese and nickel serve as catalytic sites for ongoing solvent reduction, compromising the electronic insulation of the anode film and consuming additional active lithium. This cross-talk directly couples cathode particle cracking to accelerated resistance growth at the anode.
Whether surface coatings like atomic-layer-deposited alumina can completely eliminate transition metal migration across high-nickel cell platforms remains an open question for long-duration energy storage.

Impedance
Frequency-domain measurements link microscopic material breakdown to macroscopic cell power loss. Electrochemical impedance spectroscopy (EIS) separates charge transfer, ionic diffusion, and interphase resistance across distinct time constants, allowing engineers to track specific failure mechanisms without destructive physical analysis.

Deconvolution of High-Frequency and Charge-Transfer Resistance
Nyquist plots from commercial cells exhibit distinct semicircular features across separate frequency domains. The high-frequency real-axis intercept measures pure ohmic resistance: bulk electrolyte conductivity, separator tortuosity, foil resistance, and tab welds. Upward drift in this ohmic baseline indicates electrolyte dry-out or current collector corrosion during storage.
The high-to-mid frequency arc (typically 10 kHz to 100 Hz) reflects lithium-ion migration through passivating surface films, with its diameter scaling directly with film thickness and composition. The intermediate arc (100 Hz to 1 Hz) captures charge-transfer resistance coupled with double-layer interface capacitance, while the low-frequency tail below 1 Hz represents solid-state Warburg diffusion within the active particles.
What Drives Interphase Resistance Spikes before Capacity Drops?
Early degradation frequently manifests as a sharp increase in charge-transfer resistance while discharge capacity remains stable. Because early interphase growth consumes only a small fraction of the total lithium inventory, amp-hour capacity is preserved. However, film densification and transition metal contamination raise the energetic barrier for ion desolvation and electron transfer at active surface sites.
| State of Charge (%) | Ohmic Resistance R-Ohm (mΩ) | Interphase Resistance R-SEI (mΩ) | Charge Transfer Resistance R-CT (mΩ) | Activation Energy Ea (eV) |
|---|---|---|---|---|
| 10 | 14.2 | 8.5 | 22.1 | 0.62 |
| 50 | 13.8 | 6.2 | 11.4 | 0.51 |
| 90 | 13.9 | 6.8 | 14.8 | 0.54 |
Holding cells at high states of charge (above 80 percent) accelerates interphase restructuring. As detailed in the table above, charge-transfer resistance accounts for the majority of overall cell impedance at low SOC, where desolvation encounters higher thermodynamic barriers.
Temperature Dependence of Interphase Activation Energy
Temperature alters ionic transport through surface films according to Arrhenius kinetics. Measuring impedance between minus 20 and plus 55 degrees Celsius provides activation energies that flag structural transitions within the interphase.
During lot qualification, impedance deconvolution separates solid electrolyte layer growth from charge-transfer kinetics. An abrupt rise in measured activation energy indicates a transition from organic carbonate-rich transport to resistive inorganic lithium fluoride accumulation, allowing early detection of particle boundary degradation prior to measurable capacity loss.
Direct current pulse testing, such as the Hybrid Pulse Power Characterization (HPPC) protocol, complements AC impedance spectroscopy. DC pulses measure combined ohmic, interphase, and charge-transfer resistance alongside short-term concentration polarization across 10-second windows. The ratio between high-frequency AC impedance and DC pulse resistance provides a clear metric for separating charge-transfer degradation from simple electrolyte drying in commercial modules.
Screening
Factory quality control relies on automated electrical sorting prior to module packaging and shipment. Screening protocols must isolate cells vulnerable to rapid resistance growth caused by formation defects, chemical contamination, or uneven foil oxidation. Because early resistance growth frequently aligns with accelerated self-discharge, sorting preserves long-term string balance.
K-Value Measurement and Shelf-Storage Resistance Growth
Voltage drop during post-formation rest reflects internal self-discharge rates. This metric, termed the K-value, tracks open-circuit voltage decay in millivolts per day. High K-values indicate either micro-shorts or ongoing parasitic solvent reduction across the electrodes.
Self-discharge screening requires storage periods of 7 to 28 days at controlled temperatures. Cells with elevated K-values experience continuous interphase growth driven by parasitic electron leakage through film defects. Rejecting these cells during production prevents premature cell divergence and module-level impedance imbalances in series strings.

Pulse Power Testing and AC Impedance Correlation
Short DC current pulses capture total effective resistance, including charge-transfer limitations. Manufacturing lines often rely on 1 kHz AC resistance (ACIR) checks because measurements take under 100 milliseconds per cell. However, 1 kHz ACIR captures almost exclusively ohmic resistance, missing film growth and interfacial charge-transfer degradation.
Alternating current impedance measured at one kilohertz underestimates early drive-cycle power capability loss by omitting charge transfer resistance.
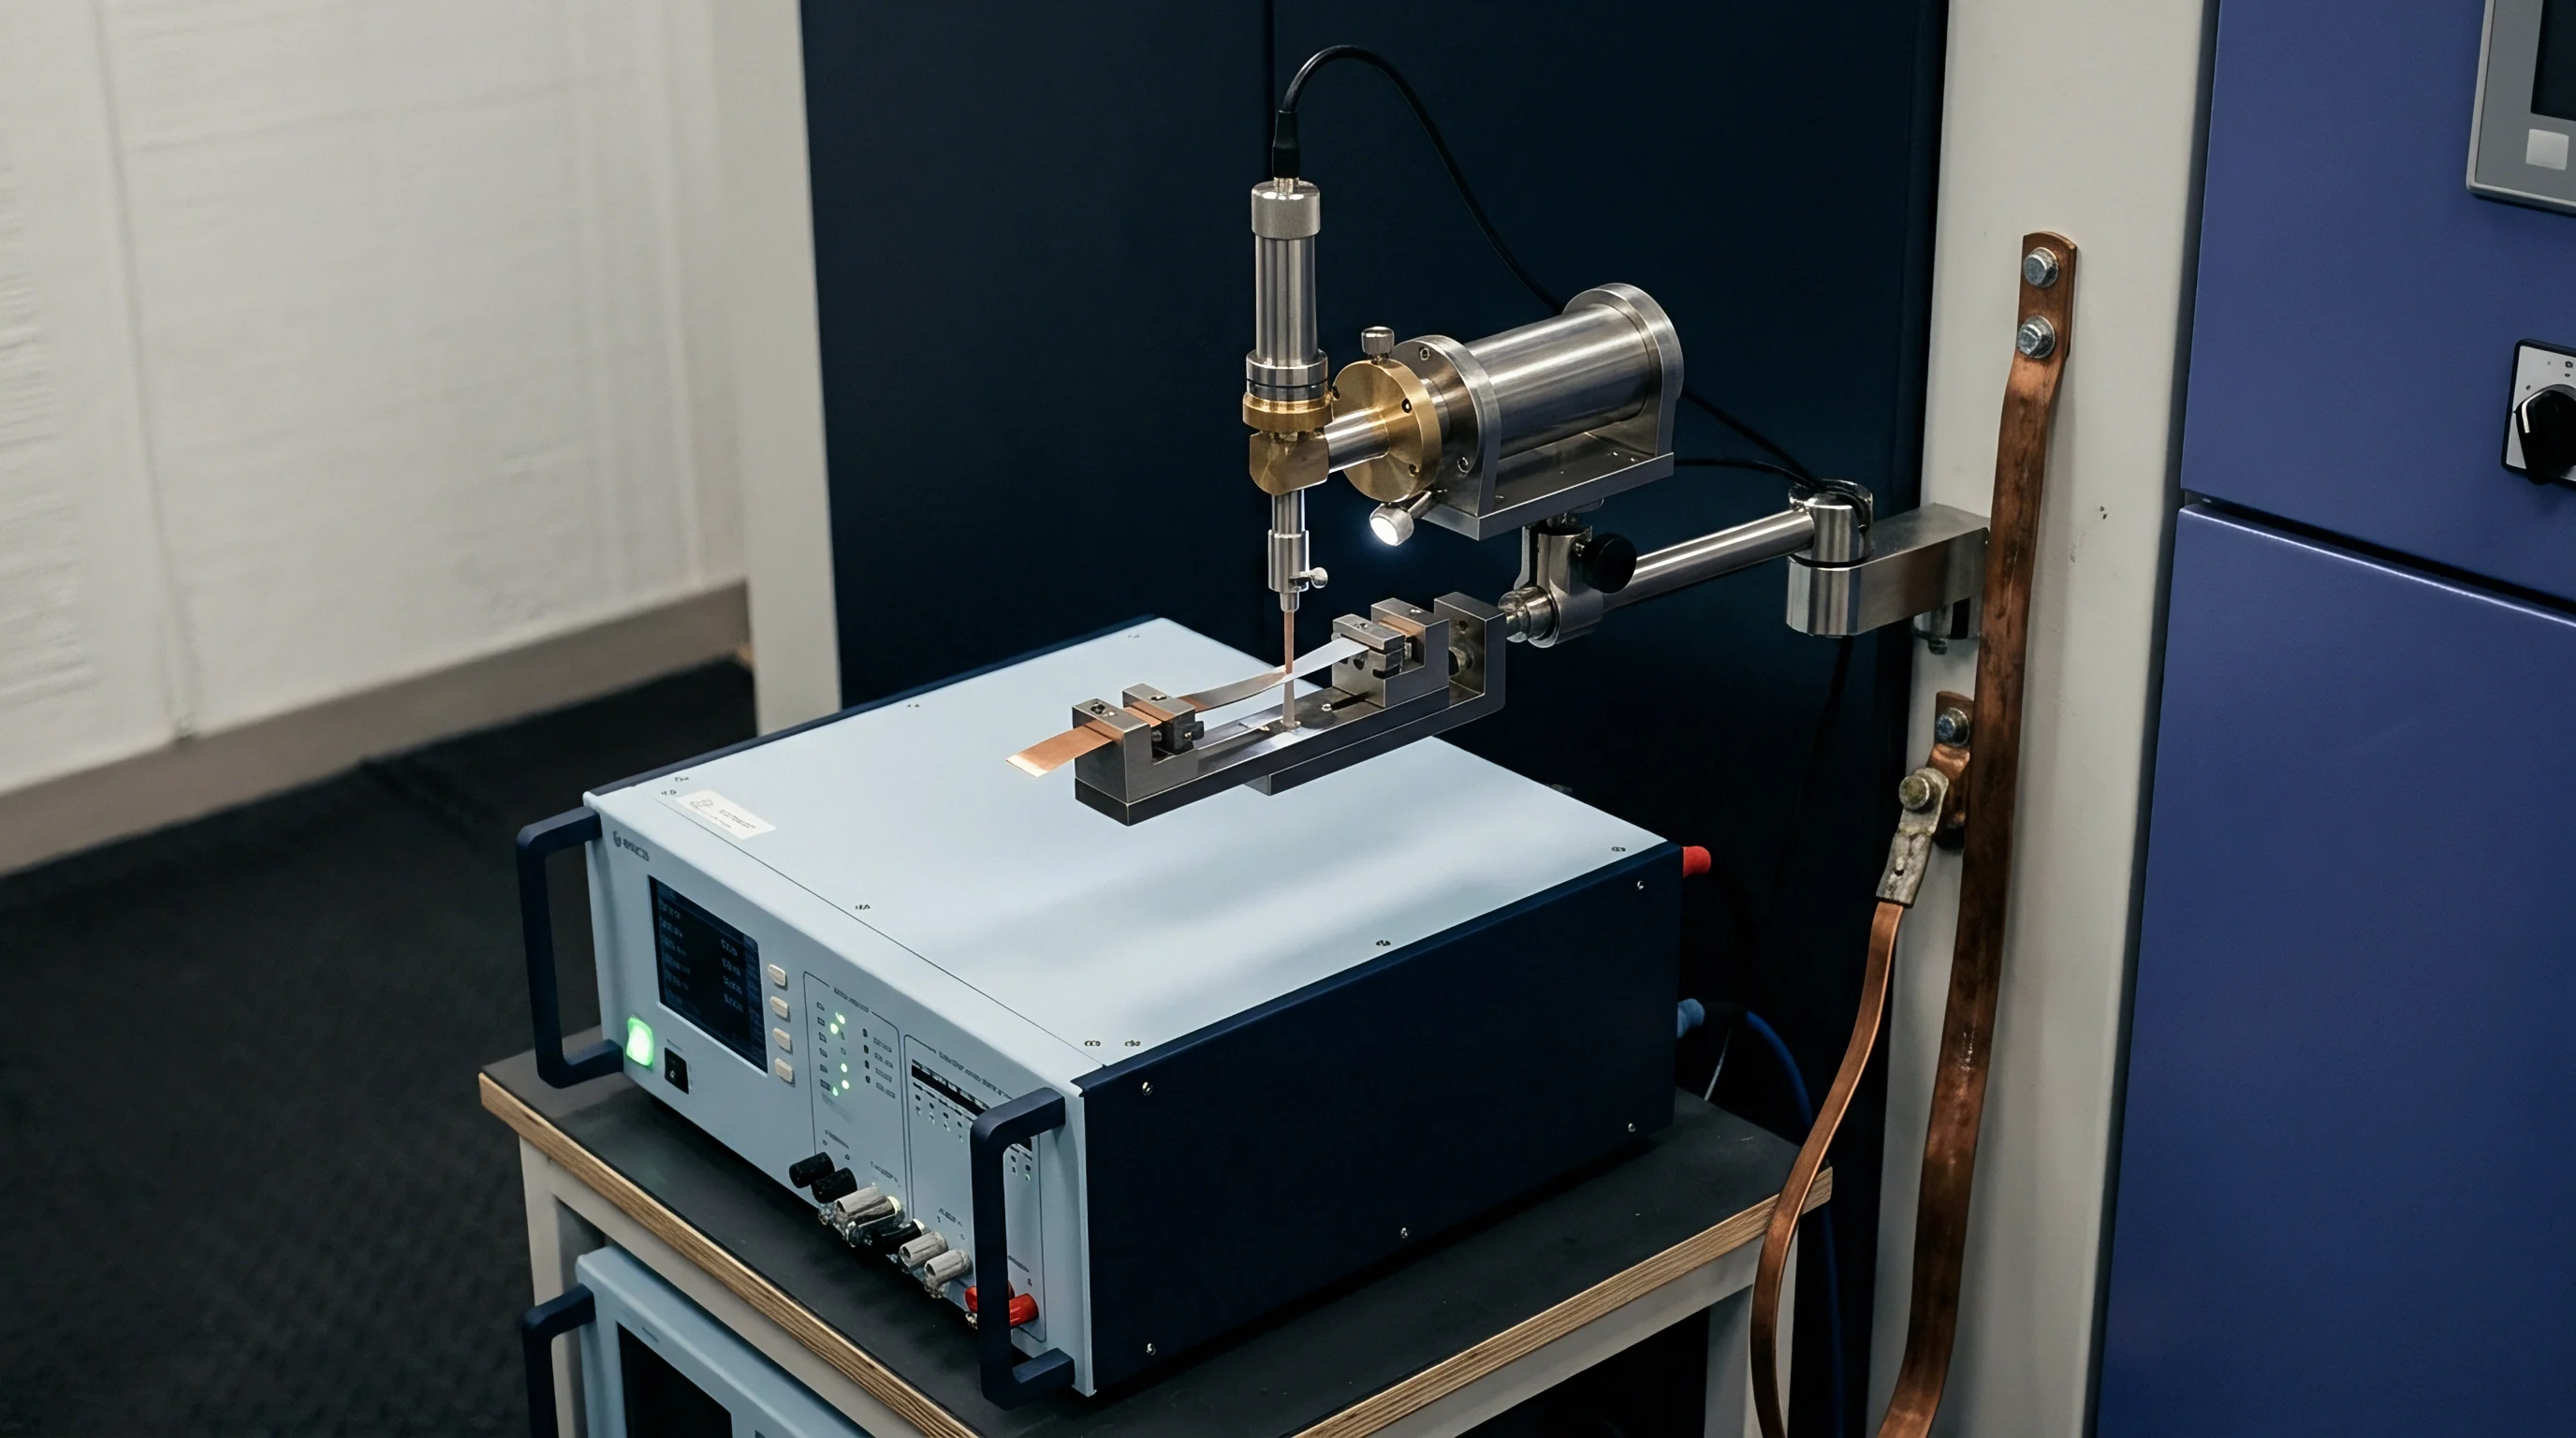
Production screening lines increasingly incorporate DC pulse power testing (DCIR) with 1-second to 10-second current pulses to evaluate interphase film condition. Comparing 1 kHz ACIR to 10-second DCIR establishes a diagnostic ratio: a rising DCIR-to-ACIR ratio signals selective interphase degradation and cathode particle cracking while bulk electrolyte conductivity remains steady.
Batch Qualification Procedures for Incoming Cell Shipments
Receiving inspection frameworks use statistical sampling on incoming lots to catch batch-to-batch variation. Quality assurance teams apply structured incoming screening sequences to validate supplier data before packing cells into modules.
- Visual and dimensional inspection verifies envelope cell thickness, tab alignment, and lack of seal leakage under high-humidity storage conditions.
- Initial open-circuit voltage and 1 kHz ACIR screening establishes baseline population distribution statistics for incoming lot characterization.
- Ten-second direct current discharge and charge pulse power characterization measures combined ohmic, interphase, and charge-transfer resistance across state-of-charge points.
- High-temperature shelf-storage testing at 45 degrees Celsius for 28 days accelerates interphase aging to quantify resistance growth rate slopes.
- Post-storage differential capacity analysis (dQ/dV) tracks active lithium loss and structural cathode phase changes under low-rate C/20 cycle checks.
The baseline industry standard of a 15 percent direct current resistance increase over 500 cycles assumes 1C continuous charge-discharge cycling at 25 degrees Celsius under specified clamp pressure; testing at 45 degrees Celsius or with inadequate mechanical restraint raises this degradation rate by a factor of 2.4.
Incorporating Section 6.2 of IEC 62660-1 into supply contracts forces cell manufacturers to warrant direct current internal resistance limits under defined pulse profiles rather than relying on one-kilohertz alternating current measurements.
Tariff
Project economics in utility and industrial storage depend on holding cell internal resistance within strict operating bounds. Upfront purchase price represents only initial capital outlay. Premature resistance growth increases thermal losses, lowers round-trip efficiency, and forces early capacity augmentation or module replacement well ahead of financial payback targets.
Landed Cost Penalty of Early Resistance Escalation
Unplanned resistance growth lowers round-trip efficiency while driving up HVAC auxiliary loads. Elevated DC resistance causes higher Joule heating (I²R losses) during charge and discharge, forcing thermal management systems to run longer and consuming parasitic site power.
Total lifetime cost is governed by cumulative energy throughput per dollar invested. When cell resistance spikes early, battery management systems reach low-voltage cutoff limits prematurely under load, stranding usable energy within the pack. This penalty can increase the effective landed cost per delivered kilowatt-hour by up to 25 percent over a 10-year project life.

Warranty Reserve Calculations and Degradation Financial Modeling
Warranty exposure modeling depends on dependable forecasts of impedance rise over 10- to 15-year terms. Standard cell warranties guarantee 80 percent remaining capacity over a stated duration or cycle count. However, high-power duty cycles ~ such as frequency regulation or heavy transport ~ frequently reach operational power limits long before cell capacity falls to 80 percent.
| Parameter | Standard Interphase Cell Grade | Premium Passivated Interphase Cell Grade | Financial Delta Impact |
|---|---|---|---|
| Initial Cell Cost ($/kWh) | $85.00 | $98.00 | +$13.00/kWh initial premium |
| Year 3 DCIR Growth (%) | +38% | +12% | -26% resistance growth rate |
| Pack Round-Trip Efficiency (Year 3) | 84.2% | 91.5% | +7.3% operational efficiency |
| Cooling Energy Overhead (kWh/year) | 4,800 kWh | 1,900 kWh | 2,900 kWh annual savings |
| Projected Year 5 Augmentation Needs | 25 kWh addition | 0 kWh addition | $2,125 augmentation savings |
| Landed Cost per Delivered kWh-Cycle | $0.072 | $0.054 | -$0.018 per delivered cycle kWh |
Warranty reserve requirements expand when cell lots exhibit rapid interphase growth. If rising resistance pushes modules beyond thermal limits, system operators must either derate power output or invest in supplemental cooling retrofits. To limit exposure, buyers peg procurement warranties directly to DC pulse resistance thresholds.

Contractual Provisions for Interphase Resistance Specifications
Utility supply contracts require explicit caps on resistance growth rates. Relying strictly on standard capacity retention terms leaves asset owners unprotected against premature power loss. Effective supply agreements incorporate defined impedance limits:
- Direct Current Pulse Resistance Limits establish absolute maximum DCIR values measured via standard 10-second pulses at specified states of charge and temperatures.
- Accelerated Storage Growth Guarantees specify maximum allowable DCIR increases following 30-day storage trials at 45 degrees Celsius.
- Differential Capacity Retention Thresholds mandate minimum acceptable peak heights in dQ/dV profiles to cap cathode micro-cracking and lithium loss.
- Batch Sorting Uniformity Clauses penalize suppliers if cell-to-cell DCIR variance within a single delivery lot exceeds 5 percent from the mean.
Failing to tie cell degradation guarantees to pulse-power resistance growth leads directly to unrecoverable warranty claims when battery packs suffer premature power fade in industrial duty.