Microstructural Characterization Methods for Polyolefin Battery Separator Membranes
Polyolefin separator microstructures require correlated electron imaging, flow porosimetry, and transport testing to set baseline metrics that prevent cell short circuits.

Morphology
Polyolefin separator membranes in lithium-ion battery cells control ionic transport while keeping positive and negative electrodes mechanically isolated. Their internal network of sub-micron voids and polymer fibrils dictates electrolyte retention, internal resistance, and resistance to metallic dendrite penetration. Characterizing these features requires analytical tools capable of resolving spatial detail from 5 nanometers up to tens of micrometers without degrading low-melting-point polymer structures.
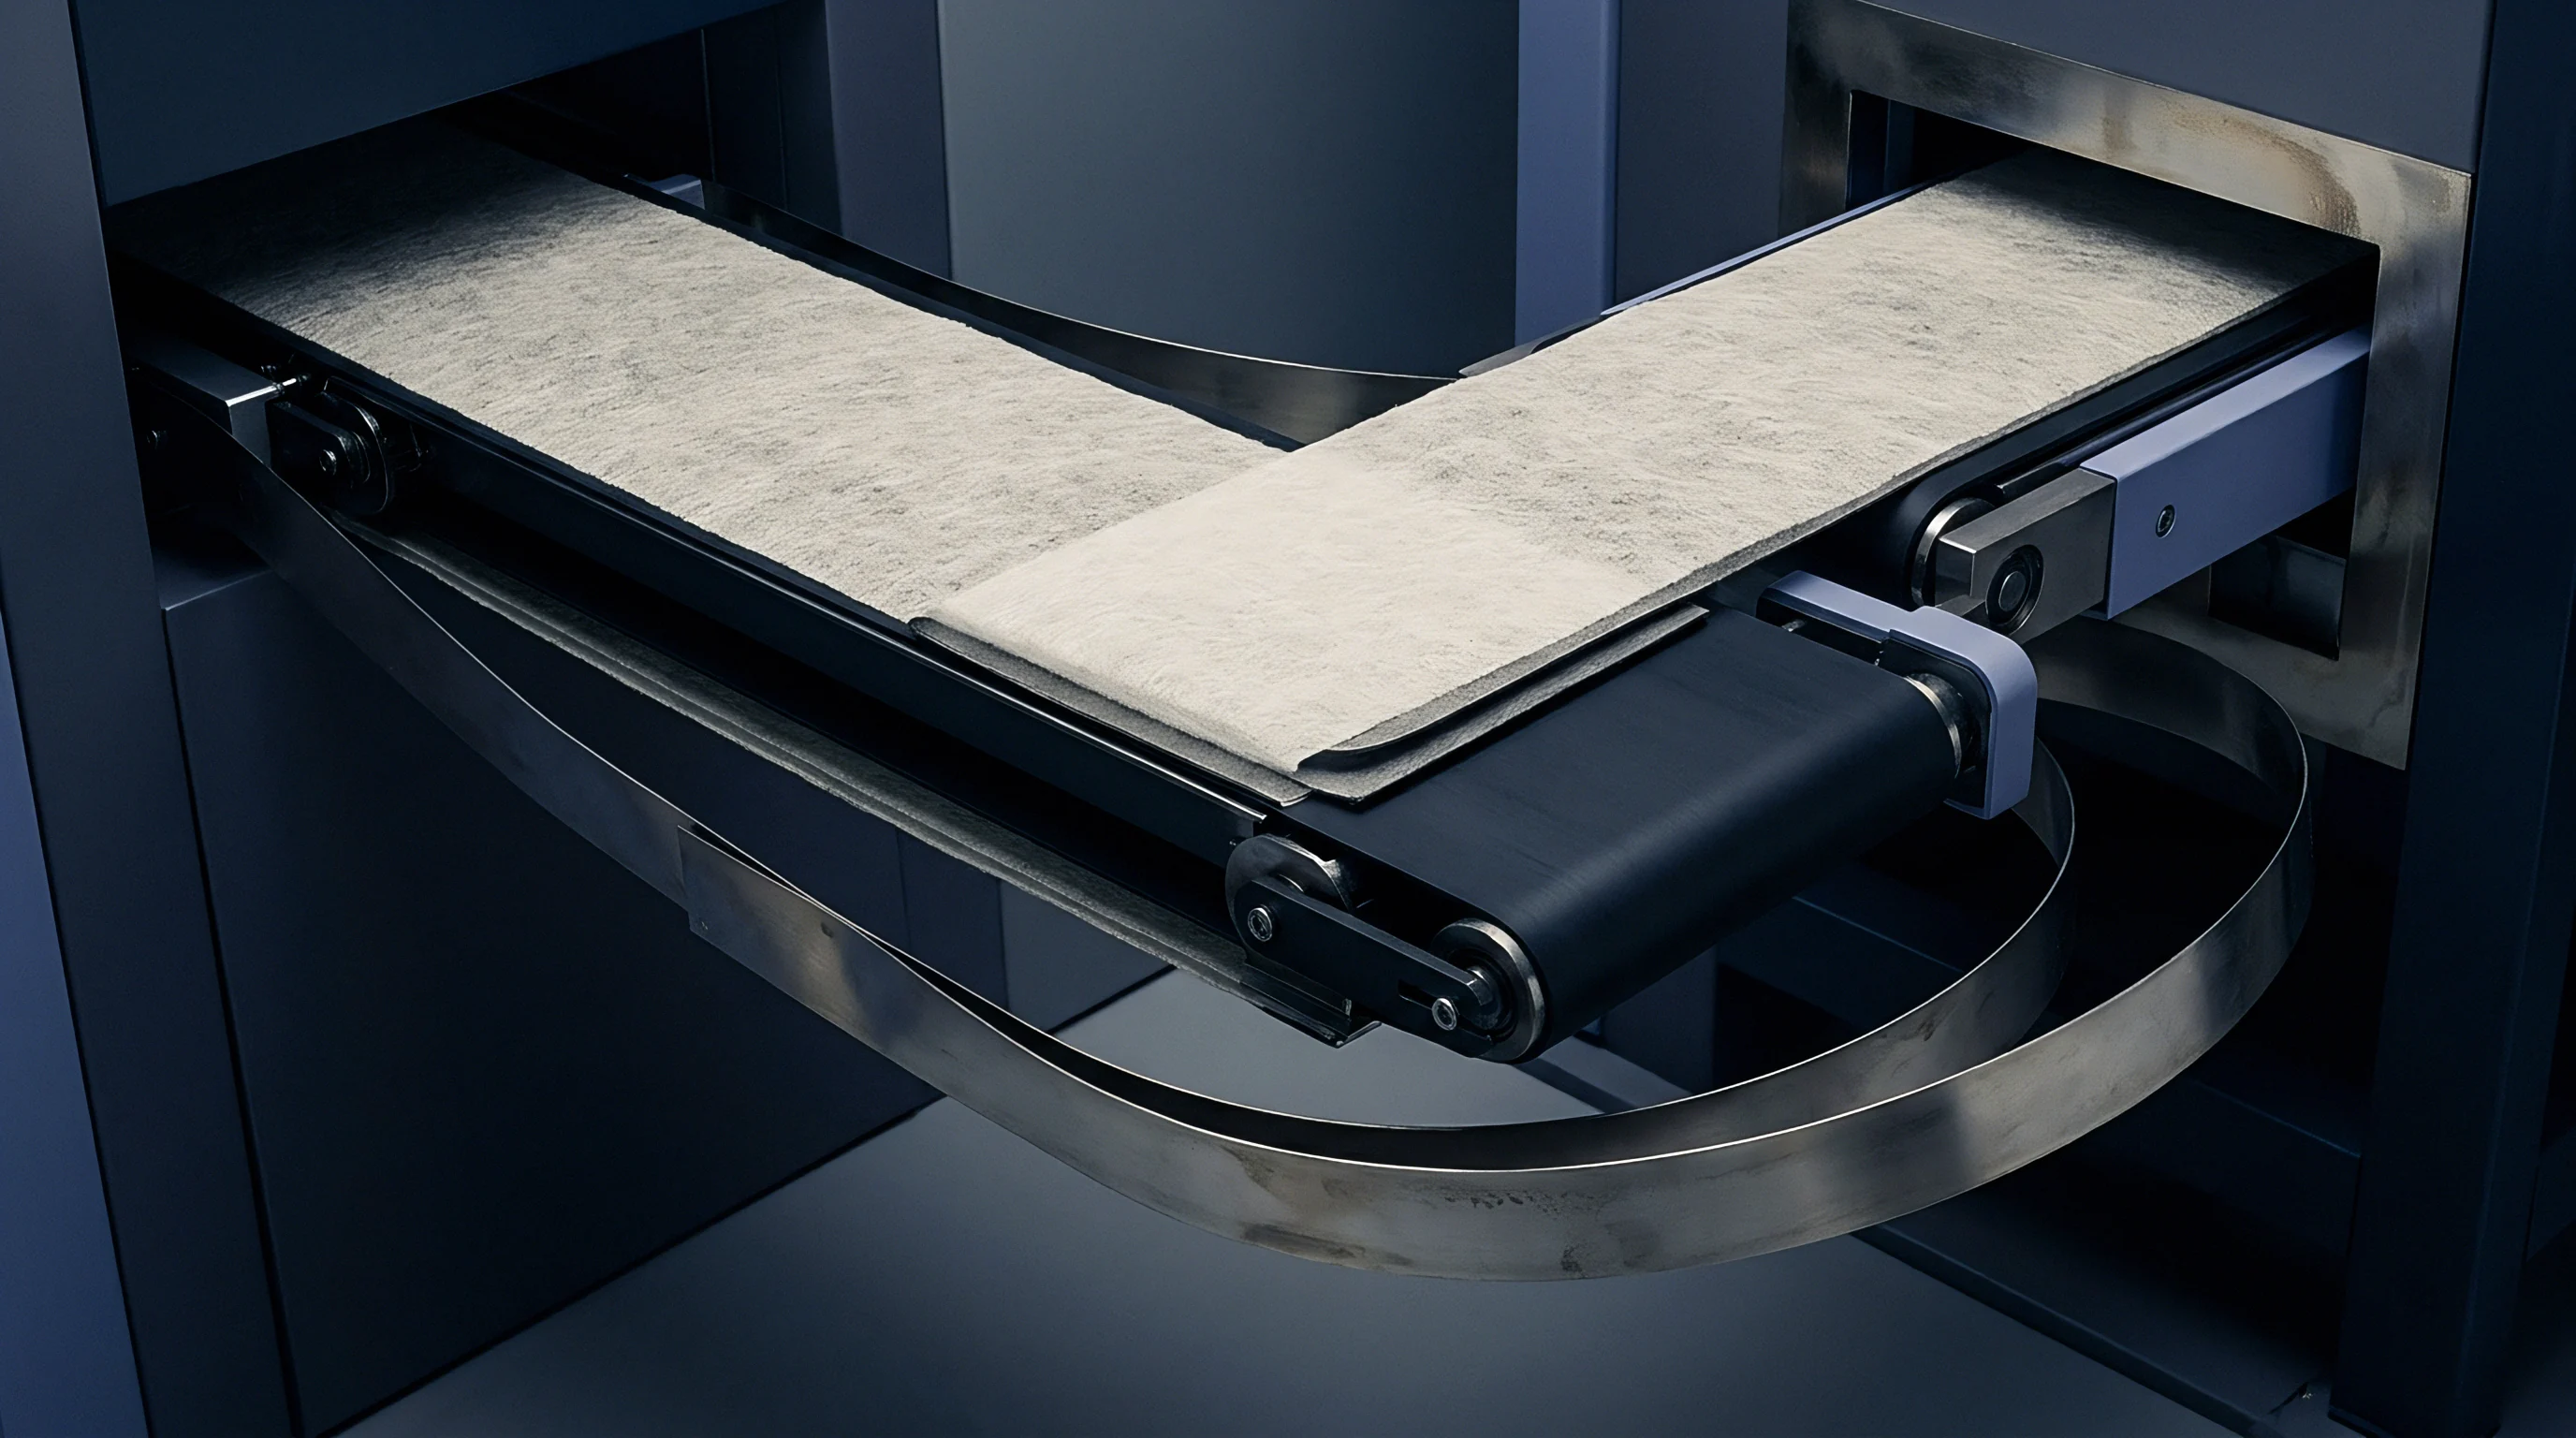
Commercial polyolefin separators are manufactured primarily through two industrial routes: the dry process, which uses melt-extrusion, annealing, and uniaxial or biaxial cold/hot stretching; and the wet process, which relies on thermally induced phase separation of ultra-high molecular weight polyethylene mixed with paraffin oil, followed by solvent extraction and stretching. Dry-process separators ~ typically single-layer polypropylene or trilayer polypropylene/polyethylene/polypropylene laminates ~ feature slit-like pores bounded by extended polymer lamellae. Wet-process membranes produce an isotropic, sponge-like network of interconnected elliptical pores.
Selecting between these manufacturing methods establishes the baseline for the cell format, dictating stack pressure limits, electrolyte filling speed, and separator breakdown thresholds during high-C-rate operation.
Structural Divergence in Wet and Dry Microstructures
Direct imaging with field-emission scanning electron microscopy reveals distinct differences in pore geometry. Dry-process membranes exhibit strongly anisotropic pore profiles, with transverse slit widths between 20 nm and 50 nm and machine-direction pore lengths extending from 100 nm to 250 nm. Fibrils align parallel to the draw axis, producing high machine-direction tensile strength but leaving the transverse direction susceptible to splitting under mechanical shear during winding or thermal stress.
Wet-process membranes display more symmetric pore geometries. Pore diameters follow a narrower Gaussian distribution centered between 35 nm and 65 nm, with aspect ratios close to unity. Because the fibril distribution is isotropic, mechanical compliance remains uniform across both machine and transverse axes.
Top-view imaging alone can be misleading; cross-sectional analysis is necessary to confirm whether surface pore metrics reflect internal bulk geometry. Solvent extraction or thermal calendering often induces asymmetric pore closure near the surface, forming dense skin layers that raise ionic impedance without improving puncture resistance.
| Manufacturing Process | Polymer Chemistry | Nominal Thickness (μm) | Mean Pore Diameter (nm) | Porosity (%) | Tensile Ratio (MD/TD) |
|---|---|---|---|---|---|
| Dry Uniaxial Stretch | PP Trilayer (PP/PE/PP) | 20.0 ± 1.0 | 45.0 ± 5.0 | 42.0 ± 2.5 | 8.5:1 |
| Dry Biaxial Stretch | PP Single Layer | 16.0 ± 0.8 | 55.0 ± 6.0 | 45.0 ± 3.0 | 2.2:1 |
| Wet Extraction Biaxial | UHMWPE Single Layer | 9.0 ± 0.5 | 38.0 ± 4.0 | 40.0 ± 2.0 | 1.2:1 |
| Wet Ceramic Coated | UHMWPE + Al2O3 Layer | 12.0 ± 0.6 (9+3) | 32.0 ± 3.5 | 38.0 ± 2.0 | 1.1:1 |
| Data measured at 25 °C. Tensile testing performed according to ASTM D882 at 50 mm/min crosshead speed. Porosimetry performed via capillary flow porosimetry using Galwick wetting fluid (surface tension 15.9 dyn/cm). | |||||
Electron Microscopy Preparation Artifacts
High-energy electron beams rapidly heat and radiolytically degrade polyethylene and polypropylene. Above accelerating voltages of 5 kV, uncoated polyolefin fibrils soften, swell, and melt within seconds under standard tungsten or field-emission sources. Cleanly imaging raw microstructures requires low acceleration voltages between 0.5 kV and 1.5 kV, alongside an ultra-thin sputter coating.
Magnetron-sputtered platinum, iridium, or chromium coatings form a conductive layer over polymer fibrils. Target thickness must remain between 1.5 nm and 3.0 nm; exceeding 5.0 nm occludes fine pores and reduces measured mean pore diameters by 10 nm to 15 nm. Cryogenic stages operating below minus 100 °C suppress beam heating, preserving fibrillar bridge structures at magnifications above 50,000 times.
Mechanical sectioning introduces compressive stresses that distort cross-sectional microstructures. Standard razor blades crush void space along the cut edge, leaving dense polymer smears that obscure internal pores. Freeze-fracturing samples in liquid nitrogen avoids this distortion by snapping the polymer in its glassy state, preserving the bulk architecture.
The nitrogen bath must remain dry and clean, as condensed ice crystals on fractured surfaces obscure pore boundaries under secondary electron detection.
Microstructural failure under mechanical strain develops through several recognized mechanisms during cell assembly and cycling:
- Fibril stress whitening occurs when localized mechanical tension exceeds the yielding threshold of individual polymer tie-molecules, causing micro-voiding and refractive index shifts before macro-tearing.
- Transverse splitting arises in uniaxially stretched dry separators due to weak inter-fibrillar cohesion under lateral shear forces imparted during high-speed winding.
- Pin-hole compression develops when hard active-material particles, such as secondary agglomerates of nickel-rich cathode material, press into the separator web under cell stack pressure, crushing local pore networks.
- Thermal shrinkage curling emerges when residual internal stresses from tenter-frame stretching release unevenly across film thickness, inducing localized warping and edge lifting.
Batch-to-batch variations in pore diameter stem from resin melt flow index drift alongside uneven heating profiles across the tenter frame stretch zone.
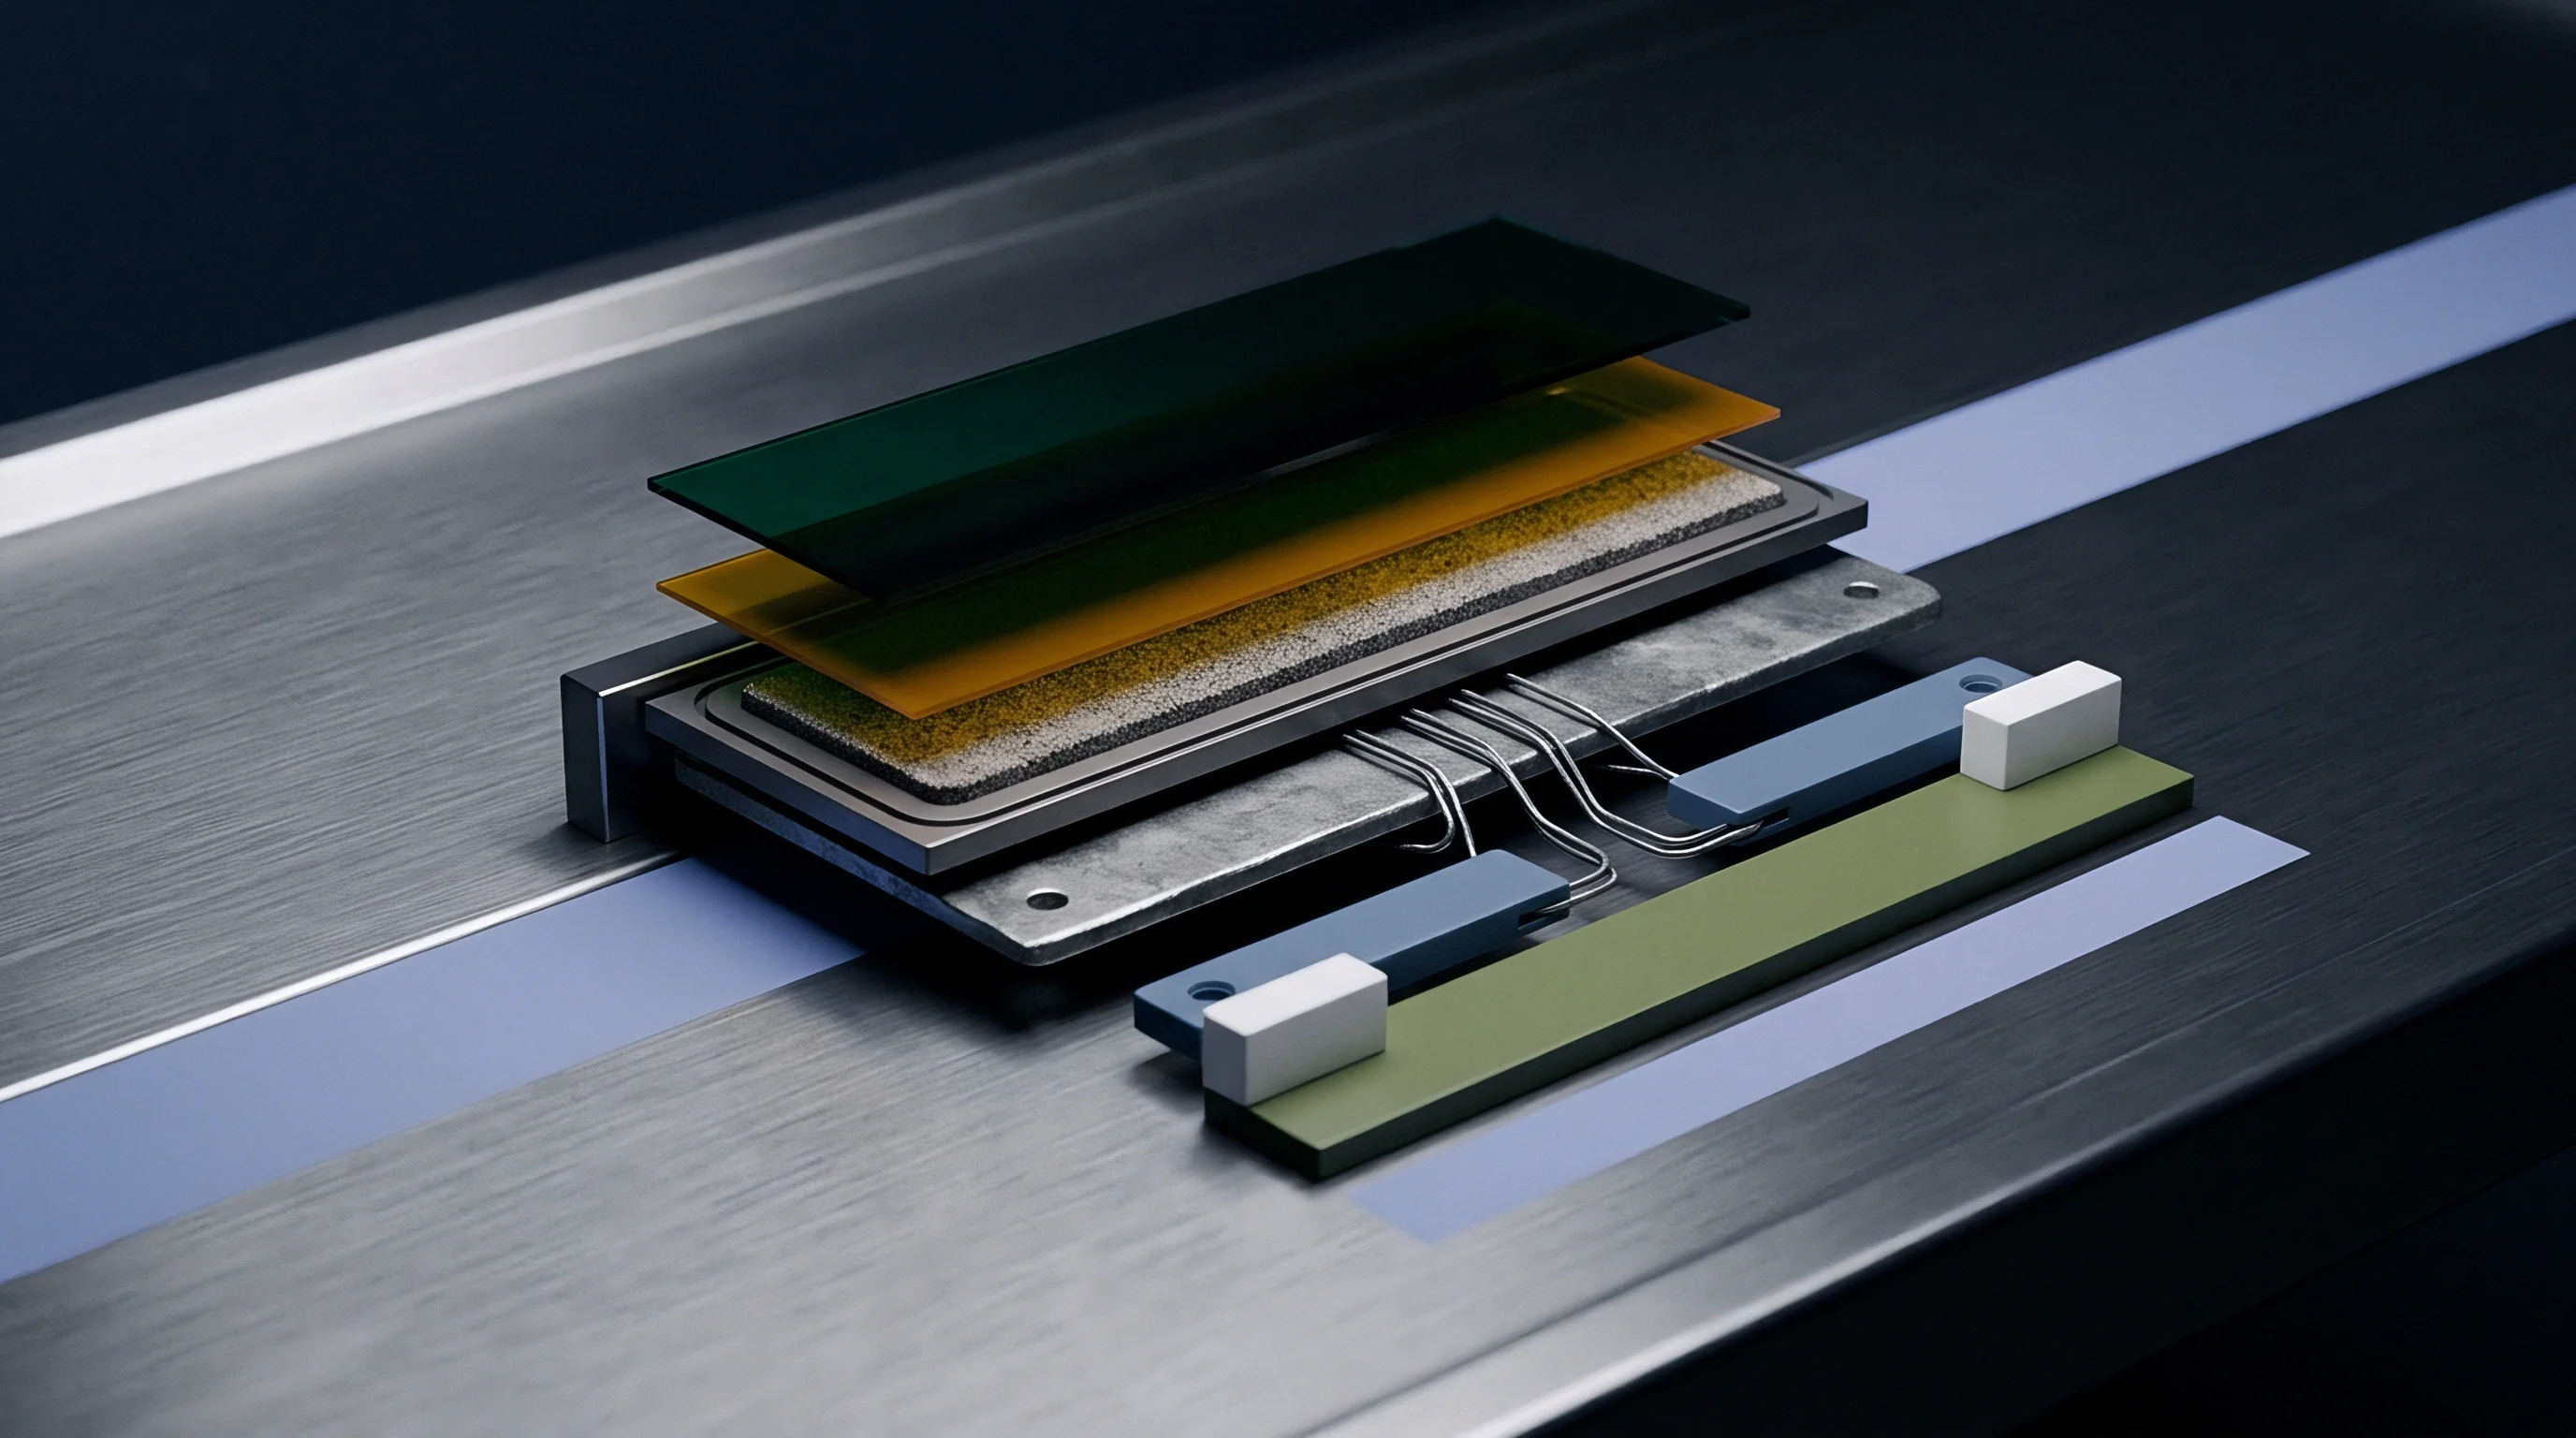
Permeability
Gas and liquid transport properties govern electrolyte wetting behavior and operational ionic impedance in finished battery cells. A separator with high bulk porosity can still underperform if internal pore bottlenecks or hydrophobic surface chemistry restrict fluid intake. Evaluating transport behavior fully requires combining gas-phase differential pressure measurements, liquid intrusion porosimetry, and electrochemical impedance spectroscopy.
The standard benchmark across manufacturing is the Gurley value, defined as the time in seconds for 100 cubic centimeters of air to pass through one square inch of membrane under 1.22 kilopascals of differential pressure. Gurley values serve as an effective, non-destructive quality check on production lines. However, the metric cannot isolate individual structural parameters: overall flow resistance conflates total porosity, pore size distribution, membrane thickness, and tortuosity into a single time value.
Hydrodynamic and Gas Phase Transport Metrology
Capillary flow porosimetry captures pore size distributions without subjecting polyolefin films to heavy compressive loads. The method measures the gas pressure required to displace an inert wetting liquid, such as a fluorinated hydrocarbon, from the pore matrix. Differential gas pressure is converted directly into pore throat diameter using the Washburn equation.
The largest continuous pathway ~ the bubble point ~ defines the threshold pressure needed to evacuate fluid from the widest channel. As applied pressure increases, gas flow through the wetted sample rises until all pores are cleared and the curve matches dry-sample flow. Capillary flow porosimetry measures the narrowest constriction along each through-thickness path, known as the pore throat diameter.
Blind or dead-end pores do not register, because gas flow requires a continuous opening across the film.
Mercury intrusion porosimetry uses hydraulic pressure to drive mercury into non-wetting polymer pores, with pressures up to 400 megapascals forcing fluid into pores down to 3 nanometers in diameter. However, these pressures cause elastic and plastic deformation in soft polyolefin matrices. As a result, mercury intrusion often overestimates sub-20-nanometer pore volume because cell walls collapse before mercury enters, skewing the reported distribution.
| Characterization Method | Primary Measured Metric | Pore Size Range (nm) | Applied Pressure Range | Deformation Risk |
|---|---|---|---|---|
| Gurley Air Permeability | Air Flow Resistance Time (s/100 cm³) | Bulk Effective Path | 1.22 kPa (Fixed) | Negligible |
| Capillary Flow Porosimetry | Bubble Point & Throat Diameter | 10 to 1,000 | 0.01 to 0.7 MPa | Low |
| Mercury Intrusion Porosimetry | Total Void Volume & Pore Distribution | 3 to 360,000 | 0.1 to 400 MPa | High (Polymer Compaction) |
| Liquid Extrusion Porosimetry | Through-Pore Size Distribution | 50 to 10,000 | 0.001 to 0.3 MPa | Negligible |
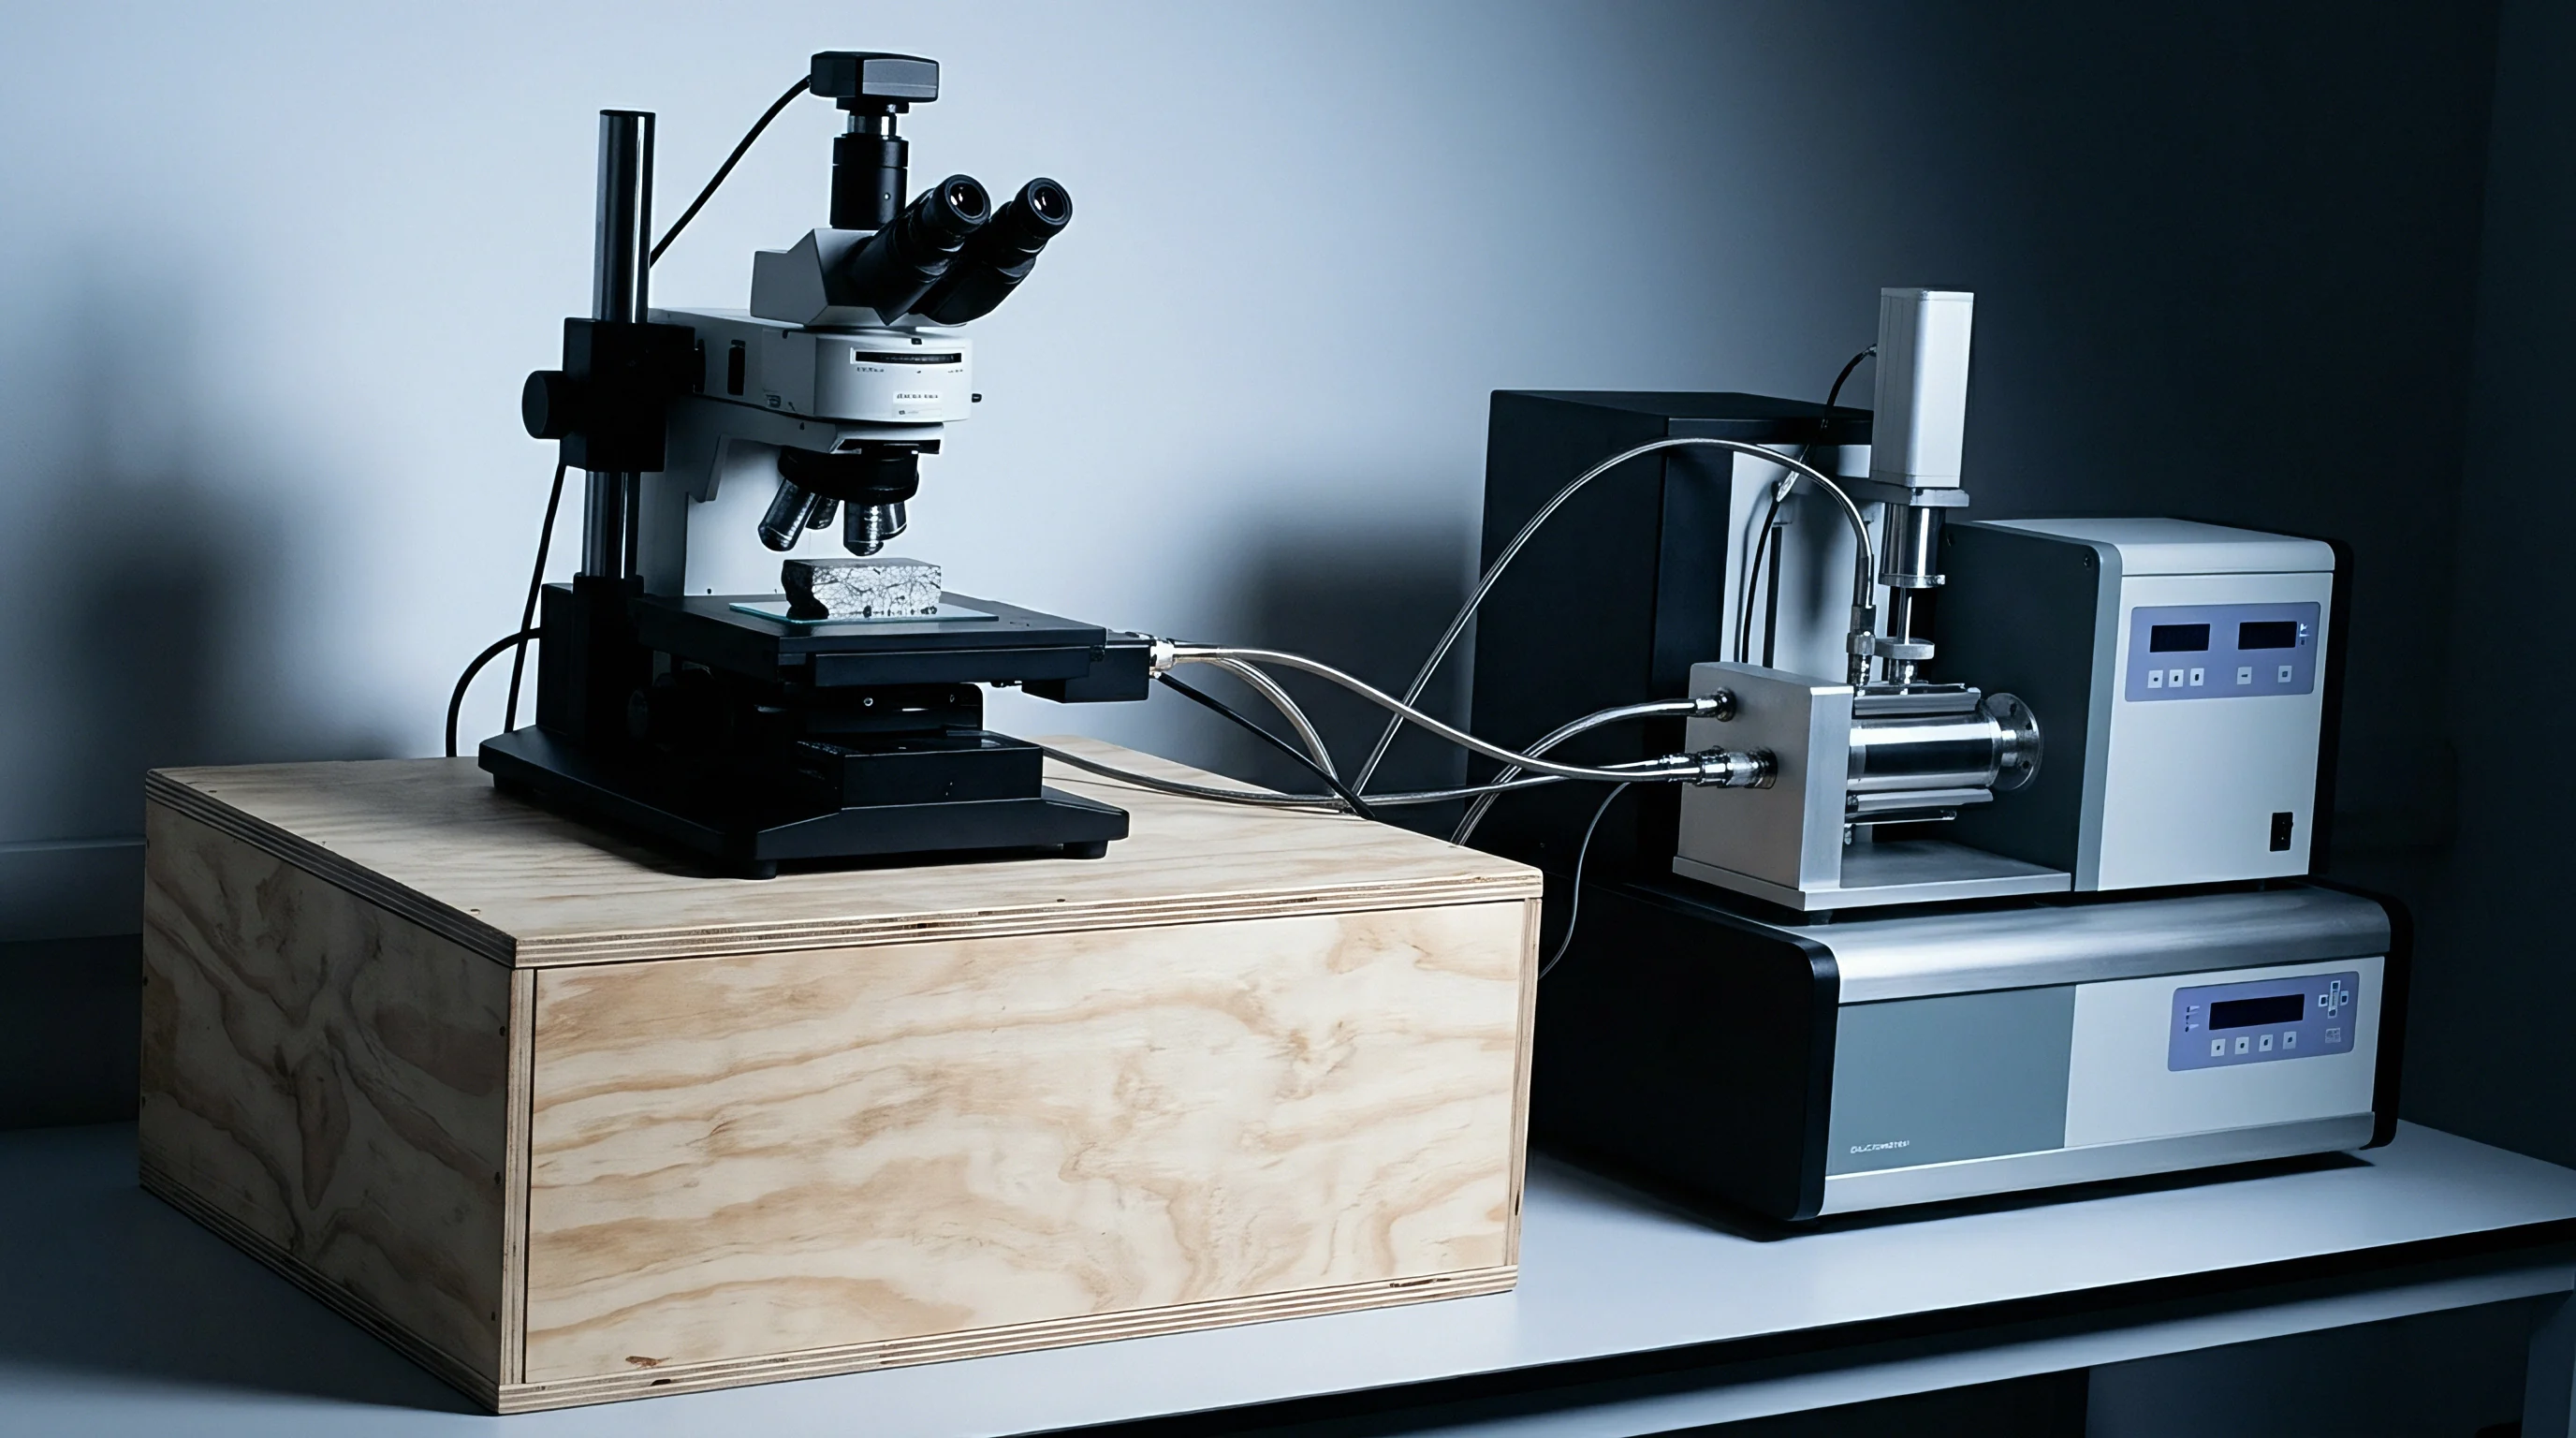
Ionic Resistance and MacMullin Number Determination
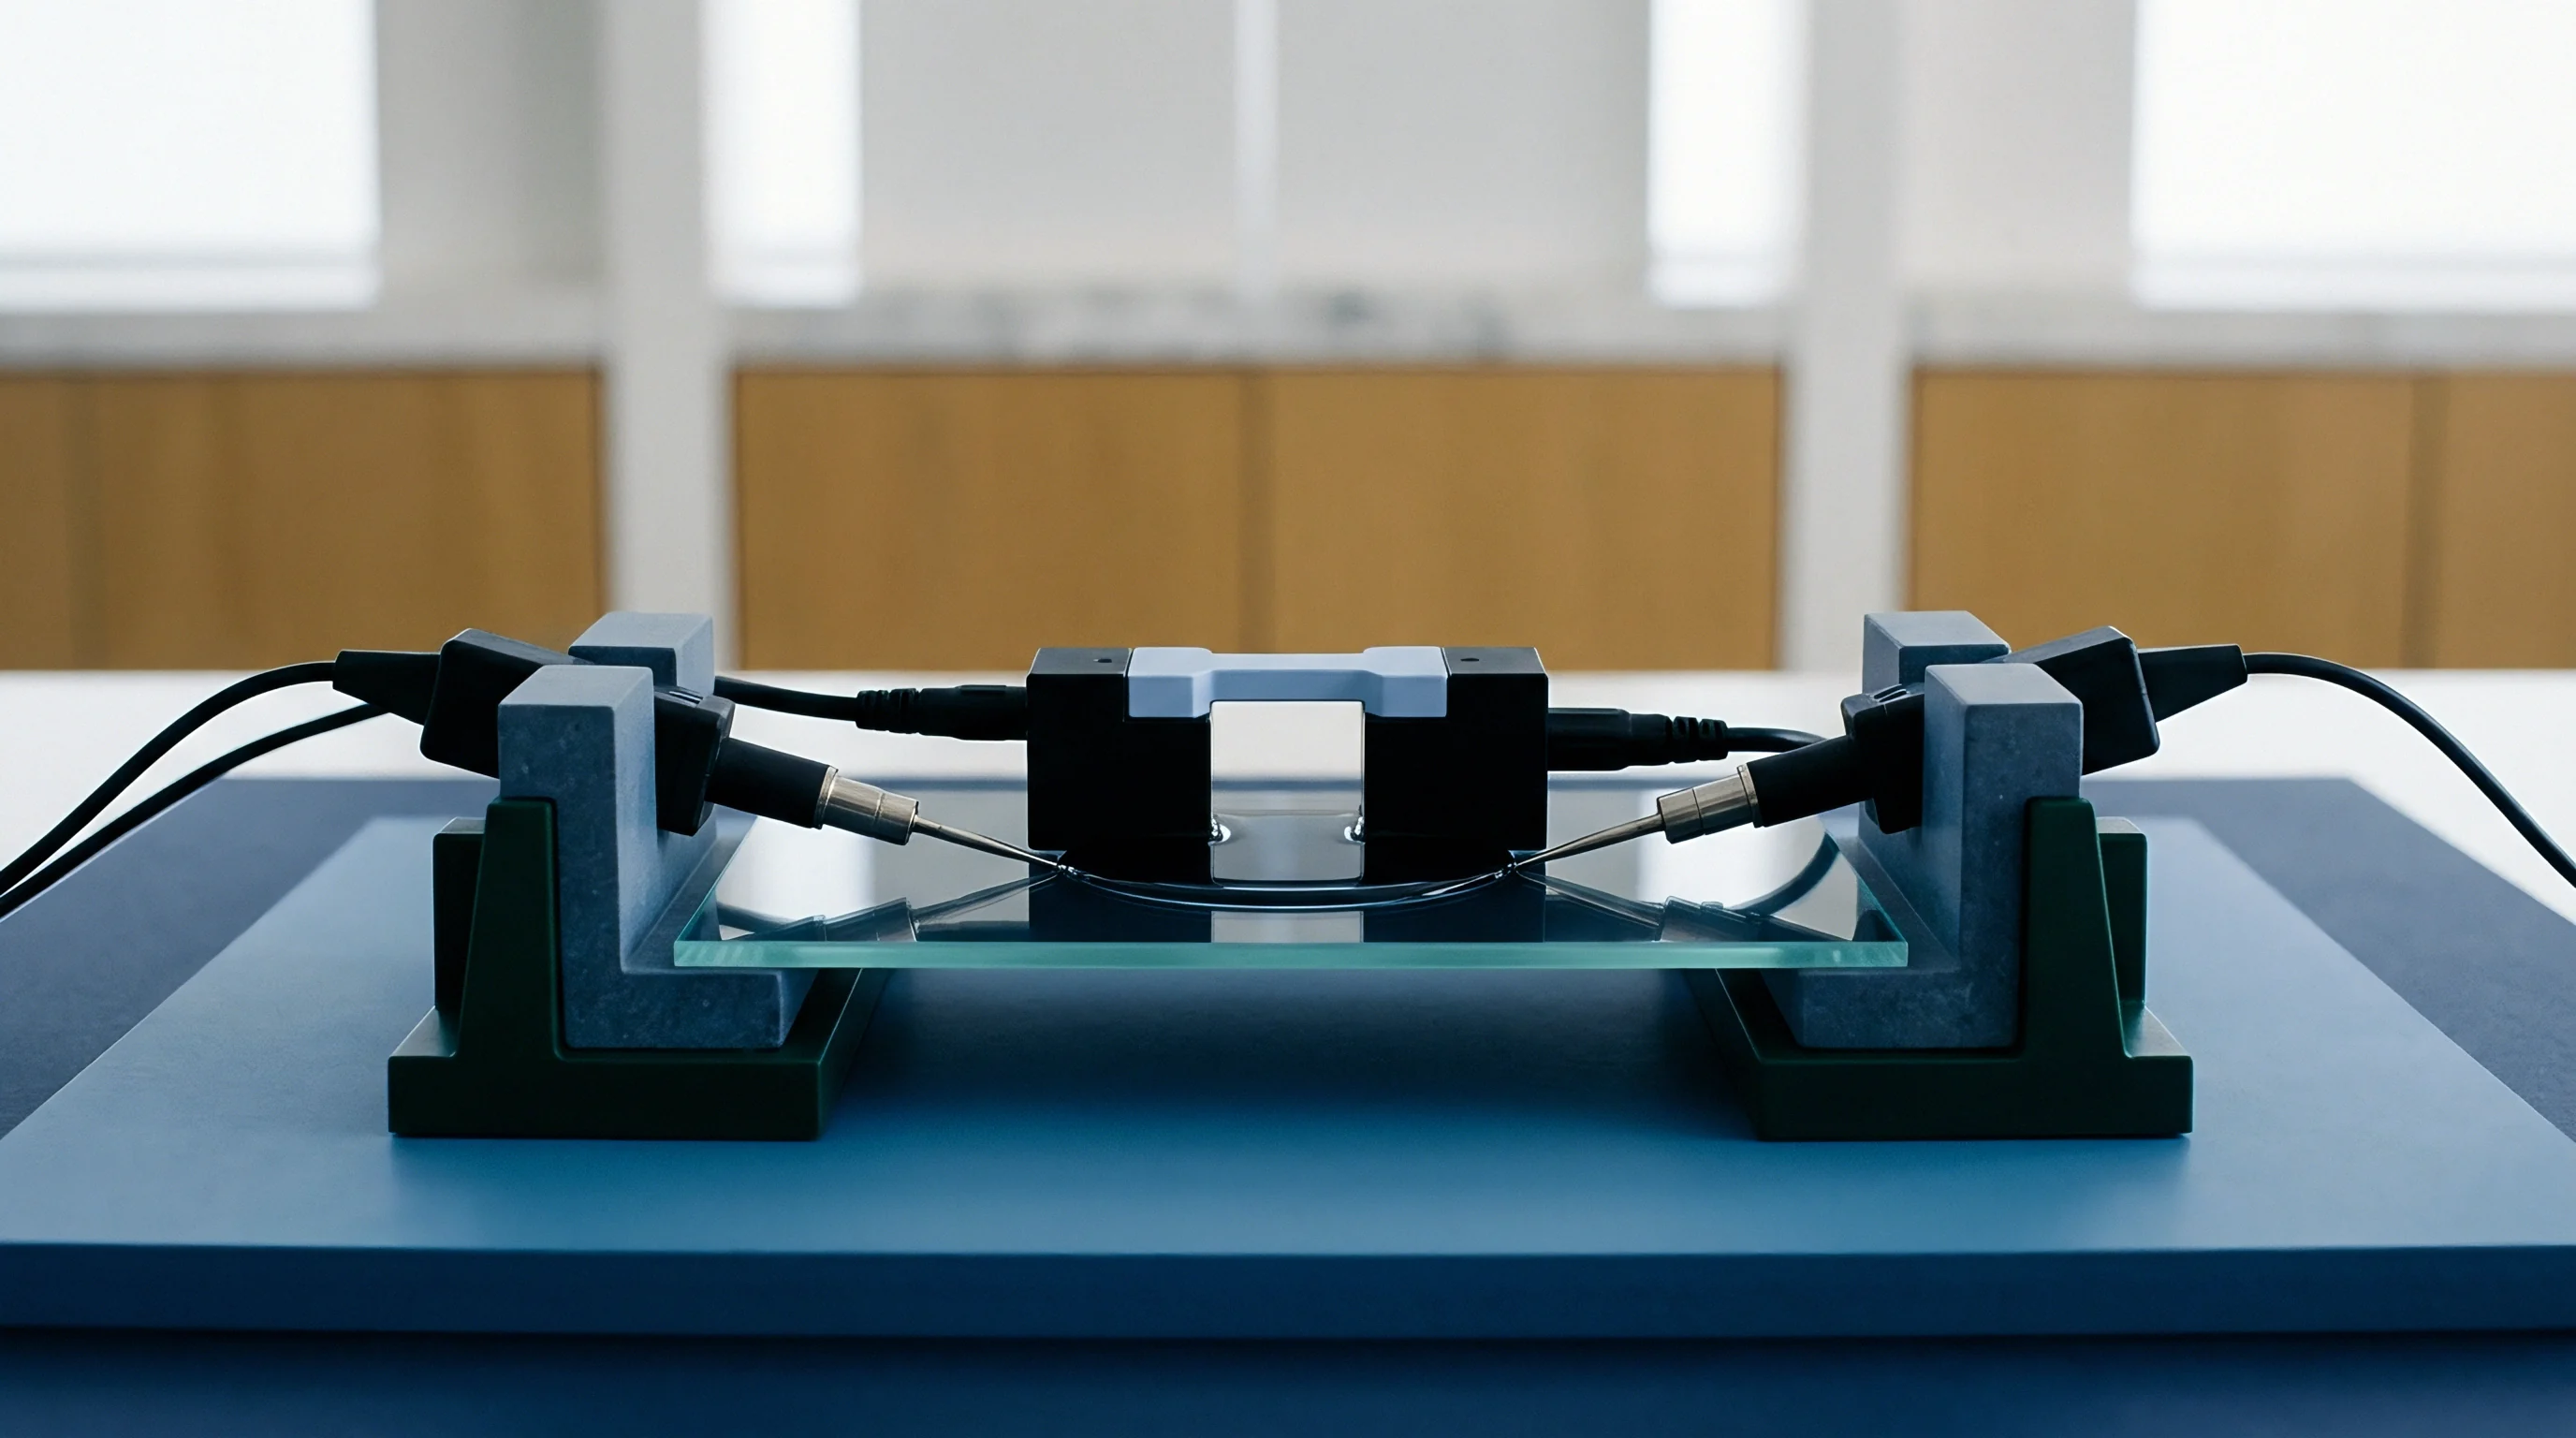
Ionic transport through electrolyte-soaked separators sets rate capability and low-temperature performance limits. Electrochemical impedance spectroscopy measures separator resistance by clamping electrolyte-saturated membranes between polished platinum or stainless steel electrodes in a temperature-controlled cell. High-frequency intercept values on Nyquist plots provide the net ohmic resistance of the soaked membrane assembly.
Analyzing raw resistance data without correcting for test cell geometry introduces substantial error. Subtracting the baseline resistance of the bulk electrolyte yields the true area specific resistance of the membrane, expressed in ohms times square centimeters. The MacMullin number represents the ratio of effective electrolyte resistivity within the separator matrix to bulk electrolyte resistivity.
This dimensionless parameter accounts for porosity and tortuosity, simplifying to tortuosity squared divided by porosity.
High-rate automotive separators generally exhibit MacMullin numbers between 6.0 and 12.0. Values above 15.0 indicate excessive path tortuosity or narrow pore throats, driving up overpotential during fast-charge pulses. Tight temperature regulation during testing is essential, as liquid electrolyte conductivity shifts by approximately 2 percent per degree Celsius around ambient temperatures.
At 25 °C, a 16-micrometer wet-process separator soaked in standard 1.0 M LiPF6 EC:EMC electrolyte that yields an area specific resistance above 1.5 Ω·cm² points to severe pore throat constriction or incomplete wetting.
Thorough separator evaluation involves systematic validation across multiple measurement protocols:
- Dry sample thickness mapping across five spatial points using a low-force digital micrometer rated at 0.5 kilopascals contact pressure.
- Gurley air permeability acquisition using a calibrated density cylinder at 1.22 kilopascals differential pressure.
- Capillary flow porosimetry step-up pressure scans using low surface tension wetting liquid to define bubble point and mean flow pore size.
- Electrochemical impedance spectroscopy inside a sealed symmetric cell across a frequency spectrum from 1 MHz to 100 Hz.
- MacMullin number derivation by dividing electrolyte-soaked membrane resistivity by bare electrolyte resistivity measured in an identical geometry.
Gurley value variations across master rolls trigger localized current density spikes during rapid charging, accelerating lithium plating at the anode interface.
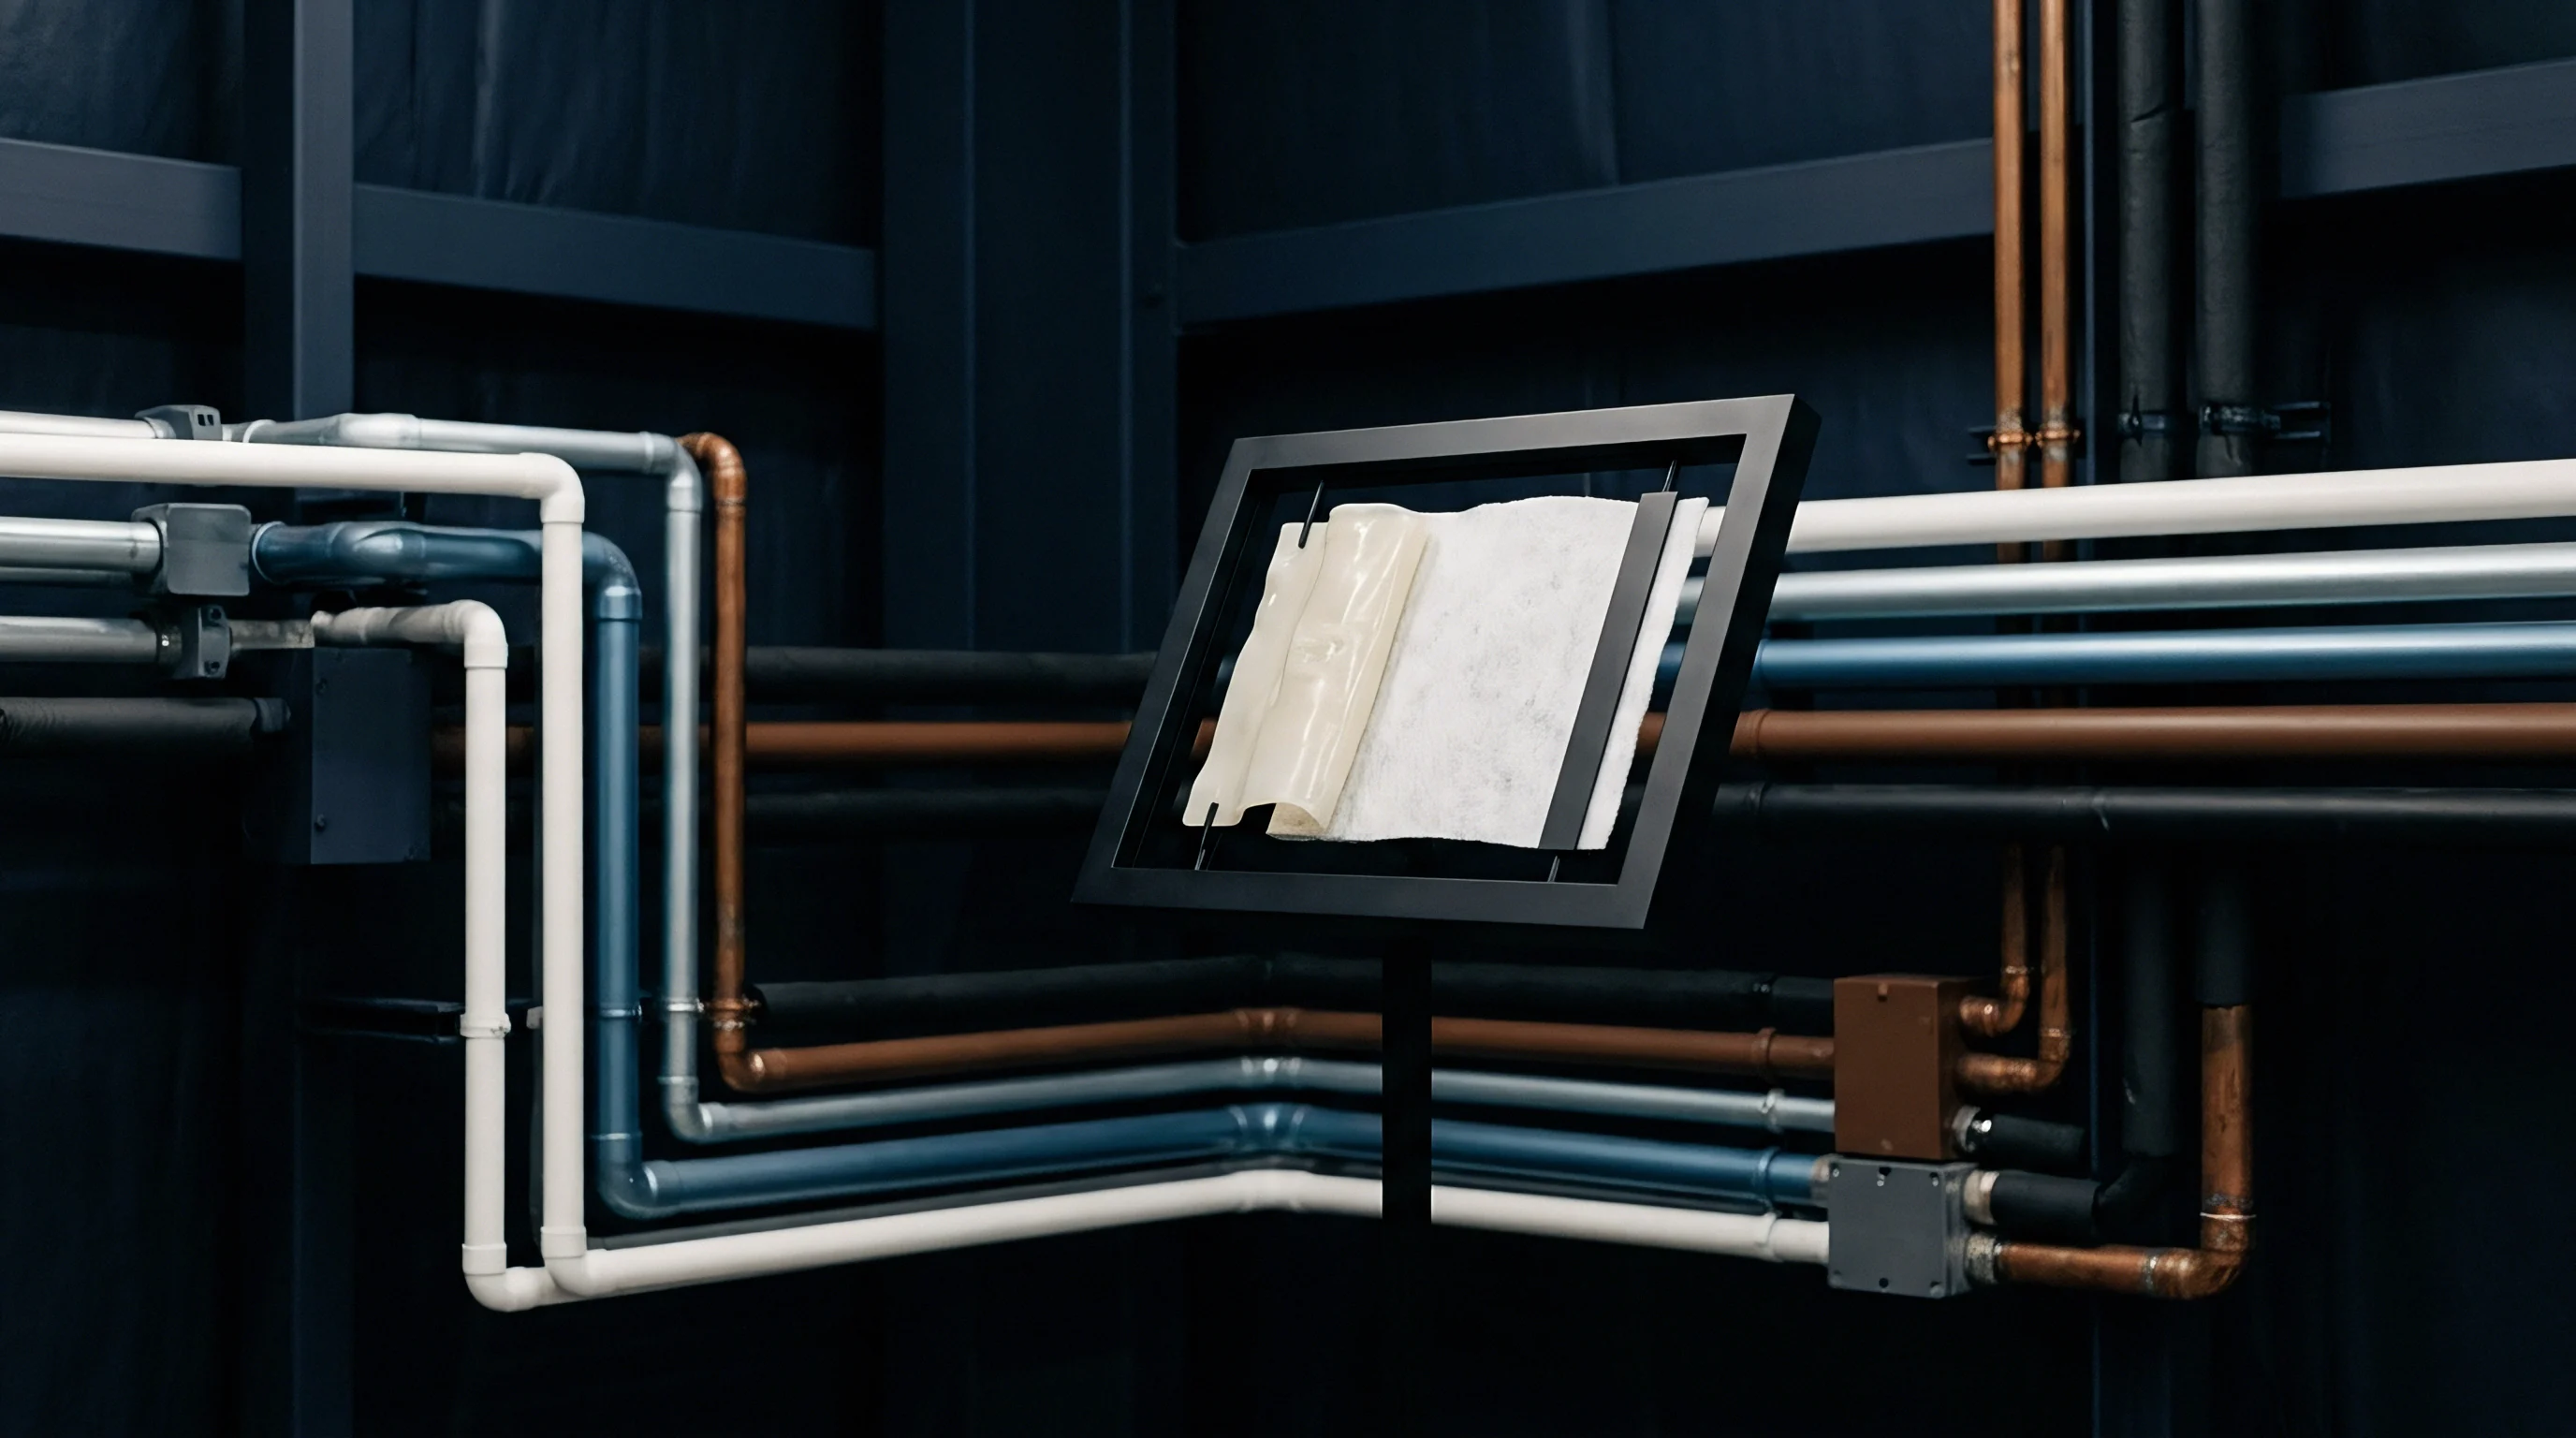

Probe
Scanning probe techniques and high-resolution ion beam milling allow targeted physical evaluation of separator microstructures down to the nanometer scale. Standard optical and bulk physical measurements average properties over square centimeters, masking localized mechanical weak spots, surface skins, and pinholes that can trigger short circuits. Advanced atomic force microscopy and cryo-focused ion beam milling isolate these micro-scale variations under simulated operating conditions.
Peak Force Quantitative Nanomechanical Mapping measures elastic modulus, adhesion, and dissipation energy alongside surface topography. Operating atomic force microscopy probes in resonant tapping mode avoids tip drag artifacts across soft polyethylene fibrils. Diamond-coated or solid silicon nitride cantilevers with spring constants between 5 and 40 newtons per meter permit quantitative indentation into the polymer, resolving local modulus differences between amorphous and crystalline domains.

Which Nanomechanical Method Resolves Sub-Micron Defect Clusters?
Atomic force microscopy maps show sharp stiffness gradients between crystalline lamellae and amorphous tie-chain regions. Crystalline areas display elastic moduli between 1.5 and 3.0 gigapascals, while amorphous void edges drop below 0.4 gigapascals. Mapping local modulus shifts along transverse stress lines reveals early mechanical degradation well before macroscopic cracks form.
Conductive atomic force microscopy with an applied bias voltage exposes sub-surface insulating flaws and micro-pinholes. A conductive diamond-coated tip scans the surface under non-solvent dielectric fluid or high vacuum. Localized current leakage spikes pinpoint sub-micron dielectric breakdown spots where film thickness was pinched during rolling or slitting.

Focused Ion Beam Sectioning Protocols
Cross-sectional imaging of porous polyolefins using focused ion beams carries real risks of sample distortion. Heavy gallium ions accelerated at 30 kilovolts generate enough heat to melt low-density polyethylene, leaving glass-like artifacts across sectioned faces. Preventing this damage requires cryogenic sample stages held below minus 140 °C throughout milling and imaging.
Cryogenic focused ion beam sample preparation follows strict operational sequences to guarantee artifact-free cross-sections:
- Submerge membrane sample in liquid nitrogen slush to achieve rapid vitreous cooling without surface frost deposition.
- Transfer sample under high vacuum to the cryo-FIB-SEM chamber, maintaining stage temperature below minus 140 °C.
- Deposit a protective sacrificial metal layer, comprising organometallic platinum or tungsten, using low-beam-current electron deposition to avoid polymer ion-etching during initial deposition.
- Rough mill the cross-sectional trench using a high ion beam current of 1.0 to 3.0 nanoamperes at 30 kilovolts.
- Polish the target surface using low ion beam currents between 50 and 100 picoamperes at 30 kilovolts to eliminate curtaining artifacts.
- Image polished face using secondary and backscattered electron detectors operating at accelerating voltages under 1.0 kilovolt.
ISO 21845 compliance requires that cross-sectional shrinkage measurements under cryogenic electron beam imaging remain below 2 percent of total web thickness to prevent structural distortion artifacts.
Cross-sectional cryo-FIB-SEM imaging highlights structural gradients between the outer surface and internal bulk core. Wet-process membranes frequently form dense surface skins 50 nm to 150 nm thick during the rapid cooling phase of phase separation. These skins alter local electrolyte uptake kinetics and raise high-frequency interfacial impedance without improving needle penetration puncture strength.
Whether sub-surface fibril buckling under 1.5 MPa stack pressure can be non-destructively isolated prior to long-term cycling remains an open empirical challenge.
Calorimetry
Thermal stability testing defines operational limits for separators under heat abuse, overcharge, and internal short-circuit conditions. Elevated temperatures drive distinct structural transitions in polyolefin films: elastic relaxation, crystalline melting, shrinkage, and eventual structural collapse. Thermal analysis quantifies enthalpy changes, weight loss stages, and dimensional shifts across varying heating rates and atmospheres.
Differential Scanning Calorimetry tracks phase transitions by measuring differential heat flow between a sample pan holding separator film and an empty reference pan. Polyethylene melts between 130 °C and 138 °C, showing a sharp endothermic peak from 180 to 220 joules per gram depending on crystallinity. Polypropylene melts higher, between 160 °C and 168 °C, with a heat of fusion around 90 to 110 joules per gram.
Co-extruded or laminated trilayer PP/PE/PP separators show two distinct endothermic DSC peaks. The lower polyethylene peak corresponds to thermal shutdown: molten polyethylene flows into adjacent pores and blocks ionic current, while the outer polypropylene layers preserve physical separation between electrodes.
Thermal Phase Transitions and Shutdown Kinetics
Evaluating shutdown dynamics means pairing thermal calorimetric traces with impedance measurements as temperature rises. As polyethylene melts, its volume expands by roughly 10 percent before flowing into void channels. Impedance jumps by three to four orders of magnitude within a narrow 3 °C to 5 °C window around 135 °C.
Impedance response depends heavily on heating rate. Localized nail penetration and other severe abuse scenarios drive heating rates past 100 °C per second. Slow furnace tests at 2 °C per minute give polymer chains time to relax and fill pores cleanly, whereas rapid thermal pulses expand and deform the web before pore sealing finishes.
Reliable cell safety margins require correlating static DSC melting points with dynamic impedance shutdown curves.
Dynamic mechanical analysis in food packaging film extrusion shows how orienting polymer crystallites raises heat distortion temperatures ~ a concept brought directly to battery separator tenter frames to prevent early transverse creep under cell stack pressure.
Thermomechanical Strain and Shrinkage Analysis
Thermomechanical Analysis measures linear dimensional changes in separator films under light tensile loads as temperature climbs. Samples are mounted in quartz tension fixtures under 0.005 to 0.05 newtons of force to keep the film taut without stretching it. High-performance separators show minimal thermal shrinkage up to 100 °C, keeping dimensional shifts below 2.0 percent along both machine and transverse axes.
Above 120 °C, internal stress locked into amorphous regions during stretching releases rapidly. Uniaxially stretched dry separators contract sharply along the machine direction ~ exceeding 30 percent shrinkage at 140 °C ~ while transverse dimensions buckle or expand slightly. Isotropic wet-process films shrink evenly along both axes, typically staying under 15 percent at 130 °C. Excessive shrinkage exposes electrode edges, leading to direct contact between anode and cathode active materials along the cell border.
Thermal shrinkage exceeding 5 percent at 120 °C along either principal direction correlates with increased field failure rates during prolonged thermal storage qualification tests.
Thermogravimetric Analysis quantifies ceramic and inorganic coating content on functionalized separators. These coatings use sub-micron alumina, boehmite, or silica particles bound to the polyolefin surface with PVDF or acrylic binders. Heating samples in air or oxygen to 800 °C burns off all organic components, leaving only the inorganic residue.
High-precision TGA balances resolve ceramic mass loading down to 0.1 grams per square meter, confirming coat-weight uniformity across wide webs.
High thermal shrinkage in the transverse direction consistently predicts edge-folding defects during automated cell stacking.
Tomography
Three-dimensional non-destructive characterization reveals bulk tortuosity, pore connectivity, and localized density variations inside intact separator sheets. Two-dimensional imaging relies on cross-sectional cuts or surface assumptions that ignore path continuity through the thickness axis. Computed tomography captures entire structural volumes, enabling direct numerical simulation of fluid flow and ionic movement within digital twin models of the separator microstructure.
X-ray micro-computed tomography resolves features down to one micrometer, useful for checking macro-defects, coating thickness variation, and internal alignment in pouch or prismatic cells. Resolving sub-100-nanometer pore structures takes synchrotron phase-contrast nano-CT or focused ion beam nanotomography. High-flux monochromatic X-ray beams from synchrotron sources exploit phase contrast between low-density polymer and void space, resolving features down to 30 nanometers without damaging sensitive samples.
Three Dimensional Structural Reconstruction and Volume Sampling
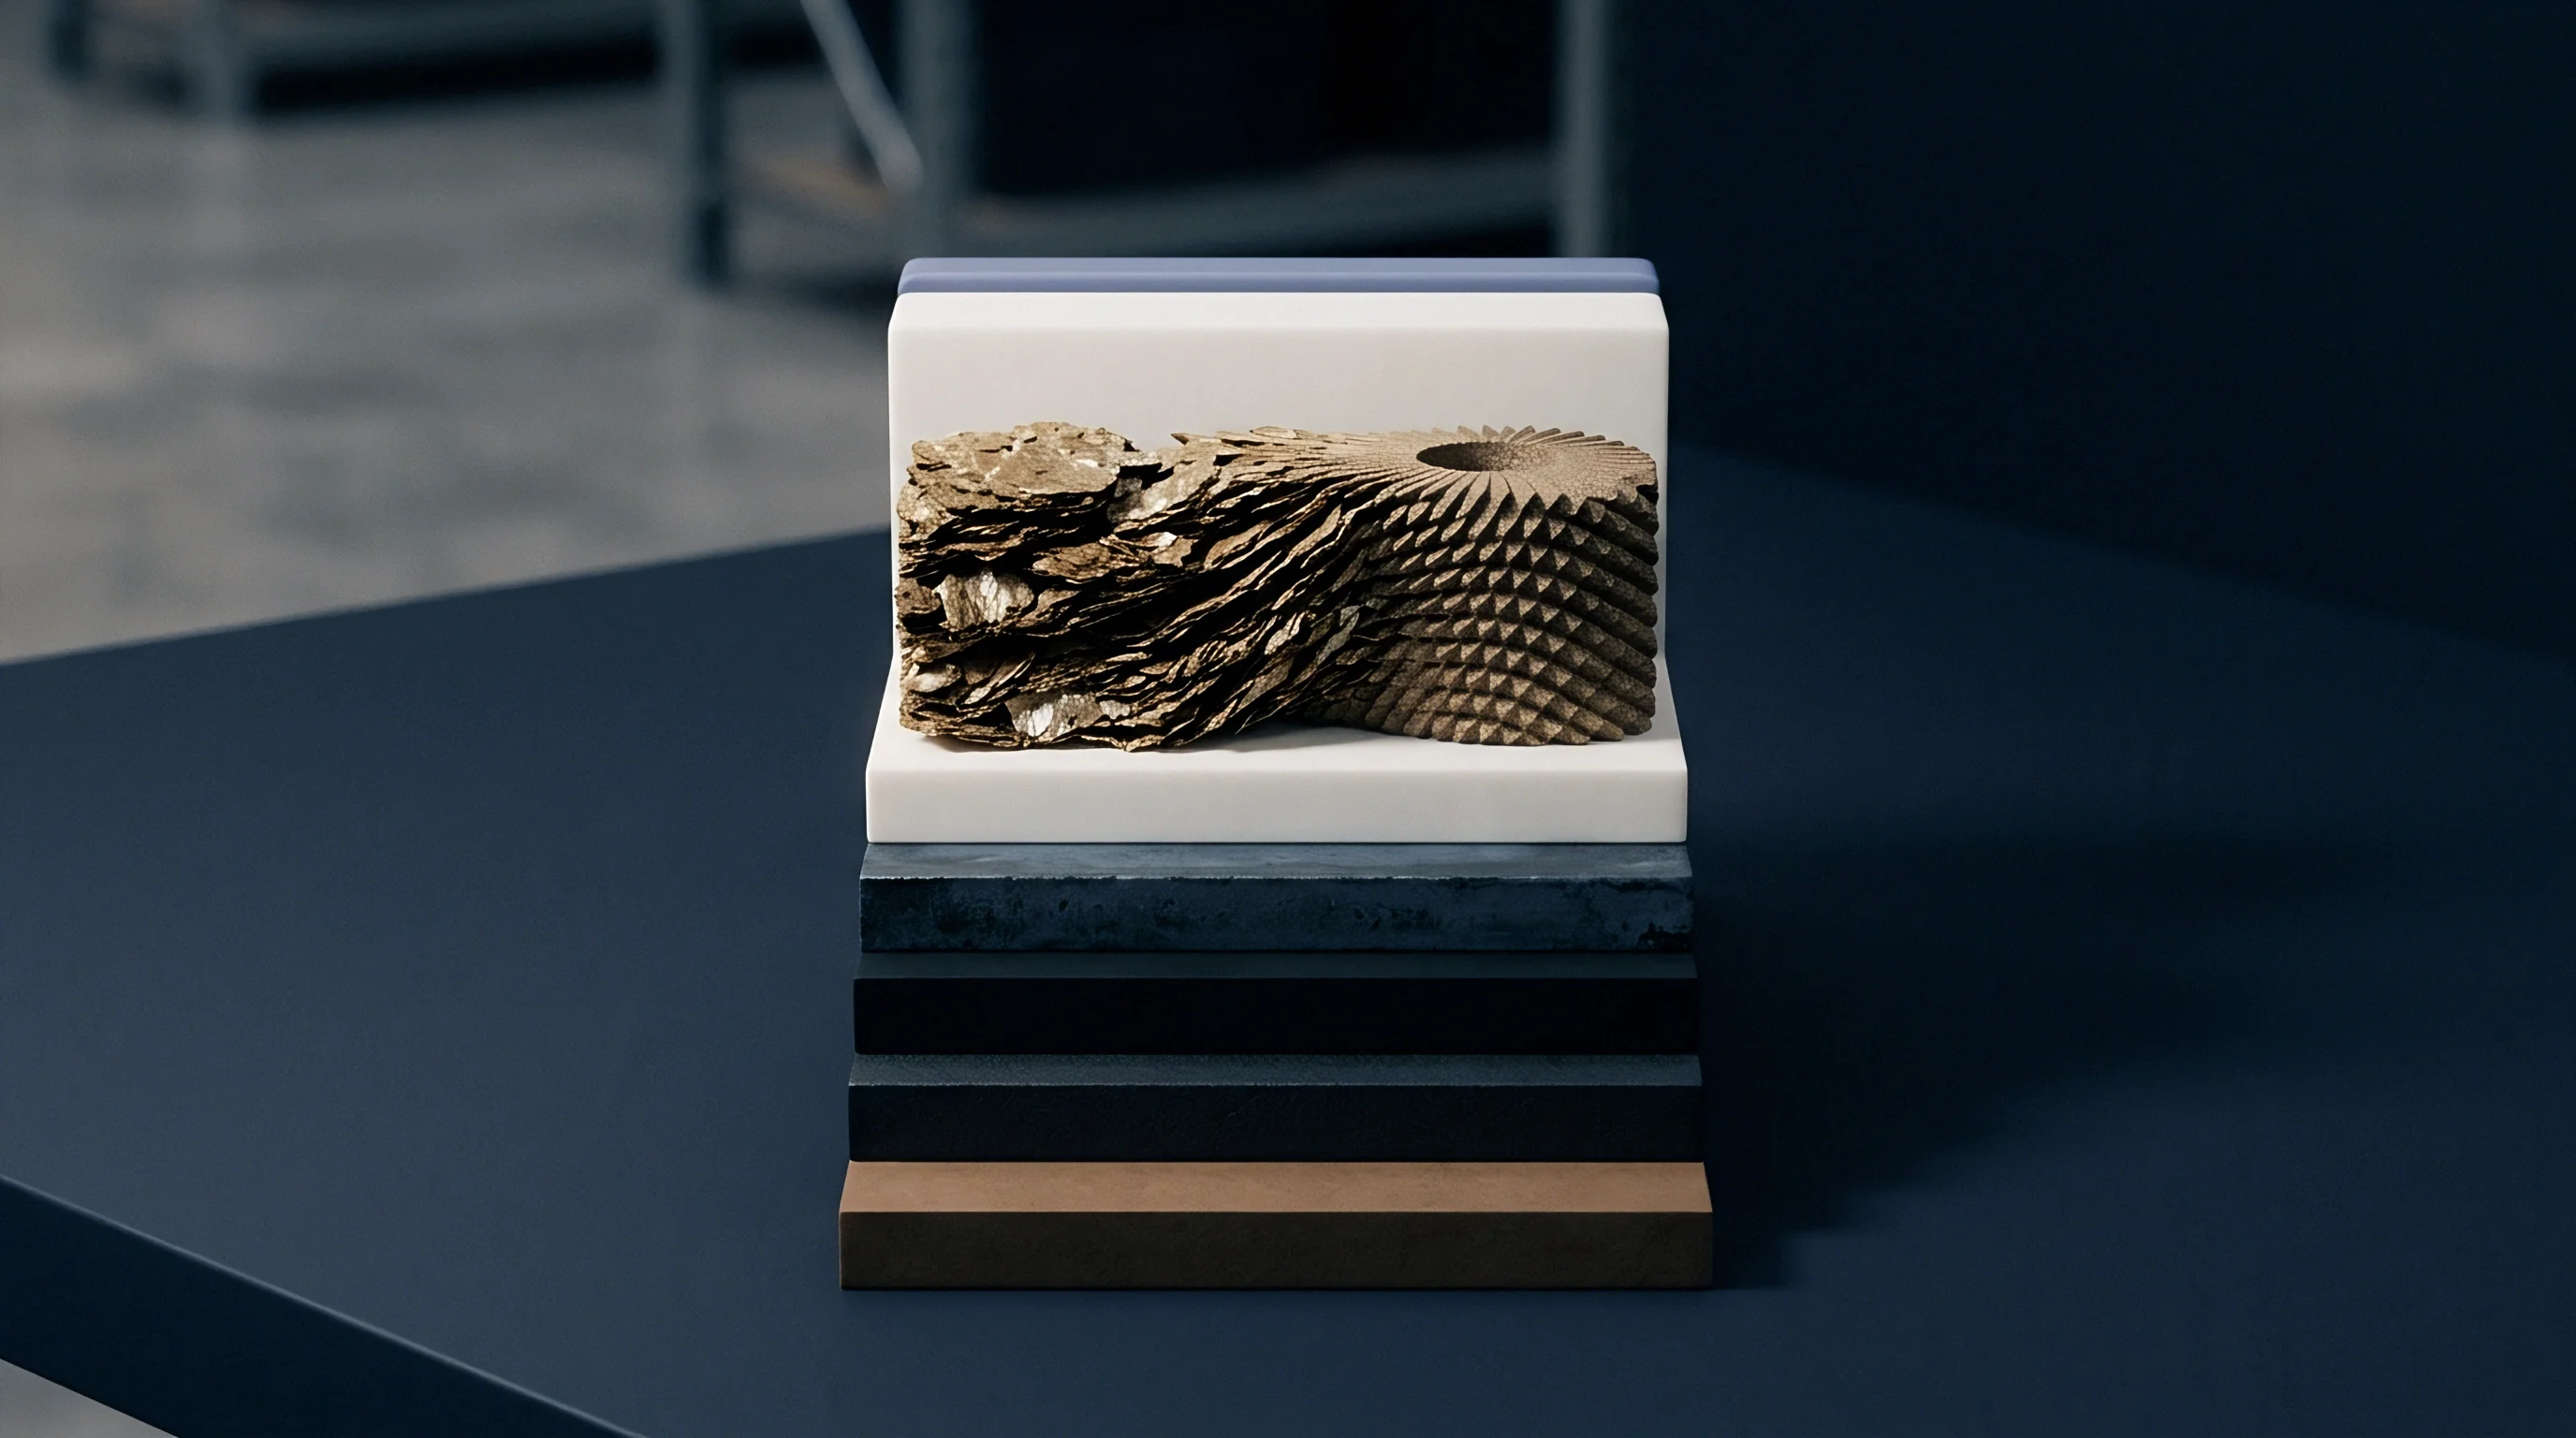
Focused ion beam nanotomography builds high-resolution 3D volumes by sequentially milling thin polymer slices and imaging each exposed face with secondary electron microscopy. Slice thickness needs to match lateral pixel resolution, typically 5 to 15 nanometers per voxel. Getting reliable contrast between polymer fibrils and filled voids requires infiltrating porous separators with low-viscosity epoxy containing heavy-metal contrast agents before FIB sectioning.
Selecting an appropriate Representative Elementary Volume determines data validity. Volumes that are too small introduce statistical noise from local fibril fluctuations, while oversized volumes push computation times beyond practical limits. For wet-process separators, a 5-micrometer cube captures a representative pore distribution.
Dry-process separators, with larger slit-like pores, require volumes of at least 10 by 10 by 10 micrometers for structural convergence.
| Characterization Technique | Voxel Size (nm) | Field of View (μm) | Sample Infiltration Requirement | Pore Network Resolution |
|---|---|---|---|---|
| Laboratory X-Ray Nano-CT | 50 to 100 | 50 × 50 × 50 | Heavy Metal Stain Required | Coarse (Pores > 80 nm) |
| Synchrotron Phase Contrast CT | 15 to 30 | 30 × 30 × 30 | None (Phase Contrast) | Medium (Pores > 30 nm) |
| Cryo-FIB-SEM Nanotomography | 5 to 15 | 10 × 10 × 10 | Epoxy Infiltration Preferred | High (Full Pore Matrix) |
Pore Network Modeling and Directional Tortuosity Tensors
Quantifying tortuosity from 3D reconstructed datasets requires calculating direct geometric path lengths alongside fluid flux simulations. Geometric tortuosity measures the shortest centroid path through continuous pore space divided by straight-line membrane thickness. Hydraulic tortuosity comes from solving Navier-Stokes flow equations through the digital void network.
Dynamic ionic tortuosity calculates electric potential fields by solving Laplace equations across electrolyte-filled voxels.
Directional tortuosity tensors highlight clear anisotropy in stretched films. Uniaxially stretched dry separators show tortuosity values near 1.3 along the machine direction, 2.1 along the transverse direction, and 2.8 through the thickness. Wet-process separators remain nearly isotropic at 1.5 to 1.7 in machine and transverse directions, rising to 2.0 to 2.2 through the thickness.
Higher thickness-direction tortuosity lengthens effective ionic paths, directly raising internal cell resistance.
Tortuosity values between 1.45 and 1.62 derive from 50-nanometer resolution FIB-SEM tomograms. Dropping voxel size to 15 nanometers shifts calculated tortuosity up by about 0.15, as previously unresolved sub-20-nanometer constrictions enter the calculation.
Digital pore network extraction converts voxel datasets into ball-and-stick topological models, using spheres for open cavities and rods for narrowing pore throats. Topological modeling isolates the pore throat coordination number ~ the average number of continuous channels intersecting a single cavity. Polyolefin separators average coordination numbers between 3.2 and 4.8.
Values below 3.0 point to isolated pore pockets that reduce active surface area, worsening localized current crowding during high-power discharge.
X-ray tomographic reconstructions confirm that stack pressures above 1.0 MPa cause a 15 percent reduction in thickness-direction pore coordination numbers before macroscopic plastic deformation occurs.
Adding ISO 21845 compliance clauses to cell delivery agreements mandates 3D tortuosity reporting across five random master-roll slices, shifting latent defect risk back to the membrane converter.

Specification
Translating analytical characterization data into strict purchasing specifications bridges material science and procurement. A complete engineering drawing for a separator membrane sets physical, transport, thermal, and mechanical boundaries alongside clear verification methods. Tight parameter bands keep low-grade film lots off production lines without over-specifying and driving up material costs.
Receiving inspection procedures rely on statistical AQL sampling plans defined by ISO 2859-1. Master rolls undergo non-destructive checks for thickness, Gurley air permeability, and surface defect counts prior to release. Destructive testing ~ tensile tests, DSC thermal analysis, and capillary flow porosimetry ~ requires sampling across left, center, and right web positions to capture transverse manufacturing gradients.
Correlation of Structural Metrics to Cell Reliability
Variations in structural parameters directly alter electrochemical performance and safety windows in finished cells. Porosity shifts of more than plus or minus 3 percent from target cause noticeable spread in capacity grading and formation times. Low porosity restricts ionic transport, bringing high overpotentials and early lithium plating during fast charging.
High porosity weakens mechanical puncture resistance, increasing field risk of micro-shorts from cathode shedding or slitting burrs on foil edges.
Mean and maximum pore size limits control dendrite suppression. At sub-zero temperatures and high charge rates, lithium dendrites grow through continuous wide-diameter channels. Restricting maximum pore size below 80 nanometers, verified by bubble point testing, creates an effective physical barrier to dendrite penetration across the film thickness.
Contractual Tolerance Bands and Lot Acceptance Criteria
Quality agreements need precise test protocols paired with numerical limits. Setting a Gurley permeability value without defining instrument model, test area, and differential pressure leads to commercial disputes over rejected lots. Engineering control drawings specify exact test standards, such as ASTM D726 Method B or ISO 5636-5, along with equipment calibration schedules.
A typical procurement dossier for high-rate automotive cell separators sets standardized acceptance thresholds:
- Thickness tolerance held to nominal value plus or minus 0.8 micrometers across the full web width, verified with a low-force mechanical micrometer per ASTM D374.
- Gurley air permeability bounded within plus or minus 15 seconds per 100 cubic centimeters of air from target baseline, tested per ISO 5636-5.
- Thermal shrinkage capped at a maximum of 3.5 percent in the machine direction and 2.0 percent in the transverse direction after 60 minutes exposure at 120 °C per ASTM D1204.
- Puncture strength maintained at a minimum of 350 grams-force (3.43 newtons) using a 1.0-millimeter radius hemispherical pin at 50 millimeters per minute loading rate.
- Ceramic coating adhesion verified by zero flaking after a 180-degree tape pull test and 10 minutes of ultrasonic agitation in liquid electrolyte solvent.
Area specific resistance limits of 0.8 ohms times square centimeters rely on testing in 1.0 M LiPF6 EC:EMC (3:7 by volume) electrolyte at 20 °C. Dropping test temperature to 0 °C increases measured resistance by 22 percent due to electrolyte viscosity spikes, showing why environmental controls must be tightly specified during lot qualification.
Long-term fibril creep under continuous 2.0 MPa stack pressure over a ten-year operating lifespan cannot be predicted from short-term stress relaxation tests alone. Quality engineers manage this uncertainty by building in a 20 percent mechanical thickness safety margin and requiring a 1,000-hour thermal creep qualification under load before final design freeze.
Cell manufacturers and membrane suppliers structure warranty boundaries around incoming acceptance sign-offs. Once a separator roll passes receiving inspection and enters slitting, liability for mechanical damage shifts to the cell assembly plant. Maintaining clear correlation between bench metrics and assembly line yields remains the primary defense against unexpected field failures.