Quantifying Latent Degradation Mechanics in Transoceanic Battery Cell Freight under Environmental Stress
Quantifying ocean freight cell degradation requires tracking container micro-climates, modeling SEI growth, and enforcing baseline delta contract limits.

Hold
Intermodal containers on ship upper decks endure severe daily thermal swings from direct solar radiation and marine humidity. Tropical routes often push internal air temperatures inside sealed steel holds to 45 degrees Celsius, while top-tier deck stacks can hit 65 degrees Celsius. Relative humidity in unventilated containers routinely swings between 45 percent by day and 95 percent at night.
These shifts force rapid dew point transitions inside master cartons, condensing moisture directly onto protective foil packaging and structural pallets.
Cell degradation begins as soon as containers are sealed. Ocean transit from East Asian factories to Western European or North American ports takes 22 to 45 days, excluding drayage delays or customs holds. Throughout transit, cells face continuous thermal stress without active climate control.
UN 38.3 regulations require lithium-ion cells to ship at no more than 30 percent state of charge to mitigate thermal runaway risks during accidents. Yet holding cells at partial charge in high ambient heat drives complex kinetic trade-offs in cell chemistry.

Thermal Excursions in Maritime Cargo Stacks
Solar heating on exterior container walls creates steep internal temperature gradients. Top-deck containers absorb enough solar radiation to raise internal air temperatures up to 20 degrees Celsius above ambient sea air. Dock audits across three container elevation tiers show continuous thermal oscillation in upper stacks, peaking in mid-afternoon and dropping rapidly after sundown.
This thermal cycling accelerates reaction kinetics before the electrode matrix can reach chemical equilibrium.
Cargo stacks below the waterline stay cooler ~ typically between 18 and 24 degrees Celsius ~ but suffer prolonged heat soaking when holds trap engine-room dissipation. Heat moves through dense wooden pallets and multi-layer corrugated boxes very slowly. Once heat reaches the center of a dense pallet loaded with tens of thousands of cylindrical or prismatic cells, the core can retain it for days, keeping central pallet temperatures elevated long after container air cools in temperate waters.
Humidity Spikes and Condensation Dynamics
Moisture seeping past container door gaskets continuously threatens packaging integrity. Thermal expansion and contraction draw ambient marine air through non-hermetic door seals, accumulating water vapor inside packaging voids. When container walls drop below the internal dew point at night, condensation forms on interior surfaces and drips onto the pallets below.
Sustained 90 percent relative humidity can reduce corrugated packaging compression strength by up to 40 percent. As lower-tier cartons yield, mechanical loads transfer directly onto cell terminals, pouch seals, or prismatic vents. Condensation on nickel-plated steel cans or aluminum terminal busbars also drives localized galvanic corrosion, raising electrical contact resistance during pack welding and creating latent defects prior to module assembly.
Short-duration thermal excursions reaching 50 degrees Celsius during ocean shipping are frequently treated as acceptable logistics risks covered under standard international freight provisions.

Kinetics
Chemical degradation during ocean transit is driven by temperature-dependent interfacial mechanisms that proceed continuously without external current. Storing cells at elevated temperatures accelerates parasitic reactions between the liquid electrolyte and active electrode materials. Solid electrolyte interphase (SEI) growth on graphite anodes consumes cyclable lithium, permanently reducing capacity before the first operational charge cycle.
Concurrently, electrolyte oxidation at the cathode releases trace gases, raising internal cell pressure and degrading interfacial contact in pouch and prismatic cells.
These degradation pathways follow Arrhenius kinetics: parasitic electrolyte reduction rates roughly double for every 10 degree Celsius rise in cargo temperature. Storing a cell for 30 days at 45 degrees Celsius generates SEI growth equivalent to roughly 180 days at 25 degrees Celsius. The resulting passivation layer ties up active lithium and increases cell impedance.
A 10-degree thermal elevation during a 30-day ocean transit doubles the rate of parasitic electrolyte oxidation on graphite anodes stored at 30 percent state of charge.
Interfacial Reactions at Storage Potential
Thermodynamic instability between carbonaceous anodes and organic carbonate solvents drives continuous electrolyte breakdown at the anode interface. At a 30 percent state of charge, the graphite anode operates at roughly 0.15 to 0.20 Volts versus metallic lithium ~ a potential low enough to reduce solvent while maintaining a partially lithiated graphite structure. Lithium alkyl carbonates and inorganic lithium fluoride then precipitate out of the electrolyte, forming an uneven passivation layer across the graphite particles.
Uneven solid electrolyte interphase layers distort current density across the electrode face during subsequent cycling. Thick, resistive patches channel current through thinner adjacent regions during early charging, increasing lithium plating risks during fast-charging NPI validation steps. A 32-day ocean passage produces an average open-circuit voltage drop of 14 millivolts.
Cathode transition metal dissolution presents an additional degradation pathway under heat: trace moisture inside the cell reacts with lithium hexafluorophosphate salt to form hydrofluoric acid micro-concentrations that attack cathode active materials, dissolving manganese, nickel, or cobalt ions into the electrolyte. These dissolved cations migrate across the separator and deposit onto the graphite anode, where they catalyze further destruction of the protective SEI layer and accelerate active lithium consumption.
Capacity Loss and Solid Electrolyte Growth
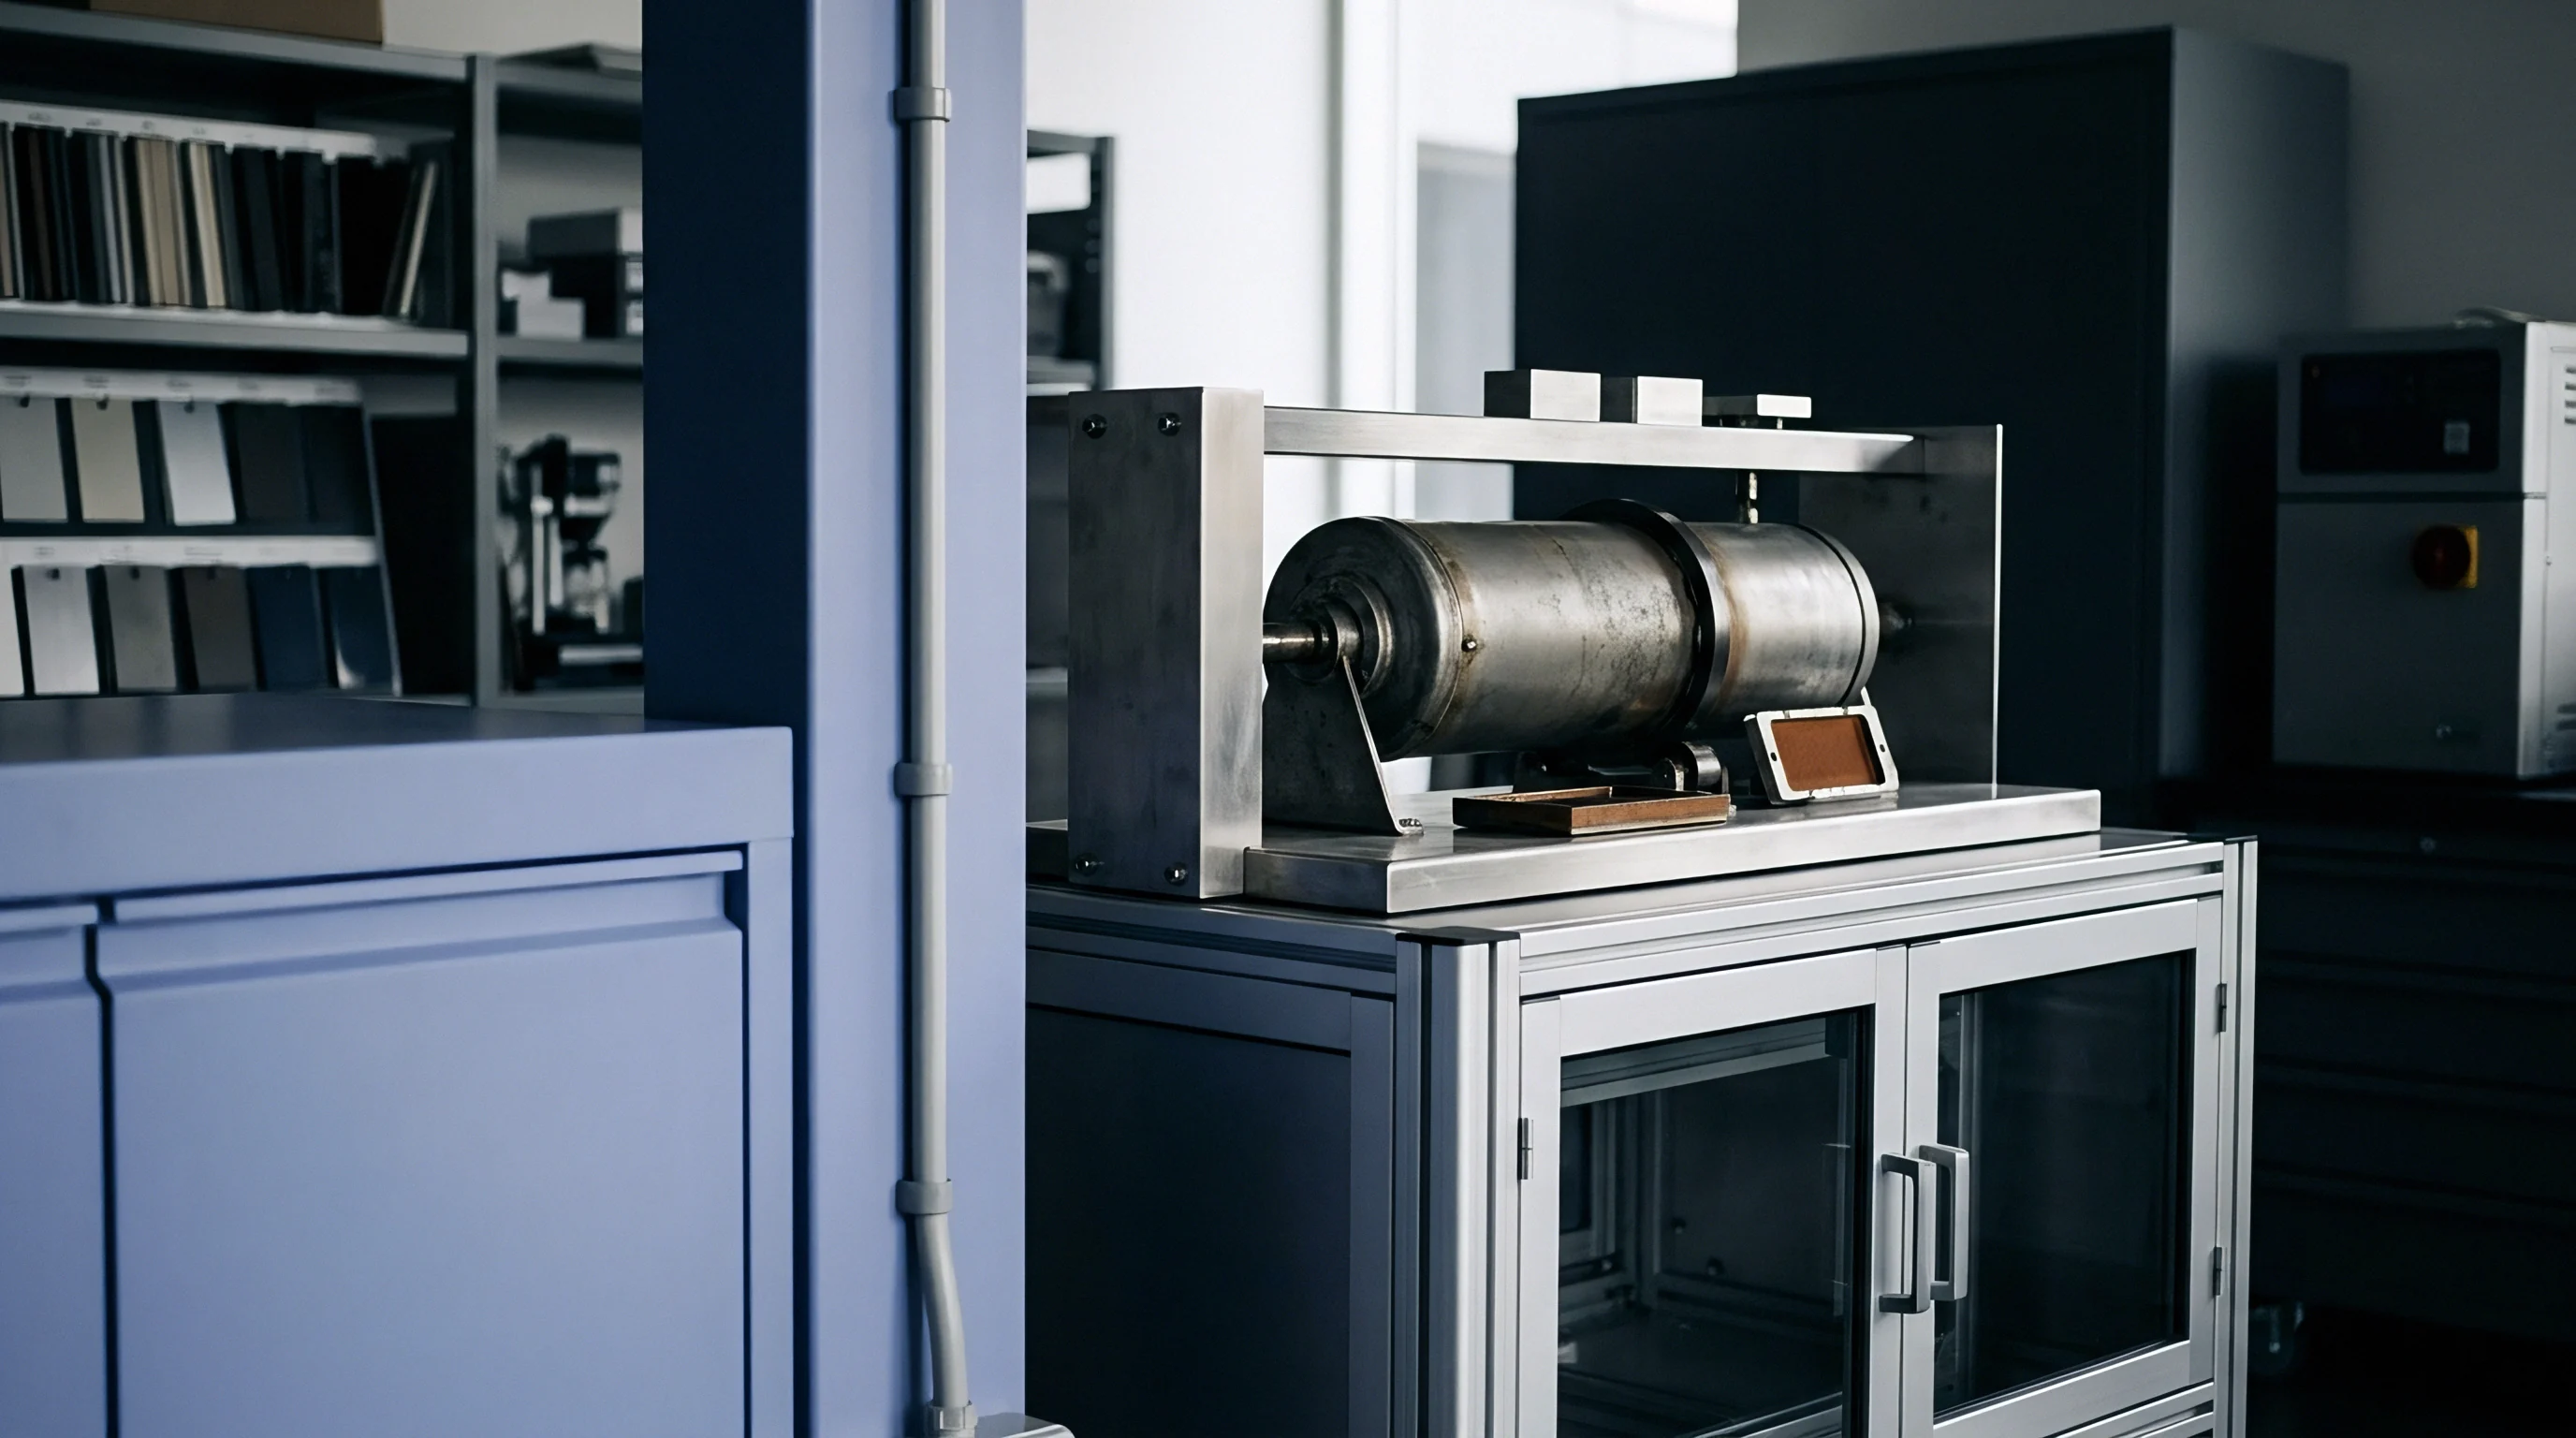
Irreversible capacity loss during shipping stems directly from the consumption of cyclable lithium. Reversible loss, by contrast, is driven by self-discharge through electron leakage across the passivation layer or residual impurities in the electrolyte. While conditioning cycles at the receiving facility can recover self-discharge, lost lithium permanently lowers the baseline capacity of the lot.
Cell chemistry dictates both the rate and specific mechanisms of this degradation. High-nickel cathodes exhibit significantly higher surface instability and outgassing under thermal stress than iron phosphate variants. Lithium iron phosphate cells offer superior structural stability, yet remain susceptible to iron dissolution and continuous anode film growth during warm transit.
Laboratory screening of incoming batches isolates charge-transfer resistance using electrochemical impedance spectroscopy at 25 degrees Celsius.
| Cell Chemistry | Storage SOC Range (%) | SEI Growth Rate (nm/day at 45°C) | Irreversible Capacity Loss (% per 30 Days at 45°C) | Impedance Growth ΔR_ct (% per 30 Days at 45°C) |
|---|---|---|---|---|
| LFP (Lithium Iron Phosphate) | 25 – 30 | 0.08 – 0.12 | 0.25 – 0.40 | 3.2 – 4.8 |
| NMC 622 (Nickel Manganese Cobalt) | 28 – 30 | 0.14 – 0.22 | 0.60 – 0.90 | 6.5 – 9.1 |
| NMC 811 (High-Nickel Cathode) | 25 – 28 | 0.25 – 0.38 | 1.10 – 1.65 | 11.4 – 15.2 |
| LTO (Lithium Titanate Anode) | 30 – 50 | 0.01 – 0.03 | 0.05 – 0.10 | 0.8 – 1.4 |

Worked Model of Arrhenius Rate Acceleration
Estimating latent capacity loss during transit requires processing container temperature logs through an Arrhenius kinetic model. Electrolyte oxidation follows an activation energy relationship in which the rate constant scales exponentially with temperature. For an NMC 811 cylindrical cell at 30 percent state of charge, baseline capacity loss is 0.01 percent per day at 25 degrees Celsius, with an activation energy of 58 kilojoules per mole for SEI growth.
Thermal exposure compounds this interfacial growth over time. When container loggers record an ocean route profile of 10 days at 22 degrees Celsius, 15 days at 42 degrees Celsius, and 7 days at 35 degrees Celsius, acceleration factors must be calculated for each leg. The dimensionless acceleration factor relative to 25 degrees Celsius is derived from activation energy, the gas constant, and the shift in absolute temperature.
For the 42 degree Celsius leg, shifting from 298.15 Kelvin to 315.15 Kelvin yields an acceleration factor of roughly 3.42, making those 15 days equivalent to 51.3 days of room-temperature storage. For the 35 degree Celsius stretch, the factor drops to 2.06, turning 7 days of transit into 14.4 equivalent days at 25 degrees. In total, the 32-day voyage inflicts the equivalent of 75.7 days of room-temperature aging, raising expected irreversible capacity loss from 0.32 percent to 0.76 percent before containers are opened.
Subsurface chemical mechanisms alter long-term cell behavior through specific structural and interfacial manifestations:
- Gas Evolution occurs as organic carbonates break down into ethylene, carbon dioxide, and methane gas inside pouch or prismatic cell enclosures.
- Pouch Swelling reduces internal electrode stack compression pressure and expands outer cell envelope physical dimensions beyond specified engineering tolerances.
- Separator Pore Clogging develops as dissolved transition metal compounds precipitate within sub-micron polymer separator channels, reducing local ionic conductivity.
- Micro-Cracking spreads across high-nickel cathode particles due to localized lattice volume changes associated with non-uniform self-discharge states.
- Binder Degradation weakens active material adhesion to current collector foils, lowering mechanical vibration tolerance during subsequent freight drayage.
Whether non-destructive electrochemical impedance spectroscopy can distinguish transport-induced interfacial growth from baseline manufacturing variance prior to pack assembly remains an open question across high-volume production lines.


Vibration
Battery cargo experiences mechanical vibration profiles unique to maritime logistics. Main engine rotation speeds and propeller blade pass frequencies generate low-frequency vibrations between 5 and 30 Hertz. Hull flexure in heavy seas introduces sub-Hertz dynamic loads, pitching and rolling stacks over thousands of nautical miles.
Subsequent highway drayage adds higher-frequency vibration between 50 and 200 Hertz, punctuated by shocks reaching 3g during container yard crane operations.
These mechanical stresses act directly on internal cell components. Micro-motion between active material coatings and current collector foils induces mechanical fretting. In cylindrical cells, continuous lateral acceleration forces the jellyroll against the steel can wall, fatiguing the center mandrel pin and top-tab welds.
Lacking a rigid outer shell, pouch cells rely entirely on pack-level clamping pressure to prevent internal layer shifting during transit.
Mechanical stack pressure inside prismatic cells reduces internal tab flutter under continuous hull vibration.

Low Frequency Marine Engine Harmonic Coupling
Resonance occurs when transit vibration matches the natural frequencies of packed battery modules. Multi-tier pallets behave as spring-mass damper systems: bottom pallets transfer floor vibration upward, while packaging layers in the core damp or amplify specific frequencies based on box stiffness and foam density. Harmonic amplification between 12 and 18 Hertz induces flexural bending across internal terminal joints.
Inside cylindrical cells, persistent friction degrades the thin insulating sleeve surrounding the positive terminal assembly. As the steel rim rubs against current collector tabs, it strips protective coatings and generates conductive metallic debris. These loose micro-particles can migrate to electrode edges and bridge the separator membrane, creating localized micro-shorts that increase self-discharge.
Internal Contact Resistance and Tab Fatigue
Ultrasonic welds connecting aluminum cathode tabs and copper anode tabs to external terminals endure continuous cyclic shear stress during sea transit, leading to fatigue micro-cracking along the weld nugget perimeter. Even if the joint remains intact, the reduction in effective cross-sectional area increases internal DC resistance across the connection.
Evaluating mechanical degradation vectors post-transit requires a systematic inspection sequence executed prior to module assembly:
- Select five master pallets from distinct container location zones including top-deck forward, mid-hold center, and aft engine proximity positions.
- Remove outer stretch wrap and perform dimensional checks on corrugated packaging to identify structural box buckling or load-displacement offsets.
- Extract twenty sample cells per pallet and execute high-resolution X-ray computed tomography imaging to inspect internal jellyroll alignment and tab weld geometry.
- Perform broad-band AC internal resistance measurements at 1 kilohertz across sample cells to identify electrical contact resistance shifts relative to factory end-of-line data.
- Subject five open-circuit sample cells to acoustic emission scanning during controlled mechanical compression to detect subsurface active material delamination.
Separator damage is irreversible. Friction between active material coatings and ceramic-coated separator films abrades surface layers, reducing separator thickness and lowering dielectric breakdown voltage. This increases safety risks during pack assembly and commissioning.
In prismatic cells, heavy internal electrode stacks generate sliding forces under vibration that stress top cover glass-to-metal seals, creating micro-leak paths for moisture ingress.
Inserting damping materials between module trays mitigates harmonic coupling before structural micro-fretting compromises tab integrity.

Baseline
Establishing incoming quality criteria requires isolating transit damage from baseline factory variation. End-of-line testing captures cell parameters immediately after factory grading and aging, but ocean transit adds weeks of uncontrolled environmental exposure that alter those baselines prior to receiving inspection. Without statistical separation between factory variance and transit degradation, disputes over non-conforming lots inevitably stall between vendors and carriers.
Incoming inspection procedures must enforce a mandatory stabilization window. Cells arriving from ocean transit are not in electrochemical or thermal equilibrium. Electrolyte redistribution, micro-bubble absorption in porous electrodes, and the relaxation of local concentration gradients require holding cells at controlled temperatures before parametric measurements are meaningful.

Stabilization Protocols at Incoming Inspection
Impedance growth reduces peak power delivery. Incoming shipments require a climate-controlled quarantine at 20 to 25 degrees Celsius for 72 hours prior to open-circuit voltage measurements. Checking voltages directly upon container unsealing yields skewed data due to thermal gradients across the pallet: a 5 degree Celsius delta between outer cells and the core shifts OCV by several millivolts, masking true self-discharge rates.
After thermal stabilization, cells enter a 14-day voltage tracking protocol to calculate K-value self-discharge rates in millivolts per day. Elevated K-values indicate internal micro-shorts or accelerated parasitic reactions from transit stress. Stabilization hold times are determined from electrolyte relaxation curves measured across three test temperatures.

Why Does Open Circuit Voltage Drift after Sea Transit?
Voltage drift following ocean transport stems from a combination of benign electrochemical relaxation and permanent degradation. Parasitic reactions consume cyclable lithium at the anode, shifting its equilibrium potential. Concurrently, slow lithium-ion intercalation into deeper graphite layers relaxes residual concentration gradients left by high-rate factory grading charges.
Impurity shuttles in the electrolyte also suppress voltage over time. Residual moisture, trace iron, or unreacted electrolyte additives cycle between electrodes in continuous redox reactions. This shuttle drains cell charge without altering primary electrode structures, resulting in reversible capacity loss that clears after a full reconditioning cycle.
| Evaluation Metric | Standard Factory EOL Range | Max Allowable Freight Shift (Δ) | Rejection Threshold | Primary Failure Indication |
|---|---|---|---|---|
| Open Circuit Voltage (OCV) | 3.645 V – 3.655 V | -12 mV | < 3.630 V | Accelerated self-discharge / Internal micro-short |
| AC Internal Resistance (1 kHz) | 0.82 mΩ – 0.88 mΩ | + 0.08 mΩ | > 0.98 mΩ | Tab weld fatigue / Electrolyte conductivity loss |
| DC Internal Resistance (10s pulse) | 1.15 mΩ – 1.25 mΩ | + 0.15 mΩ | > 1.45 mΩ | SEI passivation growth / Cathode film buildup |
| Cell Mass / Weight Difference | 48.2 g ± 0.3 g | – 0.05 g | – 0.12 g | Electrolyte micro-venting / Pouch seal failure |
| Thickness (Pouch Format) | 7.20 mm ± 0.08 mm | + 0.15 mm | > 7.42 mm | Internal micro-gassing / Stack delamination |
Section 7 of standard international supply contracts assigns all cell impedance growth during sea freight exceeding three percent to ocean transport carrier insurance limits.
Quality engineers execute specific verification steps to audit incoming freight integrity:
- Thermal Data Extraction validates container temperature history against agreed environmental shipping envelope specifications.
- Package Seal Inspection checks barrier foil packaging vacuum levels to identify micro-punctures or moisture barrier degradation.
- Dimensional Stack Verification measures total pallet height variations to detect lower-tier packaging box collapse.
- Differential Voltage Analysis identifies subtle structural shifts in cathode peak positions indicative of localized active lithium loss.
- Statistical Outlier Filtering isolates individual cells exhibiting K-values exceeding three standard deviations from the lot mean.
Skipping post-freight voltage stabilization leads to improper sorting, allowing degraded cells to enter welded pack assemblies where premature capacity fade forces early module scrapping.


Allocation
Commercial contract terms determine financial responsibility for latent cell degradation during ocean transit. Defining clear liability boundaries among cell manufacturers, ocean carriers, freight forwarders, and pack integrators prevents prolonged disputes over degraded shipments. Most standard supply contracts omit latent electrochemical degradation, addressing only visible physical damage or total cargo loss.
Incoterms define where risk and legal title transfer from seller to buyer. Free On Board (FOB) shifts transit risk to the buyer once cargo passes the vessel rail at the origin port, whereas Delivered Duty Paid (DDP) retains seller liability until final dock delivery. Under FOB terms, latent thermal damage incurred in top-deck stacks falls on the buyer unless carrier negligence can be established under maritime law.

Incoterms and Transfer of Degradation Risk
FOB terms expose buyers to chemical aging occurring in international waters. When container temperatures reach 55 degrees Celsius in top-deck stacks, capacity loss and impedance growth occur while cargo is legally in the buyer’s custody. Recovering losses from marine insurers requires proof that transit conditions violated standard carriage parameters.
Cost, Insurance, and Freight (CIF) terms require the seller to procure marine insurance, yet standard cargo policies routinely exclude losses arising from inherent vice ~ the natural deterioration of goods based on their physical nature. Underwriters frequently categorize high-temperature SEI growth as an inherent vice of stored lithium-ion cells, rejecting claims unless the container suffered structural damage or the vessel experienced a casualty.
| Incoterm Selection | Title Transfer Point | Degradation Risk Owner | Insurance Claim Obligation | Latent Defect Recovery Viability |
|---|---|---|---|---|
| EXW (Ex Works) | Seller Factory Gate | Buyer | Buyer bears all transport claims | Zero seller liability post-handover |
| FOB (Free On Board) | Vessel Rail at Origin Port | Buyer | Buyer claims against carrier/insurer | Difficult; requires proof of transit fault |
| CIF (Cost, Insurance, Freight) | Vessel Rail at Origin Port | Buyer (Risk) / Seller (Policy) | Seller policy pays; buyer claims | Moderate; contested under inherent vice rules |
| DDP (Delivered Duty Paid) | Buyer Receiving Dock | Seller | Seller manages all cargo insurance | High; buyer rejects out-of-spec lots at dock |

Data Logger Calibration and Freight Dossiers
Commercial protection relies on continuous environmental monitoring. Calibrated loggers placed in pallet cores provide an objective record of shock, temperature, and humidity, provided serial numbers map directly to specific bills of lading. Landed cost models integrate potential capacity scrap expenses directly into unit contract pricing.
Data loggers mounted inside cargo containers provide the sole admissible evidence during marine insurance claims for thermal freight damage.
Incorporating explicit delta clauses into supply contracts bridges factory quality guarantees and incoming receiving audits. A landed quality agreement defines acceptable parameter shifts during transit, specifying maximum allowable OCV drop or impedance growth. If incoming batch tests exceed these delta limits, the contract triggers price adjustments, batch replacement, or seller-funded secondary screening.
Adding explicit contract addenda with defined thresholds for open-circuit voltage drift, DC resistance growth, and dimensional swelling shifts financial liability for unpassivated SEI growth back to the cell manufacturer.