Solid State Cell Thickness Expansion Baseline Measurement Methods
Establishing baseline solid-state cell thickness demands constant pressure fixtures with fixture compliance subtraction and zero-state reference at SOC zero.

Swell
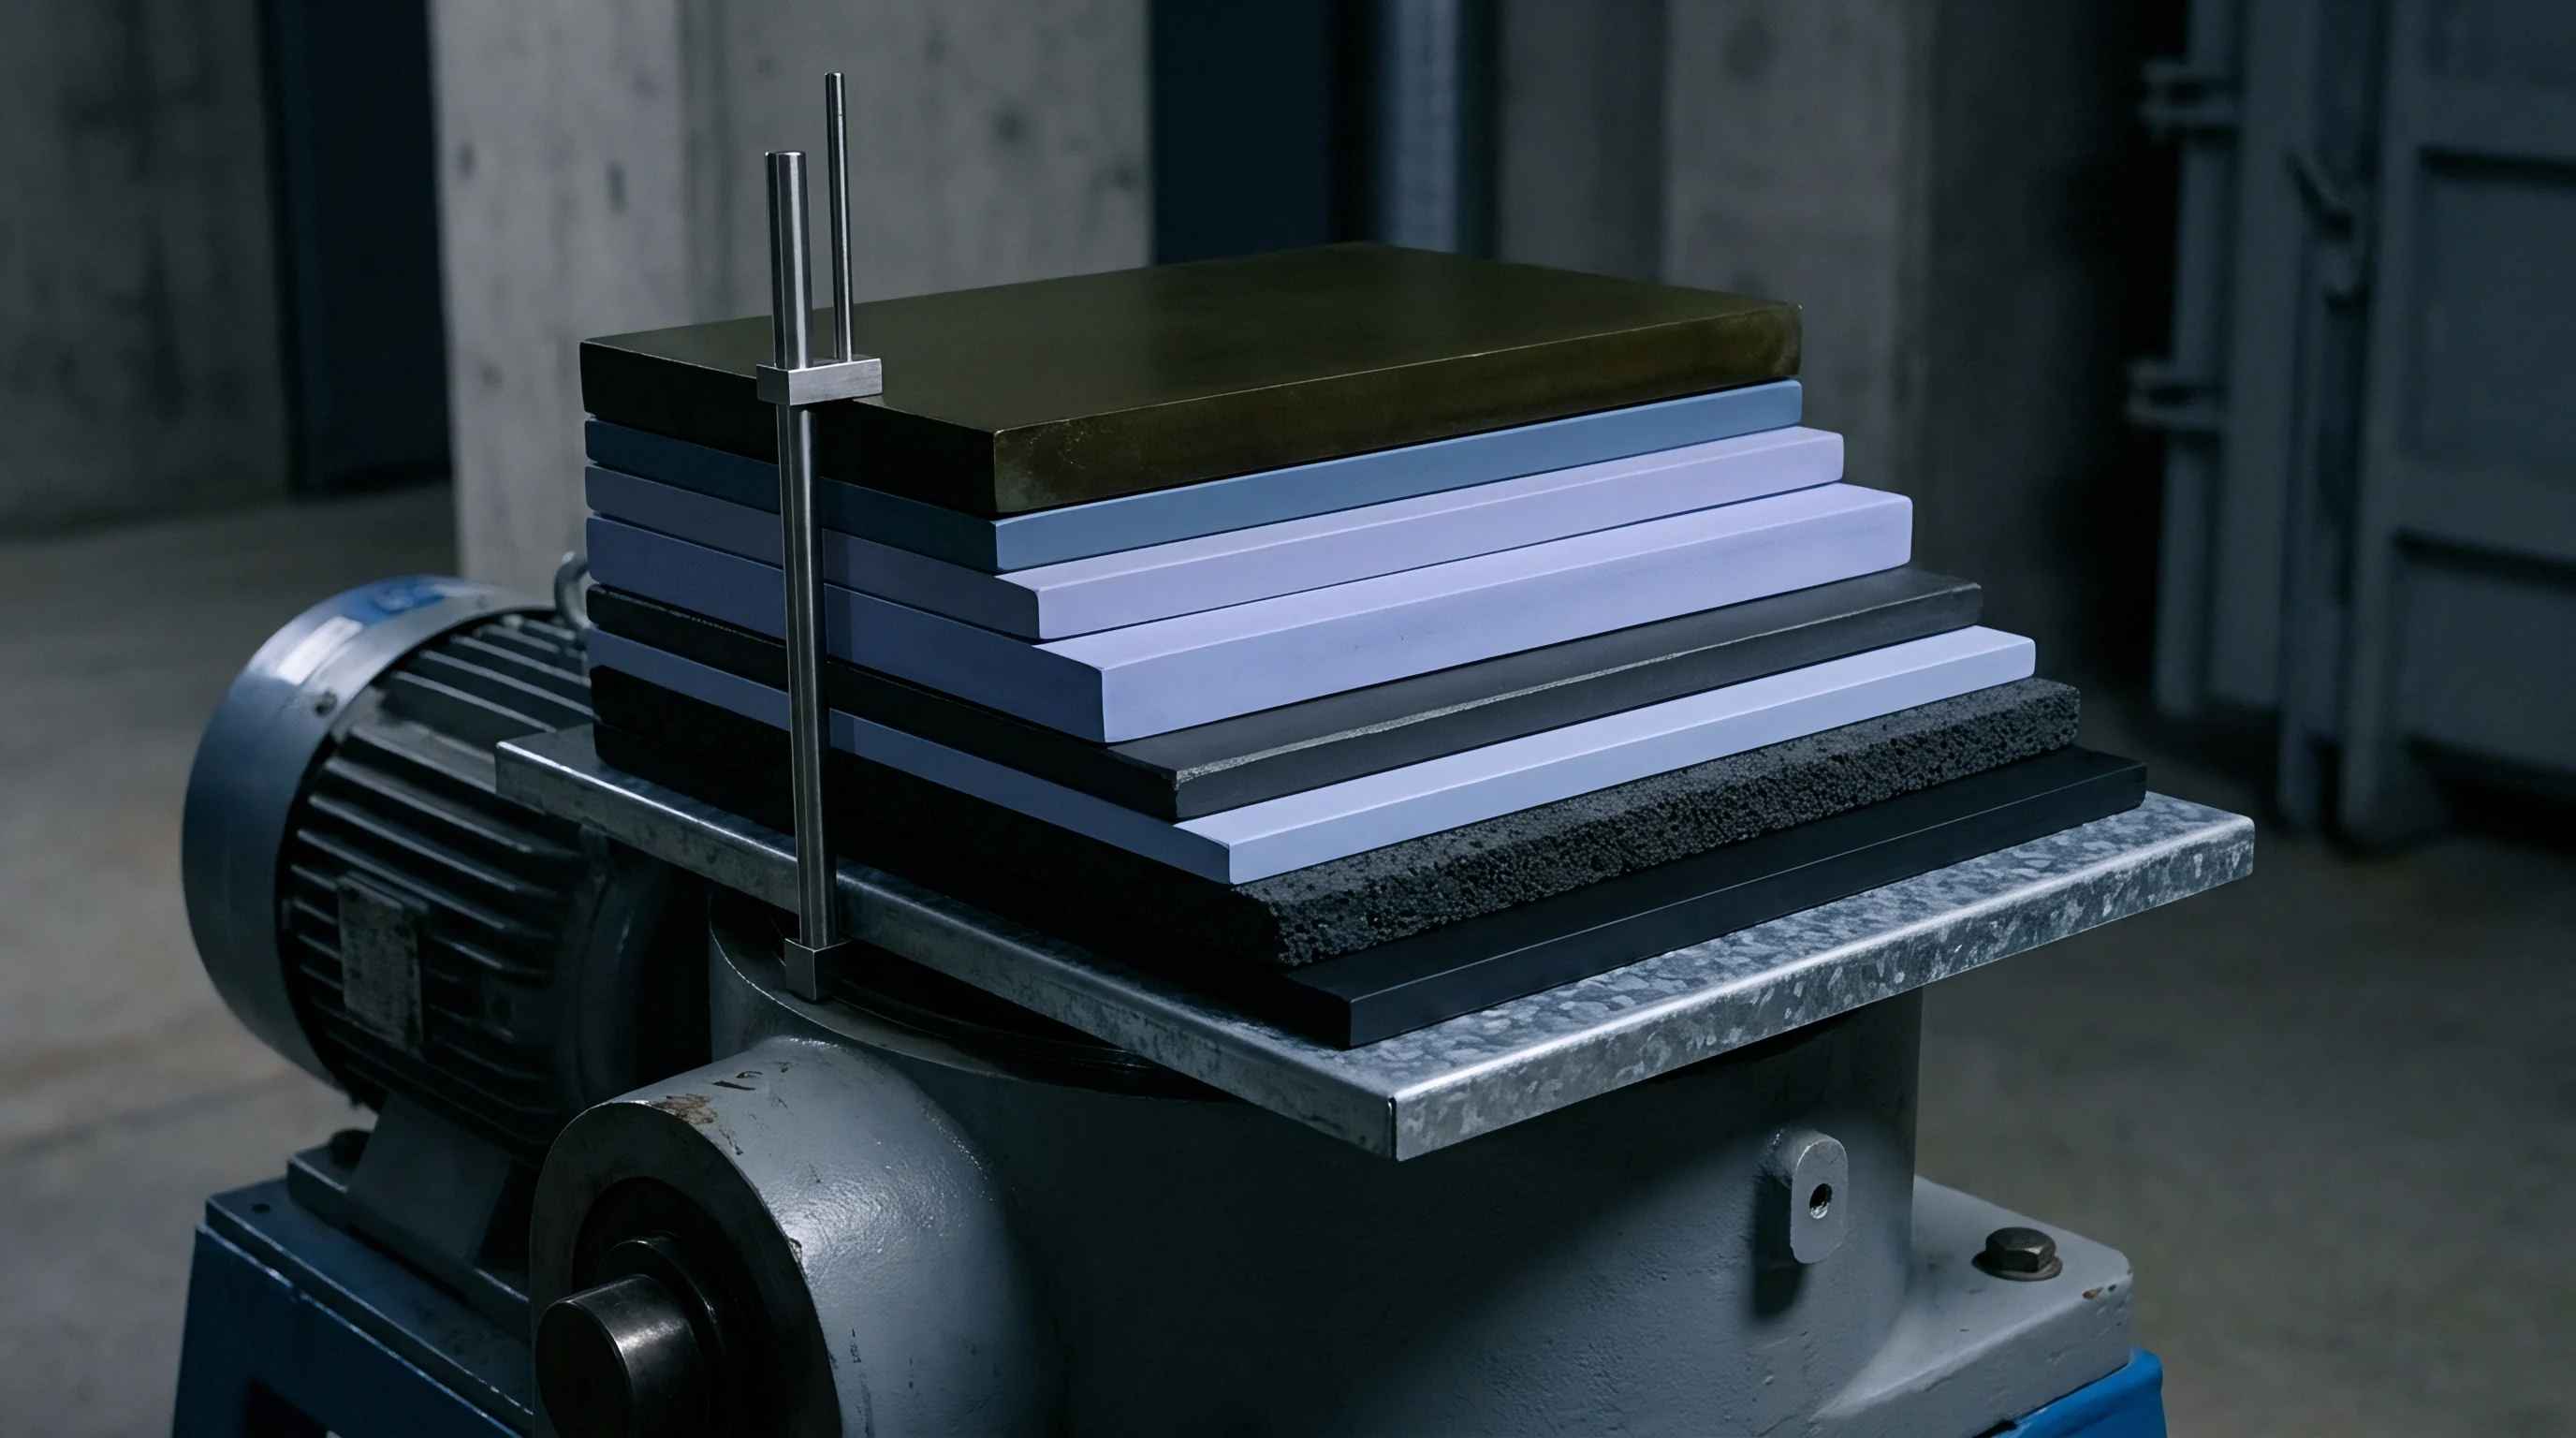
Solid-state pouch cells expand and contract quite differently from conventional liquid-electrolyte cells. Plating metallic lithium at the anode forces a direct thickness gain tied to the deposited mass, while rigid solid electrolyte separators transfer stress across solid-solid interfaces. Standard graphite-anode lithium-ion pouch cells expand only three to seven percent during charge as lithium intercalates and liquid shifts through porous electrodes.
Unconstrained solid-state cells with pure lithium anodes or high-loading silicon-carbon composites can grow by twenty to forty percent at the cell level. Capturing this displacement accurately requires standardized baseline measurements before cells are placed in module enclosures.
Getting a reliable baseline thickness means separating permanent structural changes from short-term thermal or mechanical transients. The initial factory thickness represents a zero-stress or nominal pre-load state, but early formation cycles under stack pressure permanently alter the cell’s shape. SEI growth, localized plastic flow of lithium micro-protrusions, and microscopic voids at the interface all reshape the outer envelope.
Without a standardized protocol recorded at zero state of charge under defined clamp loads, module calculations will undercount swelling forces, risking warped housings or early fatigue failure in structural fixtures.
| Electrolytic System Type | Anode Architecture | Applied Stack Pressure (MPa) | Baseline Thickness (mm) | Reversible Expansion at 100% SOC (%) | Irreversible First-Cycle Set (%) |
|---|---|---|---|---|---|
| Sulfide (Li10GeP2S12 / LPSCL) | Lithium Metal (40 µm foil) | 5.00 ± 0.05 | 3.45 ± 0.02 | 14.2 ± 0.4 | 2.1 ± 0.1 |
| Sulfide (LPSCL) | Anode-Free (Zero Excess Li) | 8.00 ± 0.10 | 2.88 ± 0.02 | 18.6 ± 0.6 | 3.4 ± 0.2 |
| Oxide Ceramic (LLZO pellet composite) | Lithium Metal (20 µm foil) | 1.50 ± 0.02 | 4.10 ± 0.03 | 6.8 ± 0.2 | 0.8 ± 0.05 |
| Polymer (PEO-based matrix) | Silicon-Graphite (70% Si) | 0.50 ± 0.01 | 5.20 ± 0.04 | 28.5 ± 0.9 | 5.2 ± 0.3 |
| Halide (Li3YCl6 composite) | Micro-Silicon Powder | 3.00 ± 0.05 | 3.95 ± 0.02 | 22.1 ± 0.7 | 4.0 ± 0.2 |
Thickness measurements depend heavily on the mechanical boundary conditions applied during testing. Fixed-distance fixtures cause internal stress to climb non-linearly, whereas constant-pressure setups let the cell expand under a fixed normal force. A thickness reading that omits the exact contact pressure has little engineering value.
Plating twenty micrometers of lithium across a ten-ampere-hour pouch cell adds about twenty micrometers per side assuming perfect planar growth, but real cells form localized dendrites, uneven current distribution, and edge concentrations. These local variations can create thickness spikes thirty percent higher than average calculated growth.
A lithium metal pouch cell expanding fourteen percent under five megapascals applied pressure generates structural displacement forces that warp unreinforced aluminum compression plates.
Solid-state cells consolidate irreversibly during initial formation cycling. When lithium strips during the first discharge, the solid electrolyte cannot conform into micro-cavities unless the applied stack load exceeds the yield strength of the lithium layer at operating temperature. Consequently, the baseline thickness post-formation looks very different from the dry, uncycled cell received at incoming inspection.
Sourcing contracts that ignore the difference between raw incoming dimensions and post-formation zero-state thickness invite legal disputes over dimensional compliance during module assembly.

Anode Plating Kinematics and Volumetric Scaling
Lithium deposition follows Faraday’s law, turning electrical charge into physical volume. Metallic lithium has a molar volume of 13.02 cubic centimeters per mole, so transferring one milliampere-hour per square centimeter yields a theoretical pure lithium layer 2.06 micrometers thick. An anode-free cell charged to an areal capacity of four milliamperes-hour per square centimeter plates an eight-micrometer lithium film on each active surface.
In a cell with twenty bi-cell pairs, that plating alone adds over three hundred micrometers to total cell thickness.
Silicon active materials store lithium by alloying rather than plating. Fully lithiating silicon to Li22Si5 causes unit cell expansion close to three hundred percent. Silicon-carbon composite electrodes absorb some of this strain within porous matrices, but the electrode layer still swells between twenty and fifty percent at full charge.
Baseline metrology must distinguish between discrete interfacial growth on lithium metal and bulk composite strain in silicon architectures. How much internal volume change translates to external thickness growth depends largely on the stiffness of the electrolyte layer.
Swelling mechanics are highly temperature-dependent. Elevated temperatures accelerate lithium creep, helping the metal flow under stack pressure into interfacial voids. At twenty-five degrees Celsius, lithium deforms plastically above one megapascal.
By sixty degrees, its yield strength drops sharply, speeding up stress relaxation and lowering peak baseline growth over long cycles. Baseline protocols require tight temperature control in environmental chambers so thermal expansion does not mask electrochemical swelling.
Test fixture compliance can absorb cell movement during testing, hiding real growth behind frame deflection.

Bench
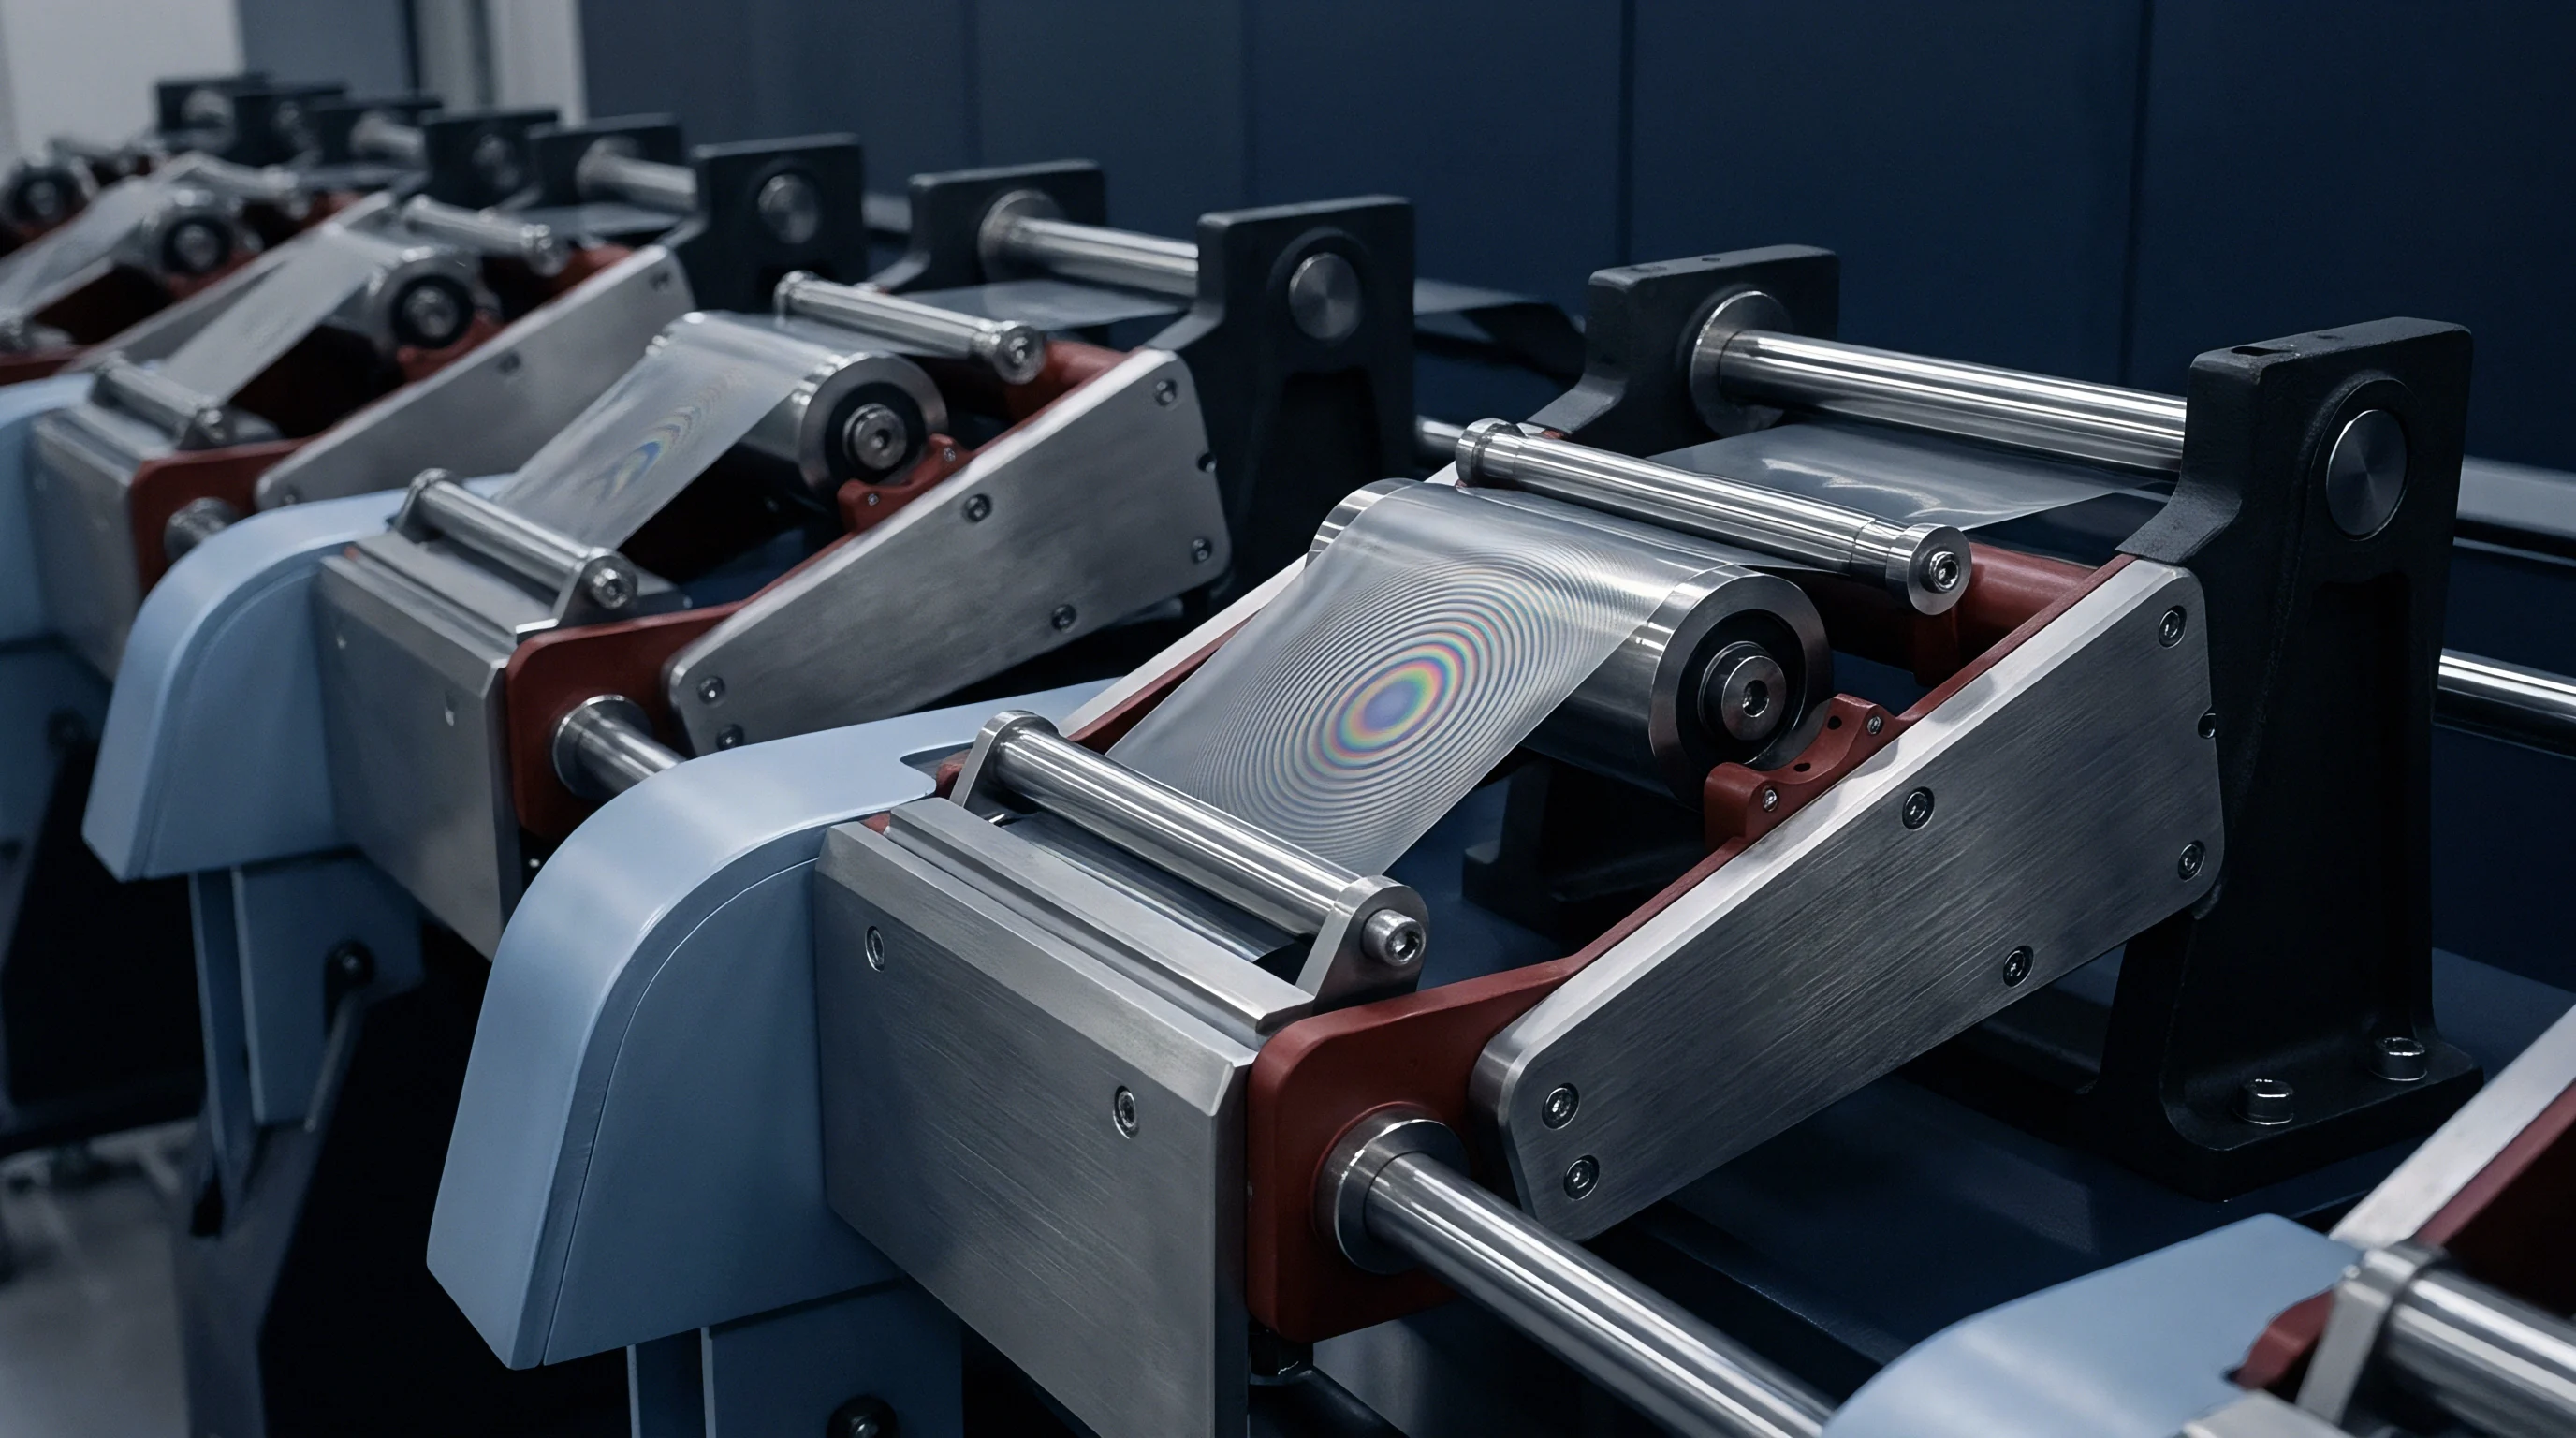
Metrology equipment used for baseline verification has to isolate cell expansion from the mechanical compliance of the measurement rig. A typical frame includes parallel platens, tie rods, a load cell, and displacement sensors. Clamping a 100 mm by 150 mm cell at five megapascals takes seventy-five kilonewtons of total force ~ enough to bend steel platens, stretch guide rods, and deflect load cell diaphragms.
Uncorrected frame distortion leads directly to baseline errors that invalidate warranty claims.
Sensors mounted on outer platen faces read the combined deflection of both cell and rig, skewing raw measurements. Calibrating the frame with a polished ceramic gauge block of known thickness and modulus allows tool deflection to be mathematically subtracted. This calibration maps force against fixture displacement from zero to one hundred kilonewtons, allowing raw cell displacement profiles to be corrected down to true cell-level expansion.
| Sensor Technology | Measurement Resolution (µm) | Accuracy Class (µm) | Contact Force Influence | Thermal Drift Susceptibility | Sampling Rate Limit (Hz) |
|---|---|---|---|---|---|
| Linear Variable Differential Transformer (LVDT) | 0.05 | ± 0.20 | Low (Internal spring 0.1 N) | Medium (0.1 µm/°C uncompensated) | 1000 |
| Laser Triangulation Optical Head | 0.10 | ± 0.50 | Zero (Non-contact optical beam) | Low (Controlled optical path) | 5000 |
| Capacitive Displacement Probe | 0.01 | ± 0.05 | Zero (Non-contact electric field) | High (Requires constant humidity) | 10000 |
| Digital Contact Dial Indicator | 0.50 | ± 1.50 | High (Spring pre-load up to 2.5 N) | Low (Mechanical temperature compensated) | 50 |
Linear Variable Differential Transformers (LVDTs) offer excellent long-term stability during extended chamber testing. Because they operate by electromagnetic induction, they lack sliding contact surfaces that degrade over thousands of hours. Laser sensors avoid mechanical contact altogether, eliminating soft pouch surface compression.
Optical methods do require access windows in environmental chambers, which can introduce refraction errors if the glass plates fall short of optical quality standards.
ISO 12405-4 dictates that displacement sensors must achieve a measurement resolution ten times finer than the target tolerance of the cell envelope specification.
Mounting fixtures inside environmental chambers introduces significant thermal drift. Standard 316 stainless steel expands by sixteen micrometers per meter per degree Celsius. On a two-hundred-millimeter column, a ten-degree temperature shift creates thirty-two micrometers of expansion ~ matching the total electrochemical signal of an advanced oxide cell.
Building fixtures from Low Expansion Invar 36 drops structural thermal expansion to 1.2 micrometers per meter per degree Celsius, separating cell breathing from ambient temperature swings.

Can Optical Sensors Replace Mechanical Contact Gauges?
Laser triangulation sensors measure surface topographies without applying mechanical pressure, spotting localized swelling domes and edge curling that single-point LVDTs miss. However, aluminum laminate pouch films are highly reflective. Specular reflections scatter laser beams and saturate photodetectors, producing false height spikes unless anti-glare filters or diffuse polarization lenses are fitted.
Capacitive sensors offer sub-nanometer resolution for thin-film cell testing by tracking capacitance changes between a calibrated probe tip and the cell’s conductive pouch casing. The method requires strict control over dielectric permittivity in the air gap. Humidity shifts, air breakdown, or chamber ionization alter permittivity, causing drift that easily mimics actual cell expansion.
Consequently, capacitive setups need dedicated environmental shielding.
Mechanical contact gauges remain practical for fast incoming batch checks at receiving docks. However, probe spring forces between 0.5 and 3.0 Newtons compress soft pouch materials, under-reporting thickness by up to fifteen micrometers. Using flat anvil tips with at least one square centimeter of contact area spreads the load and prevents local deformation during inspection.
Several mechanical error sources regularly distort raw metrology data during baseline expansion testing:
- Platen Non-Parallelism skews stress across the pouch surface, crushing localized areas and distorting thickness measurements.
- Thermal Expansion Mismatch between tie rods and load cells drifts the zero point during temperature ramps.
- Load Cell Creep under sustained pressure produces artificial load decay signals that mimic cell stress relaxation.
- Cable Strain Hysteresis tugs on sensor housings, introducing false micrometer-scale shifts.
- Pouch Envelope Wrinkling traps air under platens, giving artificially high initial thickness readings that collapse once load is applied.
Rigid, symmetric fixture frames prevent frame tilting under load automatically.

Clamp
Baseline measurements require strict control over stack boundary conditions. Testing solid-state cells without external pressure causes rapid interface delamination, leading to impedance spikes and heavy capacity loss within ten cycles. Applied pressure keeps solid electrolyte particles in close contact with active material surfaces.
But establishing a baseline under constant pressure is mechanically quite different from doing so under constant volume.
Constant-pressure testing uses pneumatic actuators, hydraulic cylinders, or low-rate spring packs. As the cell expands on charge, the fixture backs off to accommodate growth while holding force near target. Constant-volume fixtures lock rigid platens at a fixed baseline gap, preventing outward expansion and converting volumetric swelling into massive internal stress.
Under constant volume, internal stress frequently climbs from an initial 1.0 MPa baseline to more than 15.0 MPa at full state of charge.
| Applied Stack Load (kN) | Raw Sensor Reading (mm) | Fixture Deflection (µm) | Thermal Strain Offset (µm) | Corrected Baseline (mm) | Uncertainty Band (µm) |
|---|---|---|---|---|---|
| 5.0 | 4.125 | 12.4 | + 1.8 | 4.1144 | ± 0.4 |
| 10.0 | 4.210 | 24.8 | + 1.8 | 4.1870 | ± 0.5 |
| 20.0 | 4.345 | 49.6 | + 1.8 | 4.2972 | ± 0.7 |
| 30.0 | 4.480 | 74.4 | + 1.8 | 4.4074 | ± 0.9 |
| 50.0 | 4.715 | 124.0 | + 1.8 | 4.5928 | ± 1.2 |
Pneumatic clamps maintain precise force through closed-loop proportioning valves tied directly to load cell feedback. These compressed air systems react quickly to rapid volume changes during high-rate charging or thermal events. Hydraulics manage heavy loads above fifty kilonewtons but are prone to oil viscosity shifts and slow leaks during long cycling tests.
Passive spring packs are reliable and draw no power, though spring force climbs linearly as the cell expands against spring rate k.
Calculating true expansion under a spring clamp requires solving the coupled electro-chemo-mechanical force equation, where spring force F equals initial pre-load F_0 plus the spring constant k times expansion delta-d. Choosing soft springs keeps force variation low across the cycle. A low-stiffness spring pack deflects significantly under pre-load, storing elastic energy so small cell displacements produce minimal load changes ~ closely mimicking a constant-pressure setup.
IEC 62660-2 mandates that baseline dimensional reports must explicitly state whether measurements were recorded under free-standing, constant-pressure, or constant-volume mechanical boundary conditions.
Getting an accurate baseline requires careful pre-test mechanical taring. The standard operational procedure follows these steps:
- Clean top and bottom ground ceramic platen surfaces with electronic-grade isopropyl alcohol to remove particulate contaminants.
- Install the reference gauge block into the central measurement zone between platens.
- Apply the target pre-load force at a controlled loading rate of 0.1 kilonewtons per second using the primary actuator.
- Record the raw baseline zero displacement offset from all LVDT channels after a five-minute mechanical dwell time.
- Release applied load, remove the gauge block, and position the solid-state test cell centrally on the lower platen surface.
- Re-apply target pre-load force and allow five minutes for pouch internal air displacement and mechanical relaxation before starting baseline logging.
Fixture calibration revealed five percent uncompensated frame deflection during high-load baseline runs. This flex masked early swelling, allowing non-compliant cells to pass receiving audits. Updating structural stiffness models resolved the discrepancy, bringing incoming dock measurements into line with lab validation data.
Load cell design also affects long-term stability. S-beam sensors handle inline loads well but are sensitive to off-axis moments from uneven swelling. Button load cells fit small spaces but introduce point-loading errors if platens tilt even slightly.
Multi-axis pancake load cells measure axial force together with bending moments, warning operators when non-uniform expansion creates dangerous shear forces across the electrolyte interface.
Pouch tabs introduce specific sealing problems during baseline testing. Heavy stack pressure on active areas can pinch the transition zone where tabs exit the laminate. Concentrating force near tab seals degrades the polypropylene sealing layer, risking electrolyte leakage or moisture ingress in sulfide systems.
Fixtures need recessed channels or relief zones around tab exits to prevent over-compressing seal margins under load.
Static fixtures give false baselines if thermal expansion of internal tie rods is ignored during chamber temperature sweeps.

Creep
Long-term dimensional stability involves both reversible breathing and permanent creep. Breathing occurs as lithium shuttles between anode and cathode during normal cycling. Creep accumulates over hundreds of cycles through plastic flow of metallic lithium, crushing of porous carbon networks, and micro-cracking in solid electrolyte particles.
Baseline protocols must isolate cycle-dependent hysteresis from actual irreversible growth.
Thermal drift can easily obscure real thickness changes. Metallic lithium is soft at room temperature, operating at a homologous temperature ratio above 0.65 at twenty-five degrees Celsius. Under stack pressures over two megapascals, it creeps plastically into surface micro-voids, separator pores, and edge clearances.
This initial creep causes zero-state cell thickness to drop slightly during early cycles ~ a process called baseline compaction. Once compaction stops, debris accumulation, SEI growth, and dead lithium accumulation take over, driving gradual cell expansion across long cycle life.
Expansion hysteresis creates a clear thickness difference between charging and discharging. On charge, lithium plates rapidly at the anode interface, causing prompt thickness growth. On discharge, stripping occurs unevenly, forming temporary micro-voids before bulk lithium creeps in to backfill them under pressure.
As a result, a cell at fifty percent state of charge during discharge measures thinner than the same cell at fifty percent state of charge during charge. Any baseline protocol setting nominal dimensions must specify whether the cell reached target state of charge on a charge or discharge sweep.
Baseline hysteresis loops close only after complete discharge to zero state of charge followed by a standardized thermal and mechanical rest period.
Tracking long-term drift requires separating electrochemical swelling from mechanical creep in the pouch materials. Polypropylene and aluminum laminate films slowly relax under continuous spring loads over thousands of hours, and edge seams creep outward under stack pressure. Tracking software has to adjust for load cell drift so pouch relaxation isn’t misread as electrochemical cell growth.
The decision checklist for selecting baseline thickness test specifications requires evaluating five primary mechanical criteria:
- Boundary Condition Class selects constant pressure for cycle-life testing or constant volume to evaluate peak stress limits.
- Pre-Load Magnitudes establish the zero-state reference force to match target module spring constraints.
- Thermal Stabilization Windows set required chamber dwell times before logging baseline displacement readings.
- Hysteresis Mapping Protocols record displacement on both charge and discharge legs at matching state-of-charge points.
- Frame Compliance Deconvolution requires subtracting structural frame calibration curves from raw data before signing off on incoming lots.
Baseline errors carry directly into module design flaws. Engineers use cell baseline numbers to select compression pad spring rates, gap pad ratios, and housing clearances. If initial thickness is under-reported by fifty micrometers, a twenty-cell module stack loses a full millimeter of designed thermal pad gap.
Over-compressing interface materials squeezes out silicone oil, warps cold plates, and creates local pressure spikes that degrade the solid electrolyte prematurely.
Procurement contracts should tie baseline thickness specs to UN 38.3 transport testing and storage conditions. Temperature spikes during transit expand residual pouch gas, changing cell thickness before arrival. A standardized receiving inspection protocol protects buyers from accepting cells distorted by transport conditions.
UN 38.3 clause 38.3.4.3 requires cell dimensions after thermal testing to remain within published tolerances, setting clear thresholds for transport-induced expansion.

Ledger
Baseline measurement protocols mark the commercial interface between cell suppliers and pack integrators. Incoming dimensional checks decide whether a shipment is accepted or rejected. Without clear baseline methods in supply contracts, disputes over dimensional non-compliance are nearly impossible to settle.
Suppliers often report nominal thickness measured under minimal lab pressure, whereas pack integrators test cells under high constraint in module mockups.
Baseline dimensions underpin incoming quality. Creating a binding specification requires detailing every test parameter in engineering drawings: stack force, temperature, humidity, state of charge, dwell time, contact area, and frame compliance formulas. Omitting any of these details allows suppliers to attribute out-of-spec readings to non-standard testing on the buyer’s receiving dock.
Tooling costs climb steeply when baseline tolerances are specified too tight. Demanding plus or minus twenty micrometers on a five-millimeter pouch cell forces suppliers into extreme process control, cleanroom tight-tolerance management, and automated optical sorting. Realistic production tolerances sit closer to plus or minus fifty to seventy-five micrometers.
Integrators need to handle this variance using elastic compliance elements ~ like polyurethane foam pads or Belleville springs ~ inside the module housing.
Swelling warranty claims rely heavily on baseline tracking. Solid-state cells expand over time, and exceeding maximum swell limits specified in warranty agreements obligates suppliers to compensate integrators. However, if an integrator applied stack pressure outside recommended limits or failed to document zero-cycle baseline thickness with certified metrology, the supplier can void the warranty by pointing to improper mechanical clamping.
Specifying zero-state pre-load limits directly in purchase orders protects contracts against unverified supplier claims. Quality protocols must also track alloy thermal expansion across all test channels, since minor pressure variations across different regimes can easily obscure true expansion profiles.
Sourcing teams need to weigh the cost of precision metrology equipment against warranty exposure. High-accuracy LVDT benches, Invar environmental chambers, and closed-loop pneumatic controllers require substantial upfront capital. Skipping these tools leaves integrators open to accepting non-compliant cell lots, raising the risk of module assembly failures, field recalls, and costly warranty disputes.
The commercial question comes down to whether cell manufacturers will standardize baseline reporting on constant-pressure metrology or keep issuing unconstrained numbers that fail to reflect actual cell behavior under module constraints.