Thermal Strain Deconvolution Algorithms for Battery Swelling Characterization Setup
Algorithmic thermal strain deconvolution separates reversible intercalation swelling from core heat expansion to size module end plates and compression gaps accurately.


Swell
Lithium-ion cells alter their physical dimensions during operation through two connected mechanical mechanisms. Reversible volume shifts happen as lithium ions move into and out of crystal lattices within the active cathode and anode materials. At the same time, thermal expansion occurs as Joule heating and reaction entropy raise internal temperatures above ambient.
Separating these two strain components is critical when calculating mechanical stack pressure, designing module enclosures, or tracking internal state of health. A thickness displacement sensor on an operating cell records a signal that combines solid-state phase swelling with volumetric thermal expansion. Extracting pure electrochemical strain means stripping out that thermal expansion artifact.
High charge current densities accelerate temperature accumulation inside dense electrode stacks. Large-format pouch and prismatic cells pose tough thermal management challenges because laminated electrode-separator layers have low cross-plane thermal conductivity, typically 0.5 to 1.2 W/mK. Because of this, surface temperature readings miss internal core temperatures during sharp charge or discharge transients.
Correcting for thermal expansion using only surface thermocouples introduces systematic errors into calculated electrochemical strain, skewing solid-state phase transformation boundaries, hiding lithium plating signatures, and causing pack engineers to miscalculate module end-plate stiffness.

Phase Transitions and Anode Intercalation Mechanics
Graphite anodes expand by roughly 10 percent along the c-axis during complete lithiation from stage 4 to stage 1. Microscopic lattice strain moves through the porous electrode matrix to show up as macro cell thickness growth. Phase transitions inside the graphite follow distinct stoichiometry intervals, each linked to a specific volumetric expansion rate per state-of-charge increment.
Shifts between dilute stage 1C (Li0.08C6) and stage 4C (Li0.16C6) show subtle thickness variations, while the step from stage 2 (Li0.5C6) to stage 1 (LiC6) drives the steepest dimensional change per unit time during charge.
Blending in silicon changes this strain profile entirely. Silicon-graphite composite anodes integrate elemental silicon or silicon suboxide particles to boost gravimetric energy density. Silicon undergoes isotropic volume expansion exceeding 300 percent upon full lithiation to Li22Si5 or Li15Si4 phases.
Even modest blending ratios of 5 to 10 weight percent double or triple total cell thickness change across a full state-of-charge sweep. Unlike the discrete steps seen in pure graphite, silicon lithiation creates continuous, non-linear expansion profiles marked by heavy mechanical hysteresis between charge and discharge.
| Material System | Theoretical Volume Expansion (%) | Linear Thickness Strain at 100% SOC (%) | Volumetric Thermal Coefficient (1/K) | Dominant Phase Transition Mechanism |
|---|---|---|---|---|
| Pure Synthetic Graphite | 10.2 | 1.8 to 2.4 | 3.2 × 10⁻⁵ | C-axis lattice expansion via stage transitions |
| Silicon-Graphite (5 wt% Si) | 24.5 | 3.5 to 4.8 | 3.8 × 10⁻⁵ | Particle volume increase plus graphite lithiation |
| Silicon-Graphite (10 wt% Si) | 42.0 | 6.2 to 8.5 | 4.4 × 10⁻⁵ | Non-linear amorphous alloy phase generation |
| NMC811 Cathode | -2.1 to -8.2 | -0.6 to -1.2 | 2.8 × 10⁻⁵ | C-axis contraction at high state-of-charge |
| LFP Cathode | -6.8 | -0.4 to -0.8 | 2.2 × 10⁻⁵ | Two-phase biphasic transformation (FePO4 to LiFePO4) |
Cathodes move in the opposite direction during cycling. Nickel-rich layered oxides like NMC811 contract along the c-axis when delithiated beyond 75 percent state-of-charge, driven by electrostatic repulsion between adjacent oxygen layers as screening lithium ions leave. That contraction partially offsets anode expansion near full charge.
Lithium iron phosphate undergoes a two-phase transformation between LiFePO4 and FePO4 with a lattice volume change of roughly 6.8 percent, maintaining a flat profile across most of the state-of-charge range. Net cell swelling is the linear sum of these opposing electrode shifts, modified by separator compression and internal gas pressure.
Volumetric Thermal Expansion Coefficients in Stacked Layers
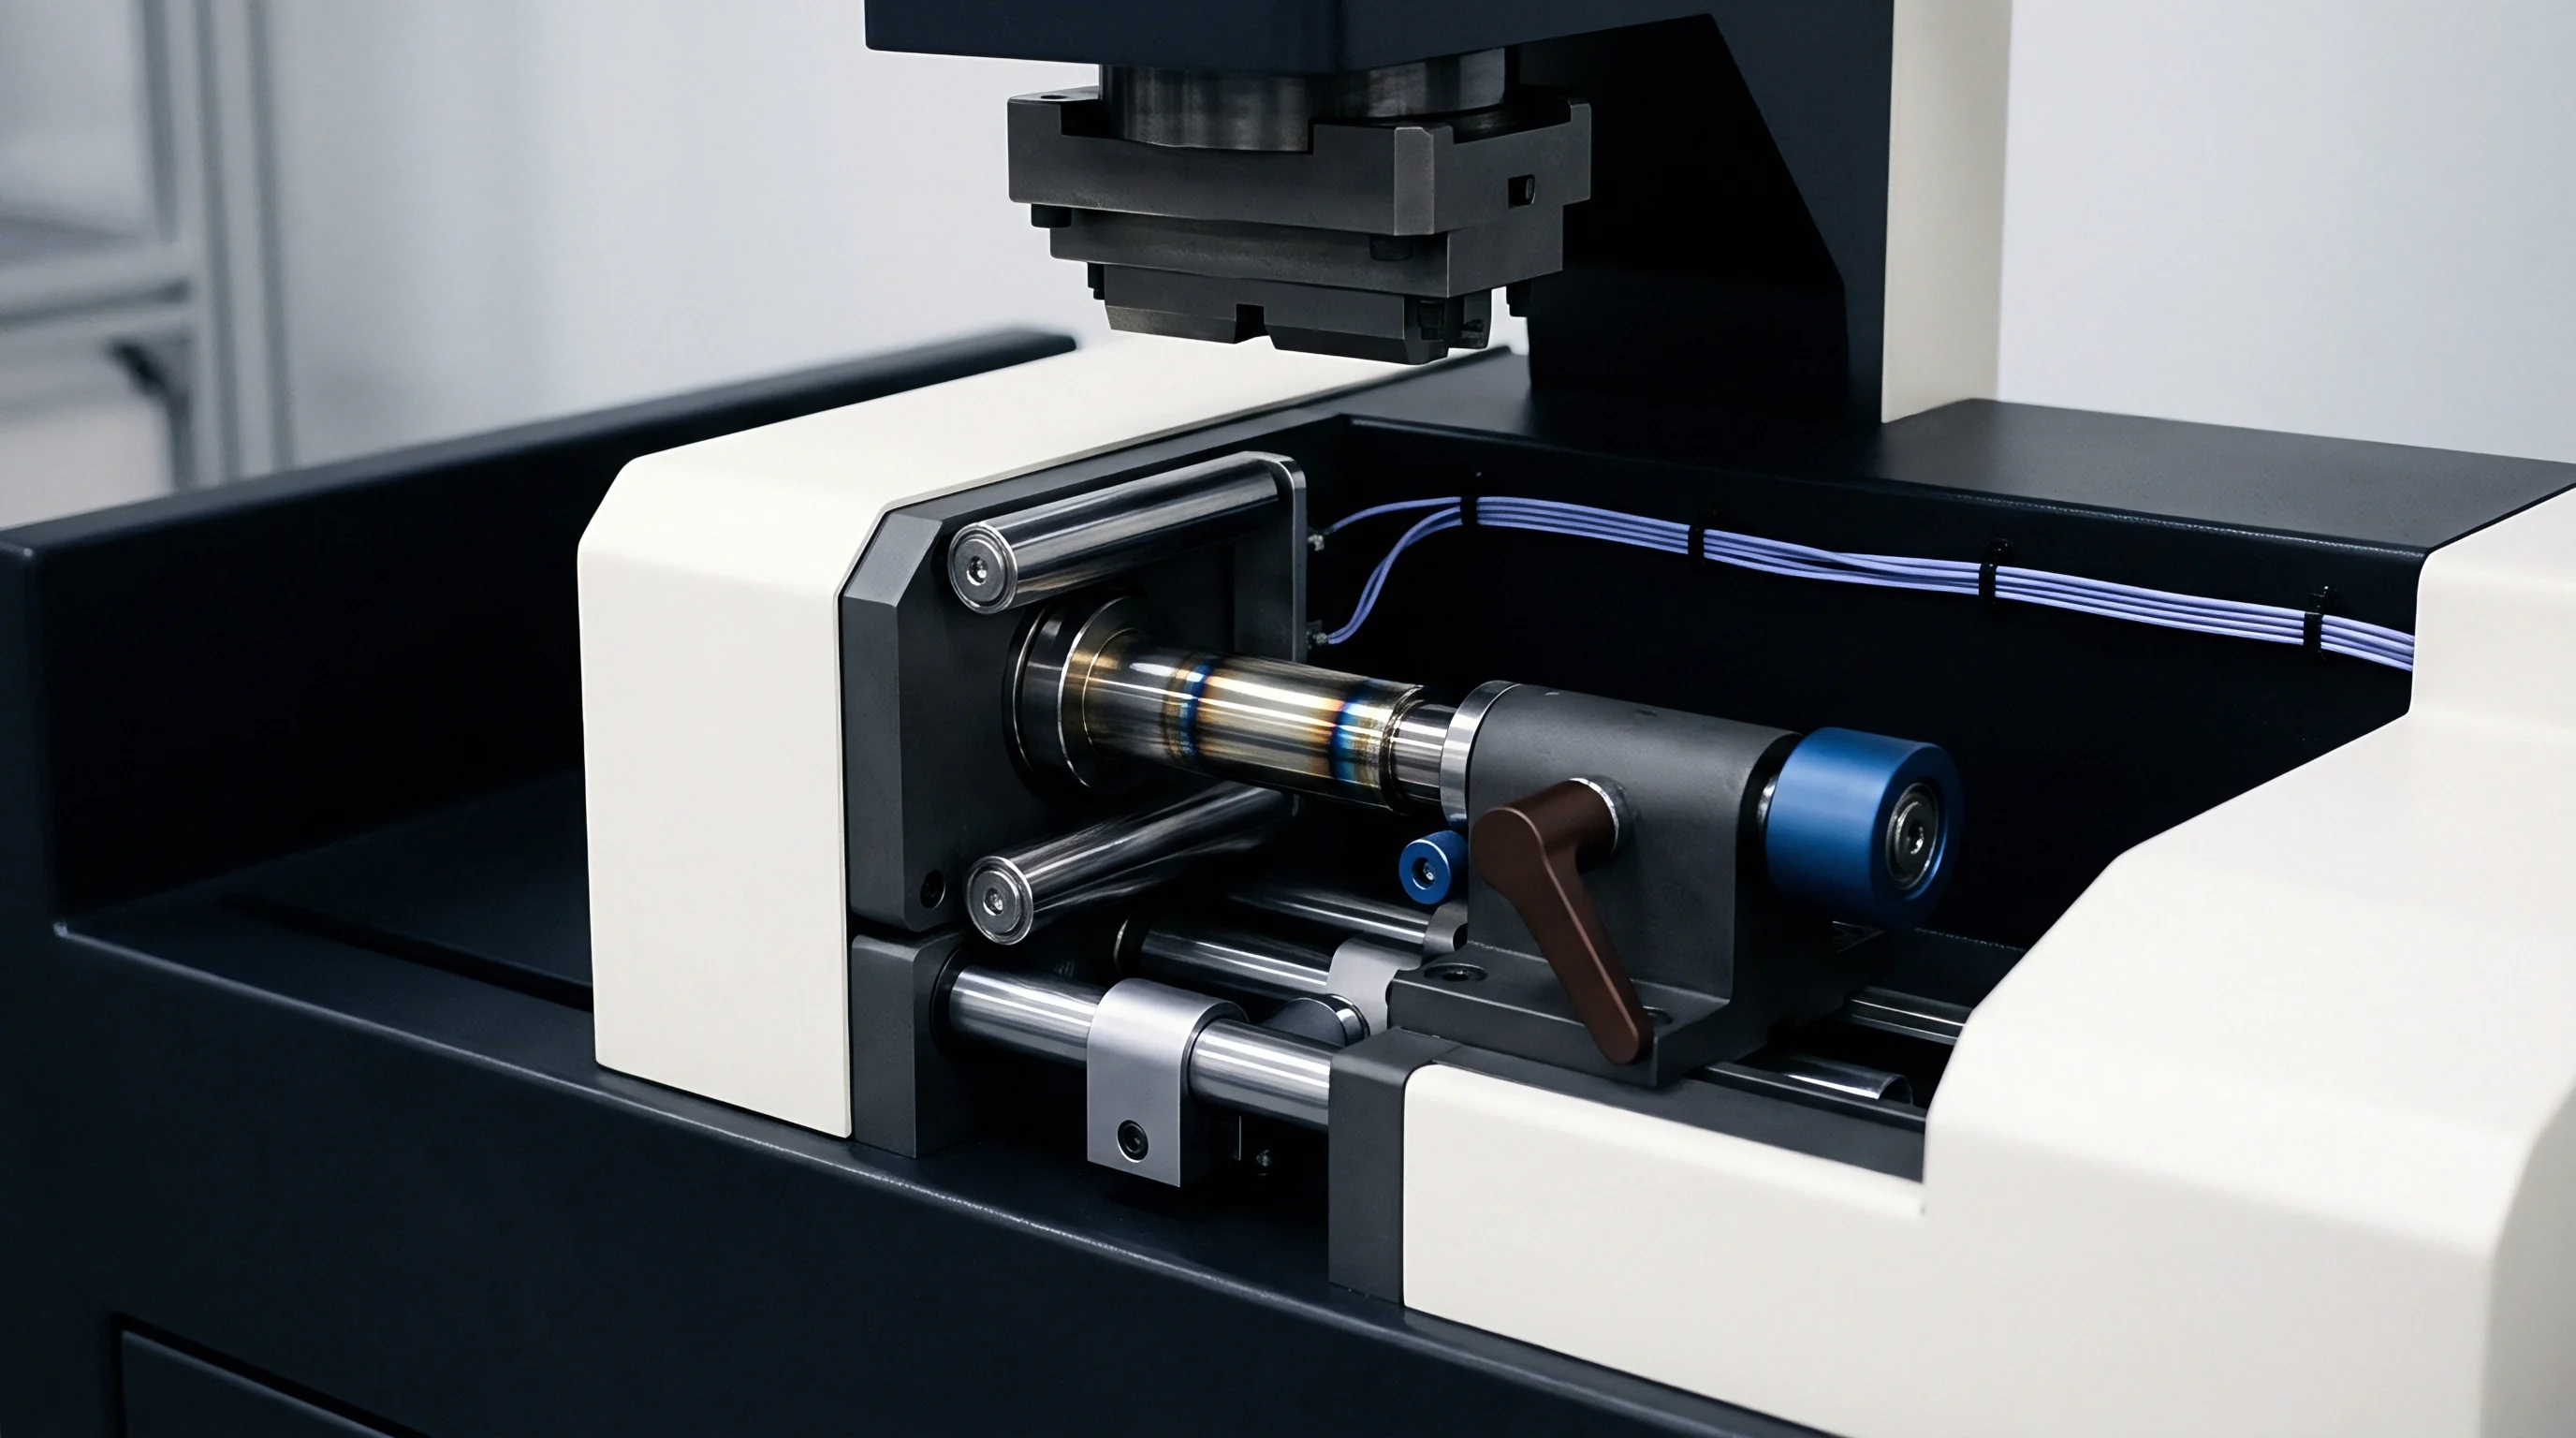
Temperature changes drive localized expansion dictated by anisotropic thermal expansion tensors. A commercial pouch cell contains distinct layers: aluminum current collectors, porous cathode coatings, polymeric separators, porous anode coatings, copper collectors, and an outer aluminum-laminated foil pouch. Each material has its own thermal expansion coefficient.
Copper sits near 16.5 × 10⁻⁶ /K, aluminum at 23.1 × 10⁻⁶ /K, and polyethylene or polypropylene separators show in-plane coefficients between 80 × 10⁻⁶ and 120 × 10⁻⁶ /K.
Cross-plane thermal expansion in the stack behaves very differently from in-plane expansion, as it incorporates layer interfaces, liquid electrolyte films, and porous polymeric membranes. Saturated porous structures show effective cross-plane thermal expansion coefficients from 1.5 × 10⁻⁴ /K to 3.5 × 10⁻⁴ /K, depending on electrolyte formulation, salt concentration, and mechanical constraint. Measuring cross-plane strain requires separating pore-network structural compliance from solid-phase volumetric thermal expansion.
Silicon-graphite anode blends containing 10 percent active silicon exhibit non-linear lattice volume strain exceeding 18 percent at full lithiation.
Thermal expansion coefficients change continuously with state-of-charge. As lithium ions fill interstitial sites in host lattices, elastic moduli and thermal vibrational modes shift. Lithiated graphite (LiC6) has a higher elastic modulus and a lower cross-plane thermal expansion coefficient than delithiated graphite (C6).
Ignoring this state-of-charge dependence introduces systematic errors during thermal strain deconvolution ~ errors that scale directly with temperature spikes during fast charging.
Thermal Gradients across Large Format Pouches
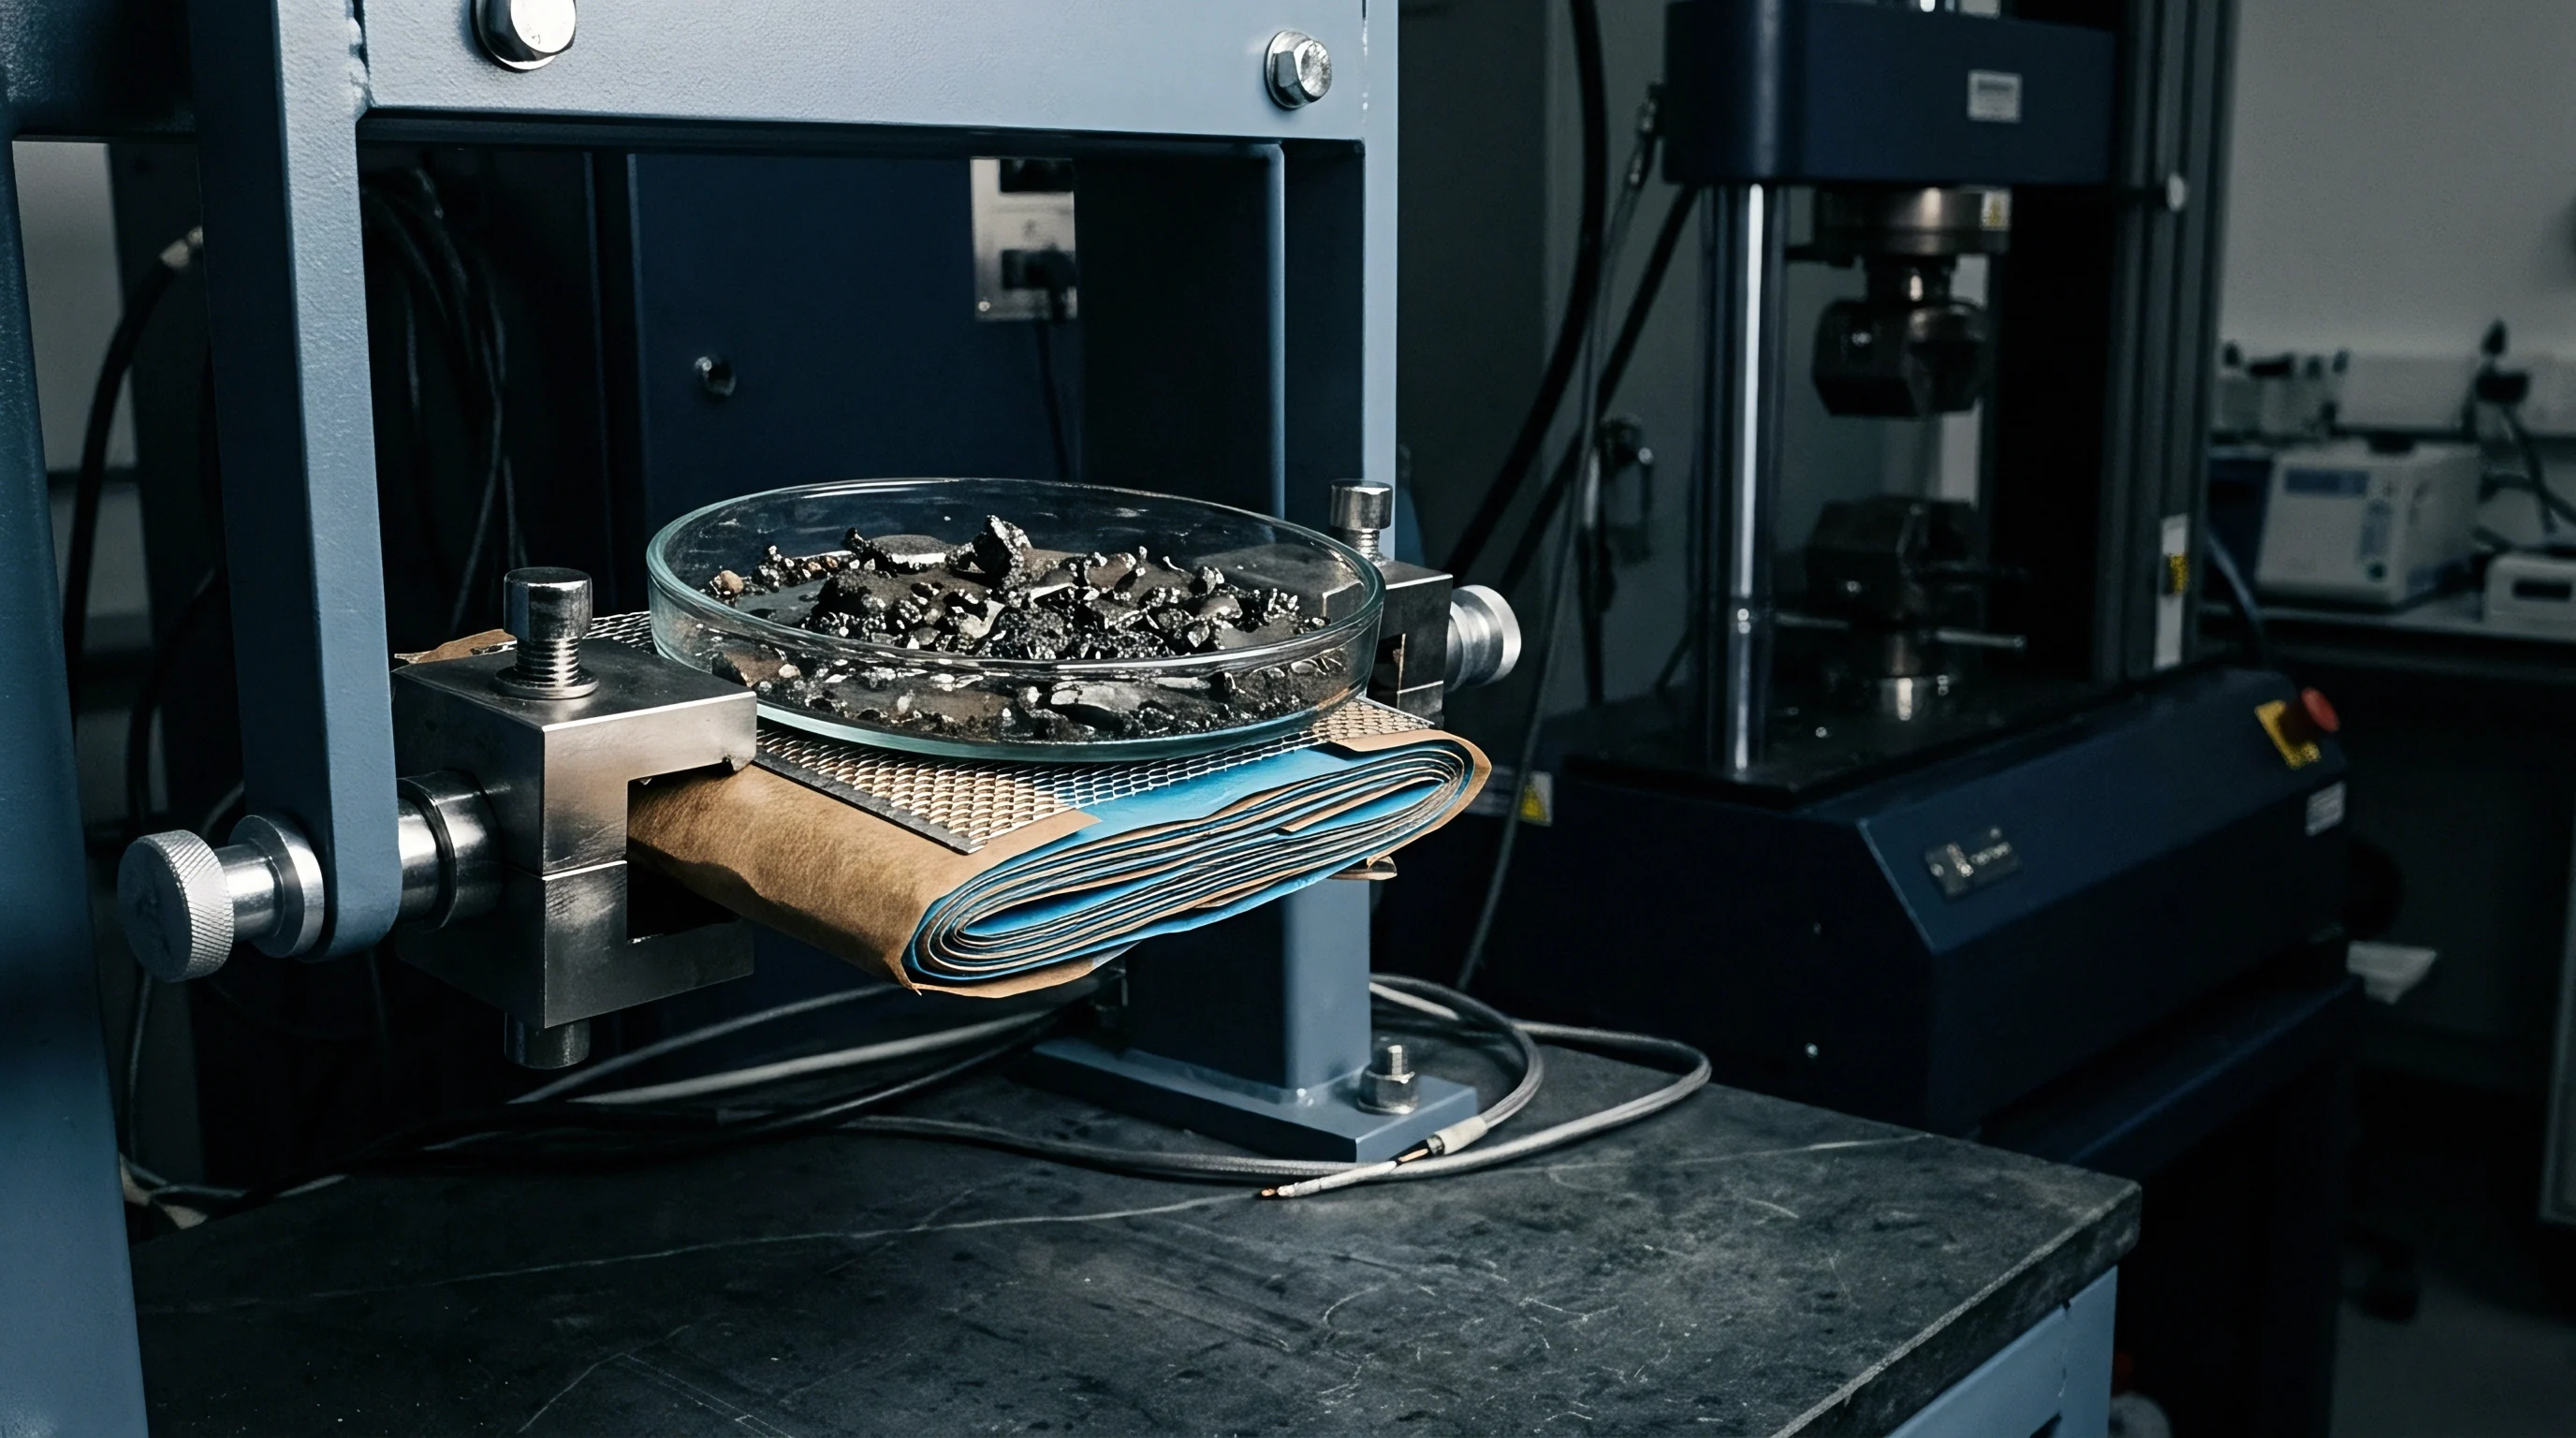
High charge rates build up interior heat faster than exterior surfaces can shed it. Large prismatic and pouch cells develop internal thermal gradients over 12 °C between the geometric core and external aluminum cold plates during a 2C continuous discharge. Cross-plane thermal conductivity stays low compared to in-plane conductivity (20 to 30 W/mK), which benefits from continuous metallic current collectors.
Heat generated in the core escapes mostly through tab contacts or broad face cooling surfaces, setting up complex 3D temperature fields.
Non-uniform temperature fields cause uneven thermal expansion across the cell face. The hot geometric core expands more in the cross-plane direction than cooler edges. In rigid or semi-rigid fixtures, that localized expansion spikes contact pressure near the center of the cell.
These stress concentrations accelerate mechanical degradation, close separator pores, and promote lithium plating in high-pressure zones. Simple surface-mounted displacement sensors measure only point or area-averaged movement, missing sharp local thermal expansion peaks deep inside the electrode stack.
Calculating electrochemical swelling under dynamic loads requires accurate real-time core temperatures. Depending solely on surface temperature measurements undercounts thermal expansion during high-power pulses, causing missing expansion to register in raw displacement signals as dynamic electrochemical swelling, distorting incremental capacity curves, and throwing off state-of-charge estimators during thermal transients.
Mistaking thermal expansion for electrochemical swelling during high C-rate testing leads engineers to specify overly soft module compression pads. That allows structural gapping, accelerates mechanical fatigue, and cuts operational pack life by up to 35 percent.


Rig
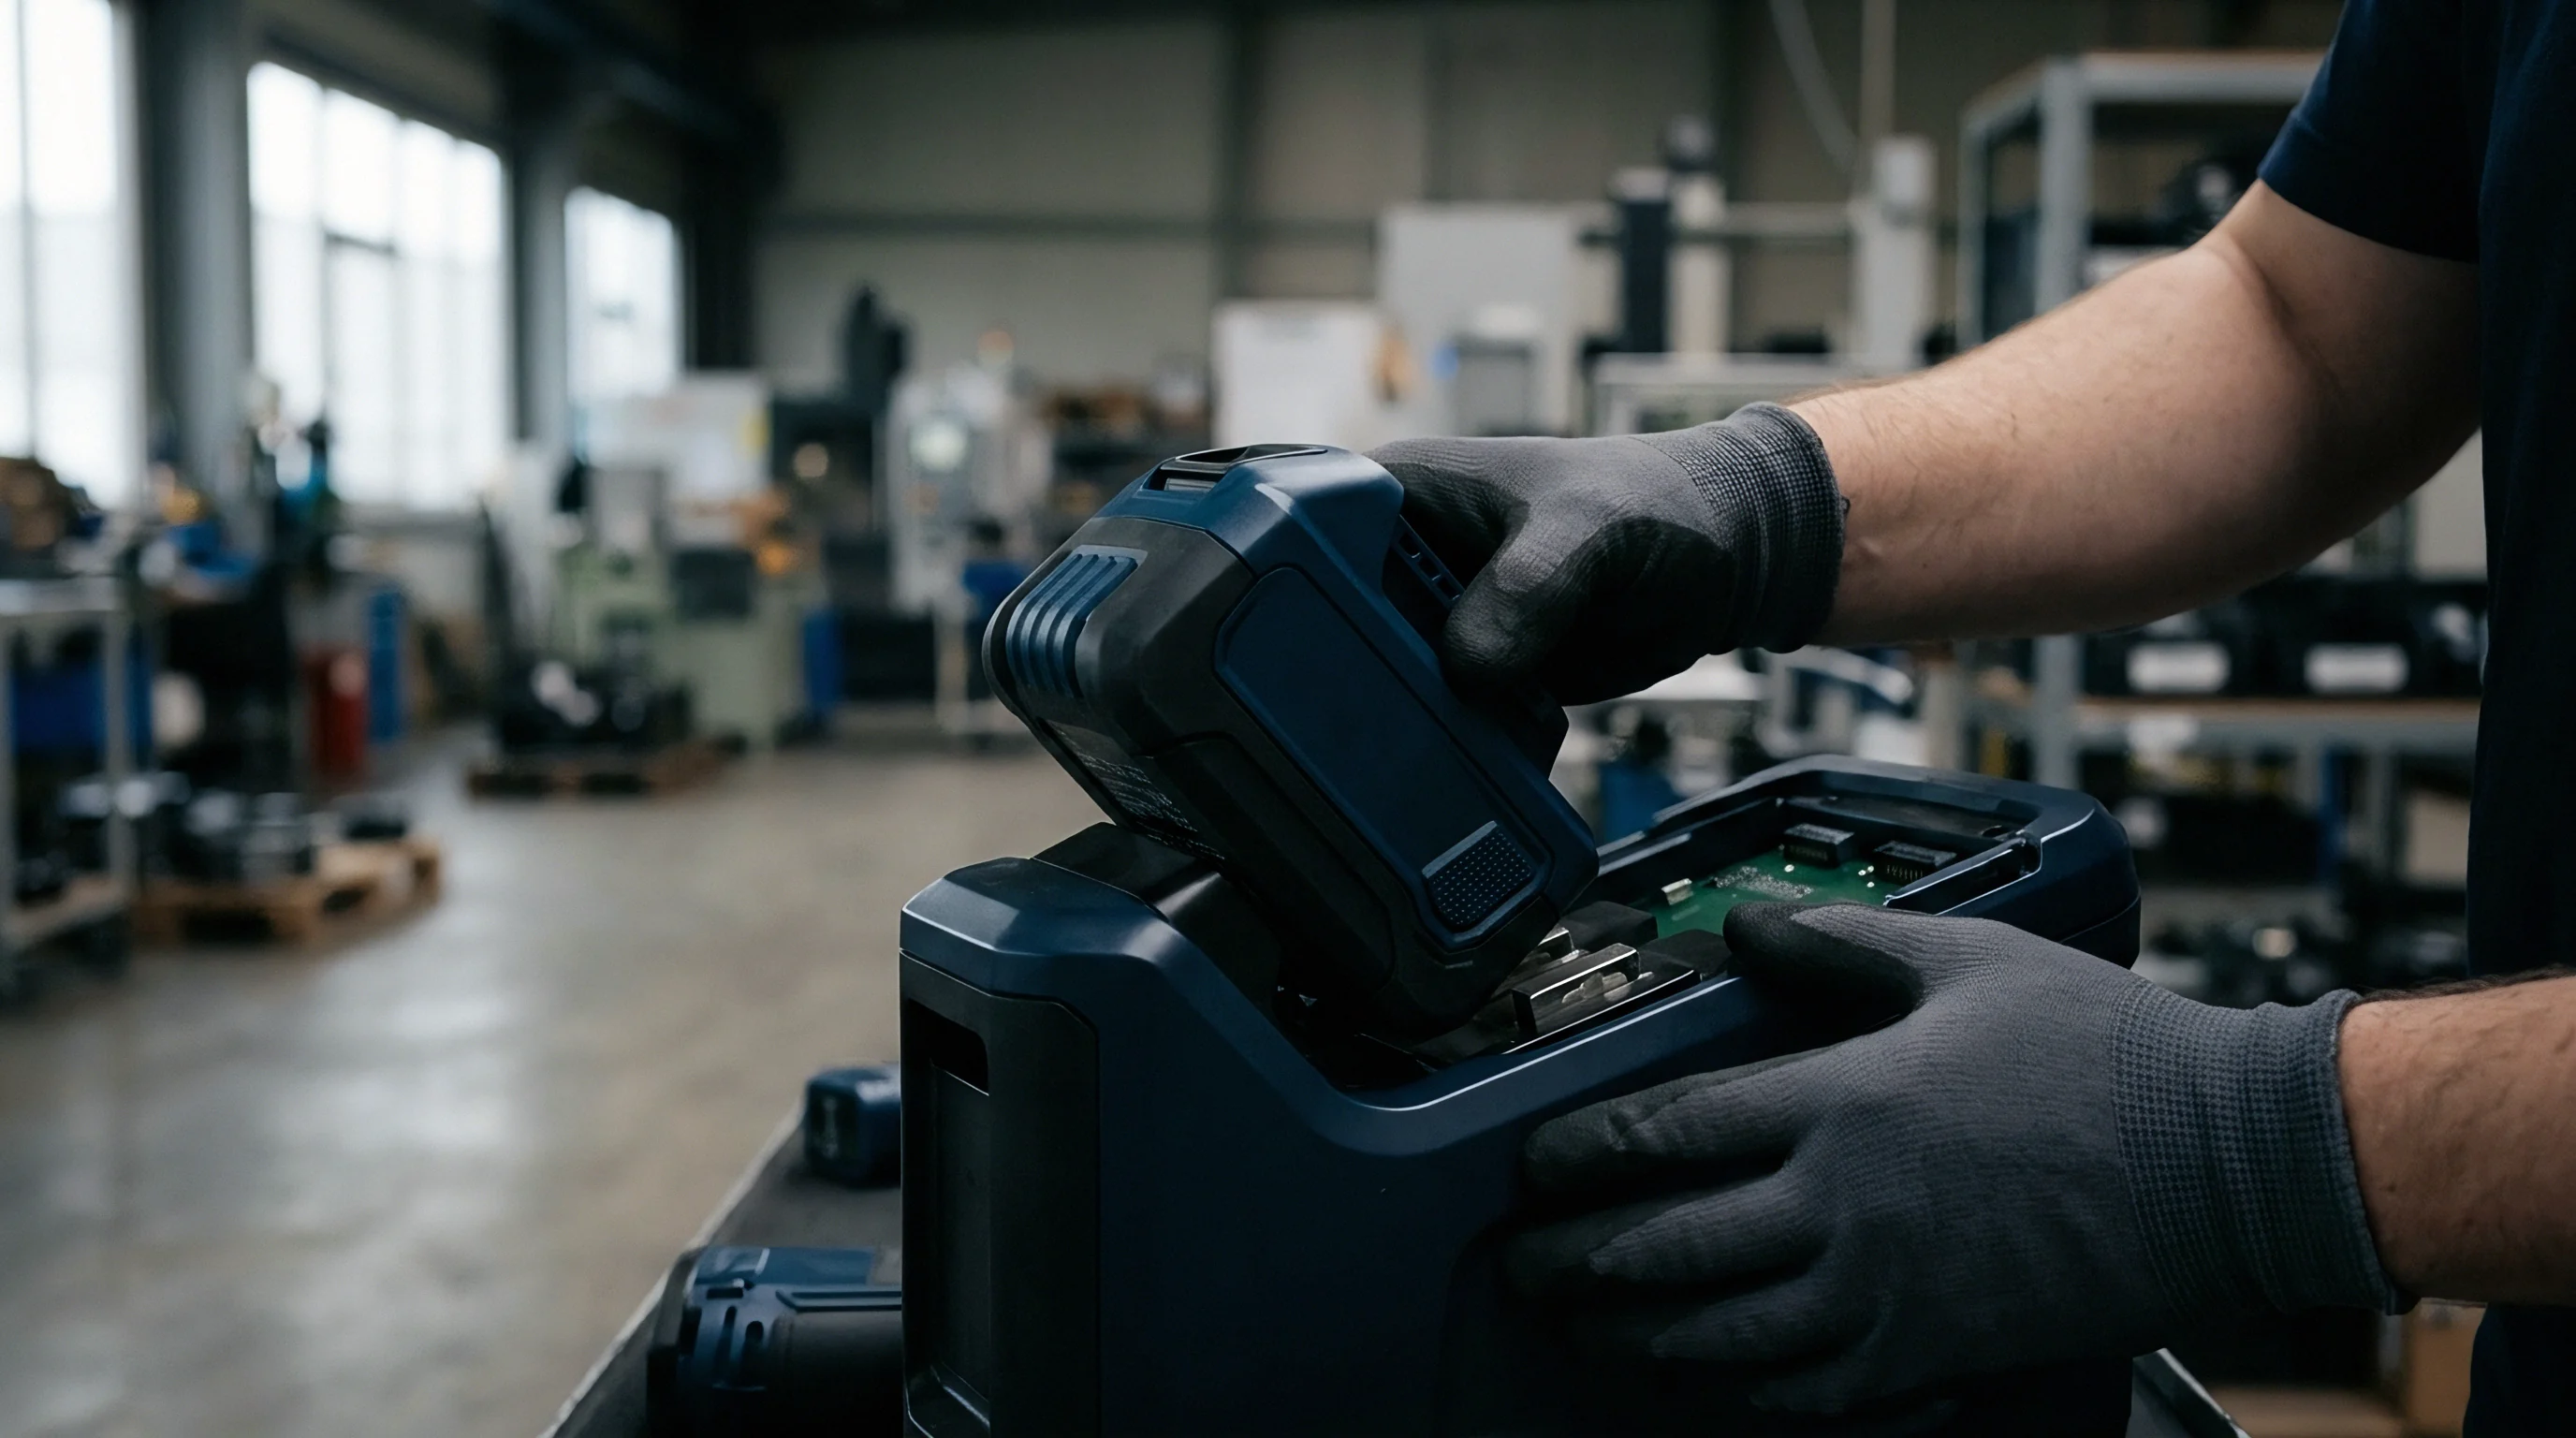
Isolating pure electrochemical expansion requires test conditions that cleanly separate mechanical strain from thermal movement. Standard laboratory displacement rigs often introduce parasitic compliance and unwanted thermal expansion vectors into raw data. A high-fidelity swelling rig tightly controls mechanical pre-load, fixture expansion, ambient temperature, and boundary heat transfer.
The system must hit sub-0.1 micrometer displacement resolution while holding clamping forces up to 10 kilonewtons across broad temperature sweeps.
Thermal drift in the test rig is a main source of experimental noise. As a cell heats up during high-rate cycling, radiation, convection, and conduction warm the structural frame, load sensors, and mounting brackets. If mounting arms expand during a run, sensors pick up false displacement artifacts that corrupt strain data.
Isolating sensor mounts with low-expansion materials like Invar-36 or Zerodur glass-ceramics prevents frame distortion.

Load Frame Compliance and Actuator Dynamics
Test frames deflect under applied pre-loads. A rig running in constant-displacement mode assumes infinite frame stiffness to hold boundaries stationary, but physical load frames have finite stiffness between 50 and 500 kilonewtons per millimeter. When an expanding cell pushes against a real frame, the frame deforms elastically, allowing partial thickness growth while raising compressive force.
Interpreting load cell outputs requires dynamic compliance calibration matrices to separate true cell strain from fixture deformation.
Constant-pressure setups face the opposite challenge. Electric servo-actuators or pneumatic force loops hold target compressive stress (typically 0.3 to 1.0 MPa) across cell faces as dimensions shift. Actuator bandwidth must outpace cell volume changes during fast thermal or electrochemical events.
Actuator lag creates transient pressure spikes during fast-charge pulses, applying artificial compression that distorts swelling measurements. Control loops need to keep target pressures within 2 kilopascals even during maximum C-rate transients.

Sensor Modalities for Sub-Micron Displacement Tracking
Displacement sensors need active thermal compensation to maintain sub-micron precision across ambient temperature sweeps. Choosing transducers means trading off spatial resolution, noise immunity, temperature coefficients, and multi-point tracking. Several common failure modes compromise data integrity in battery strain setups:
- Thermal frame drift creates uncompensated displacement offsets as structural mounting arms expand during high-rate discharge tests.
- Bending moment cross-talk distorts load cell force readings when uneven swelling places off-axis loads on single-axis sensors.
- Contact pressure relaxation occurs as elastic interface foams degrade under repeated thermo-mechanical cycling.
- Sensor core heating shifts magnetic permeability in LVDT internal coils, drifting calibration factors over long tests.
- Optical refractive variations disrupt laser triangulation readings when hot air convection creates density gradients along optical light paths.
Linear Variable Differential Transformers (LVDTs) deliver strong linearity and sub-micron resolution. Hermetically sealed LVDTs with low temperature-coefficient coils hold signal stability inside environmental chambers. Contact-free options ~ like optical laser triangulation and 3D Digital Image Correlation (DIC) ~ eliminate mechanical probe feedback entirely.
DIC uses stereoscopic cameras to track speckle patterns on cell edges or pouch surfaces, capturing full-field out-of-plane and in-plane displacement maps simultaneously.
| Sensing Technology | Measurement Resolution (µm) | Thermal Sensitivity (% FS/°C) | Spatial Capability | Primary Experimental Artefact |
|---|---|---|---|---|
| Contact LVDT | 0.05 | 0.005 | Single point contact | Probe spring force variation under deflection |
| Laser Triangulation | 0.10 | 0.012 | Single point / multi-point line | Refractive index shifts from air convection currents |
| 3D Digital Image Correlation | 0.50 | 0.002 | Full-field 3D surface map | Speckle pattern degradation at elevated temperatures |
| Fiber Bragg Grating (FBG) | 0.01 | 0.008 | Multi-point embedded array | Thermal-strain strain-temperature cross-sensitivity |
| Capacitive Displacement | 0.005 | 0.020 | Single point contact-free | Dielectric constant shifts with humidity variations |
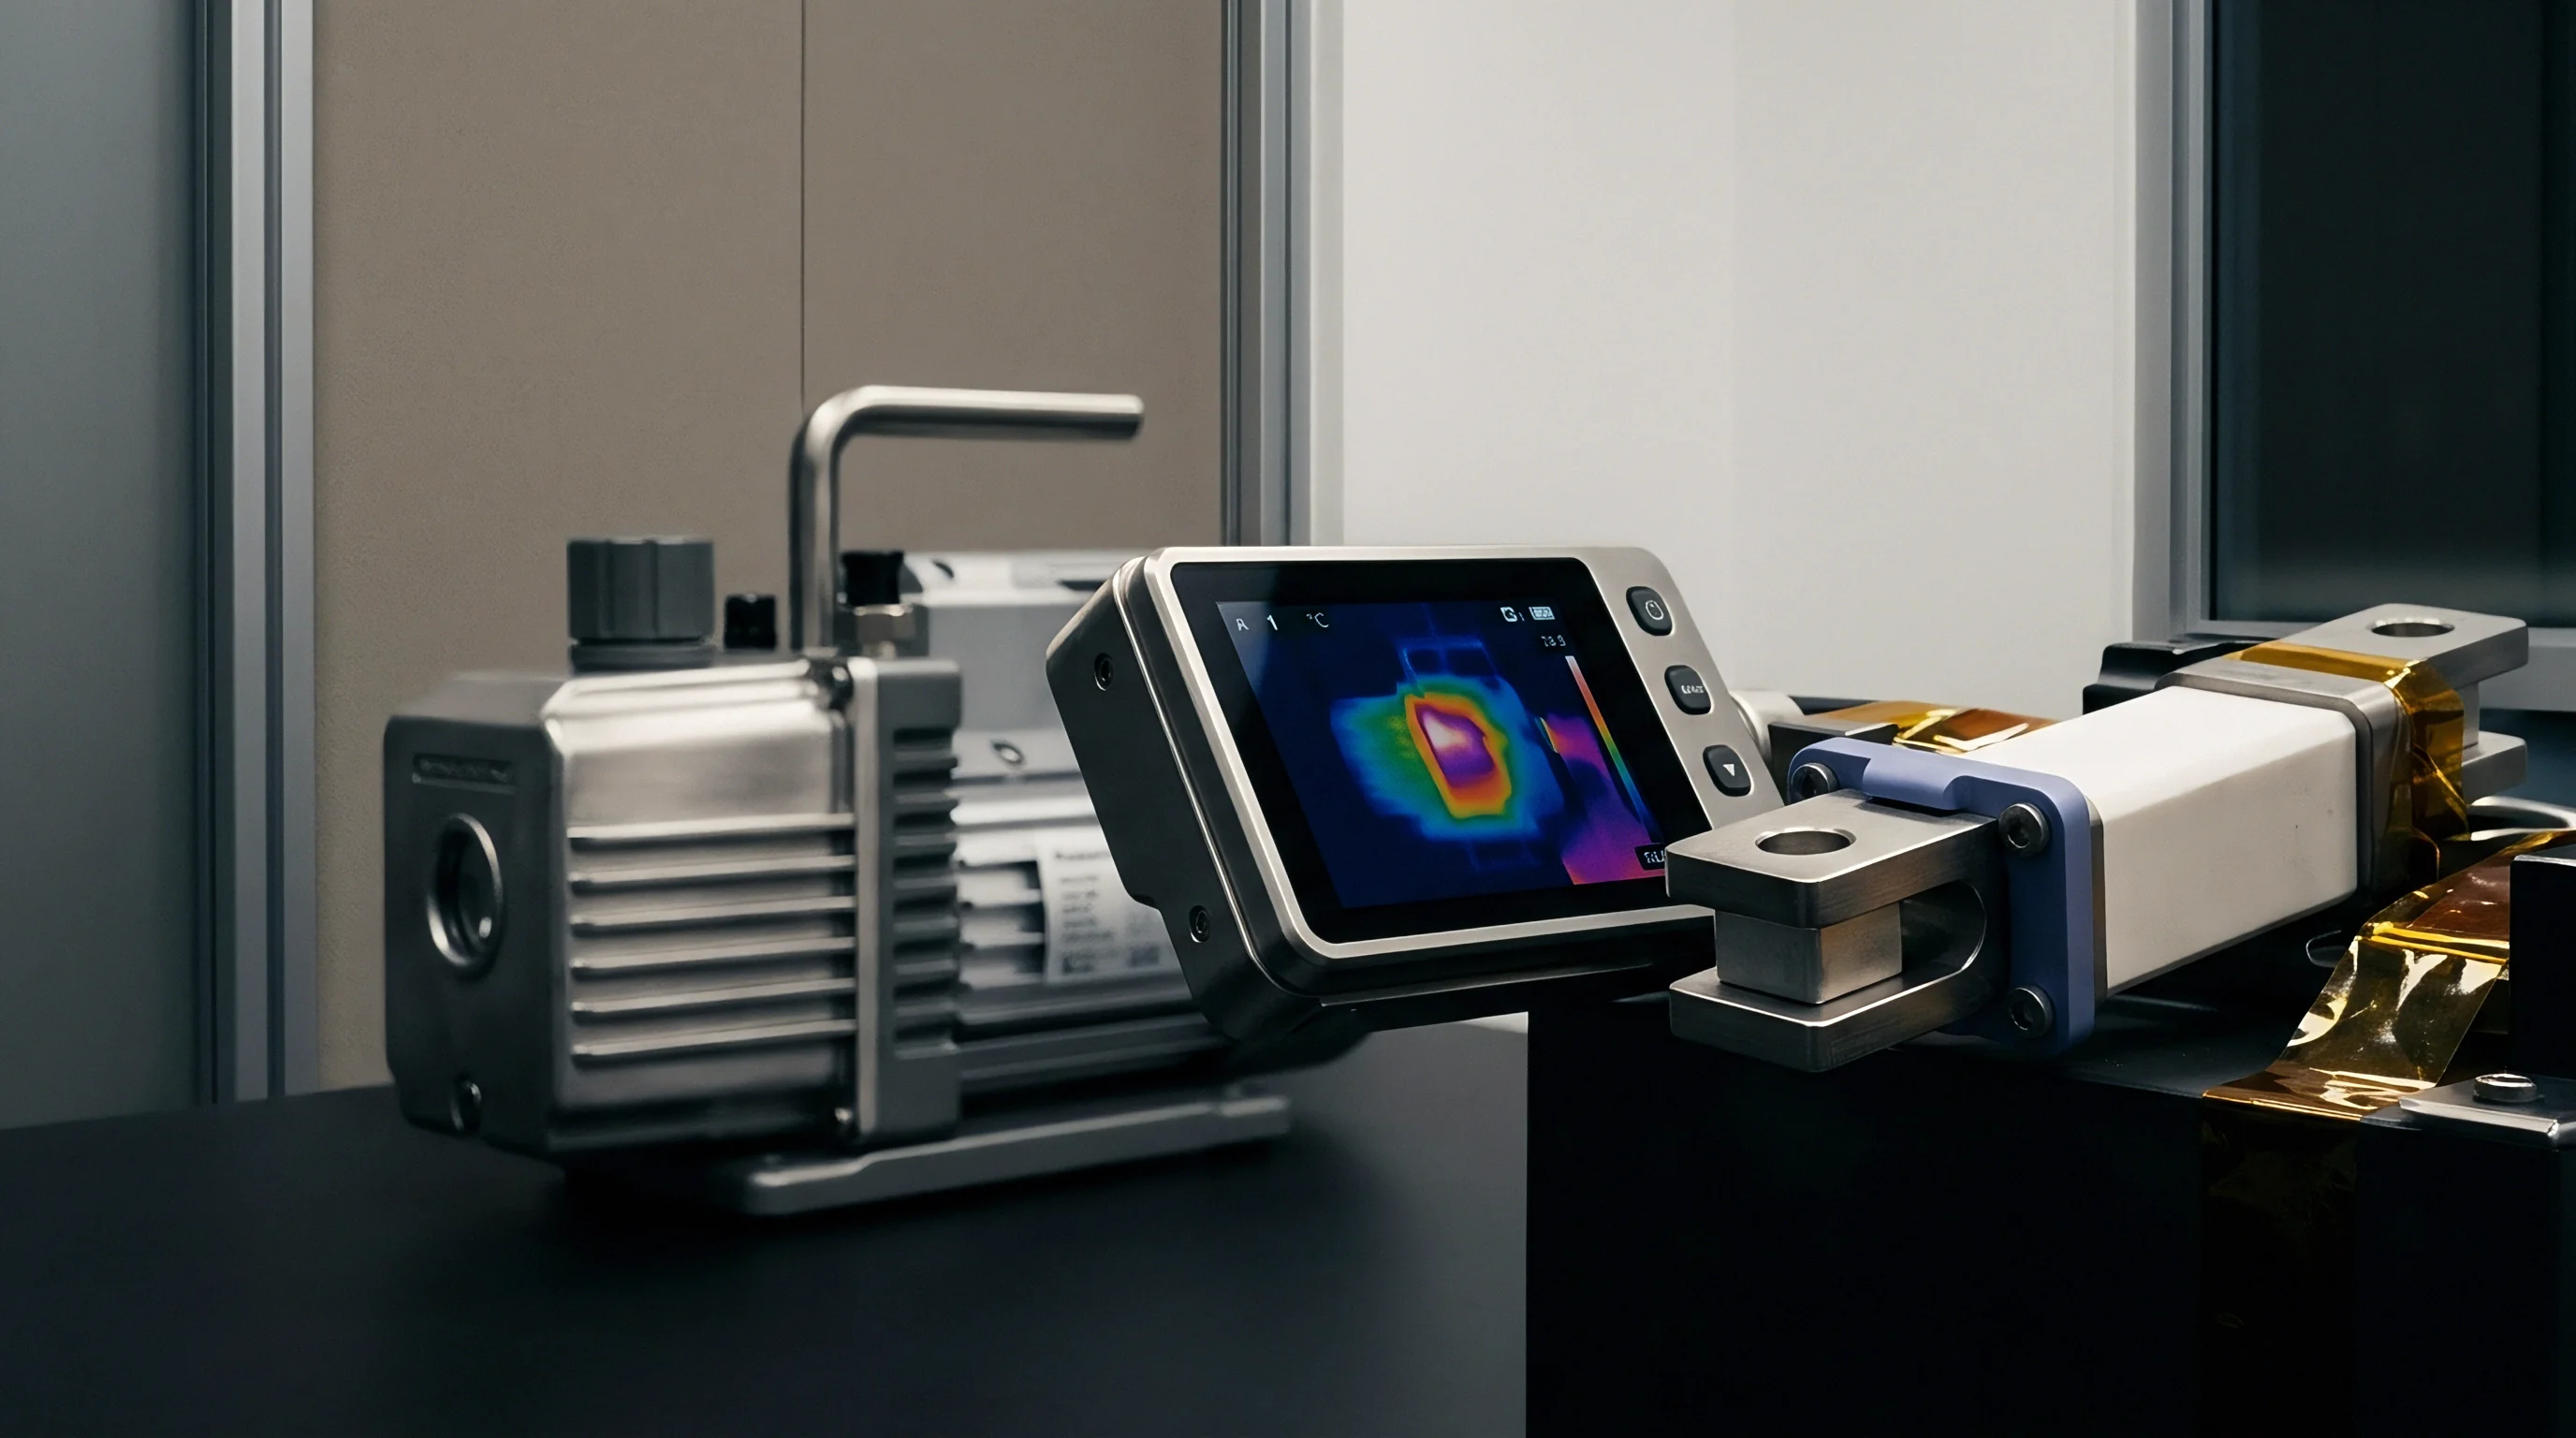
Placing thin-film heat flux sensors alongside displacement transducers provides the boundary data needed for algorithmic deconvolution. Surface-mounted resistance temperature detectors (RTDs) arrayed across cell faces map spatial temperature distributions. Thermocouples embedded in heat sink plates confirm thermal boundary conditions, letting transfer matrix algorithms model internal core temperatures accurately.
Non-linear strain steps observed during qualification trials are frequently attributed to fixture compliance and sensor frame expansion rather than internal electrode delamination.
Matrix
Deconvolution models view measured total displacement as a dynamic superposition of thermal expansion and electrochemical phase expansion. Total cross-plane strain is simply the sum of electrochemical intercalation strain and volumetric thermal strain. Formulated in continuous time, thermal strain maps to the spatial temperature field multiplied by the differential thermal expansion tensor.
Discretizing the model over sampling intervals turns these physical heat transport equations into linear algebraic systems ready for numerical inversion.
Calculating thermal strain depends on reconstructed core temperature fields. Direct core measurement during normal cell operation is impractical without breaching cell seals or inserting micro-thermocouples that create stress concentrations. Instead, deconvolution algorithms solve the 1D or 3D heat conduction equation across the electrode stack, using surface heat flux and surface temperature streams as dynamic boundary inputs.
The resulting core temperature matrix feeds directly into thermal expansion models.

Transient Heat Conduction and Thermal Transfer Functions
Core temperature profiles inside thick prismatic cells cannot be captured directly with surface sensors. Heat generated inside the electrode stack combines Ohmic resistance, reaction entropy, charge-transfer overpotential losses, and enthalpy shifts from phase transformations. Modeling cross-plane heat diffusion requires solving the partial differential equation governing internal heat generation and transport across anisotropic layers.
A continuous 1D thermal model along the cross-plane axis z is expressed as:
rho · C_p · (partial T / partial t) = k_z · (partial² T / partial z²) + q_gen(t)
where rho represents the average mass density of the cell, C_p is the effective heat capacity, k_z denotes cross-plane thermal conductivity, and q_gen(t) represents volumetric heat generation rate. Transforming this differential equation into the frequency domain yields a thermal transfer function H(s) that relates surface heat fluxes and surface temperatures to internal core temperatures T_core(t).
Discretizing the core temperature response into discrete time steps allows convolution modeling. The thermal displacement contribution u_th(t) at time step k is represented by the matrix-vector multiplication:
u_th(k) = sum from j=1 to k of
where alpha_th(SOC) represents the state-of-charge dependent cross-plane thermal expansion coefficient, L_0 is the initial unconstrained cell thickness, and H_temp denotes the discretized thermal impulse response matrix of the test system.

Which Regularization Parameter Stabilizes Inverse Thermal Transfer Matrixes?
Inverting discretized thermal response convolution equations suffers from ill-posedness when high-frequency noise enters sensor channels. Reconstructing internal thermal strain requires inverting lower-triangular thermal convolution matrices. Small high-frequency noise spikes in LVDT or laser channels amplify during direct inversion, producing unphysical oscillations in calculated electrochemical strain.
Tikhonov regularization stabilizes inverse thermal transfer calculations by imposing a penalty on solution variance. The regularized optimization problem seeks to minimize the residual norm combined with a weighted side constraint norm:
min || A · x – b ||₂² + lambda² · || L · x ||₂²
where A represents the system thermal transfer convolution matrix, x represents the unknown unmixed electrochemical strain vector, b contains raw measured total displacement signals, L is a discrete spatial derivative operator matrix (often the first or second-difference operator), and lambda denotes the Tikhonov regularization parameter.
Choosing the regularization parameter lambda dictates deconvolution accuracy. If lambda is too large, the reconstructed strain profile gets over-smoothed, blurring real electrochemical phase transition signatures. If lambda is too small, sensor noise passes through and destabilizes the solution.
The L-curve criterion plots the log-log trade-off between the residual norm and the solution norm, pinpointing the corner of maximum curvature where noise suppression peaks without wiping out real strain steps.

Recursive Filtering for Real-Time Strain Separation
Dynamic state estimation processes voltage, current, and surface displacement streams simultaneously. While offline algorithms work through complete datasets after a test run, embedded battery management systems need real-time deconvolution during vehicle or storage operation. Extended Kalman Filters (EKF) and Recursive Least Squares (RLS) estimators use reduced-order thermal-mechanical cell models to separate strain components live on microcontrollers.
An Extended Kalman Filter tracking electrochemical strain maintains a dual-state vector for core temperature T_core and lithiation displacement u_ec. At each step, the filter updates its core temperature estimate from surface sensors, predicts the thermal expansion increment, subtracts that from raw displacement measurements, and adjusts the estimated state-of-charge and mechanical strain.
- Initialize Filter States set core temperature, state-of-charge, electrochemical displacement, and error covariance matrices based on ambient bench equilibrium.
- Predict State Transitions propagate the discrete state model forward using current, surface temperature, and heat flux inputs to forecast core temperature evolution.
- Calculate Thermal Strain Increment compute expected thermal volume expansion by multiplying the updated core temperature delta by the state-of-charge-dependent cross-plane thermal coefficient.
- Compute Innovation Residual subtract calculated thermal displacement and predicted electrochemical strain from the raw physical displacement measurement.
- Update Kalman Gain Matrix weigh measurement noise covariance against state prediction uncertainties to set feedback gains.
- Correct State Vector apply feedback gains to update state-of-charge, core temperature distribution, and isolated electrochemical strain estimates.
IEC 62660-2 testing protocols state that total dimensional deflection during continuous discharge shall not distort module constraint structures beyond 0.5 millimeter.
Evaluating high-nickel pouch cells under thermal transients demonstrates filter convergence dynamics. The state estimator decoupled thermal strain within 450 milliseconds of a step thermal load change, preserving fast electrochemical phase transitions while filtering out surface thermal expansion artifacts.
What remains unresolved is whether recursive deconvolution can maintain spatial separation accuracy when localized silicon degradation causes asymmetric swelling under uneven module clamping.


Proof
Validating deconvolution algorithms requires empirical data gathered under controlled electrical and thermal loads. A commercial 100 Ah NMC811/graphite pouch cell with a nominal unconstrained thickness of 11.85 millimeters was evaluated in an isothermal load frame. Instrumentation included four LVDTs at the cell quadrants, eight thin-film surface RTDs, two heat flux sensors, and a load cell tracking total constraint force.
The cell underwent a 2C fast charge from 0 to 100 percent state-of-charge inside a chamber held at 25.0 °C, with air velocity regulated to maintain a constant convective transfer coefficient. Total measured displacement reached 342 micrometers at full charge. Surface temperature climbed from 25.0 °C to 38.6 °C during the charge event, establishing clear internal thermal gradients.
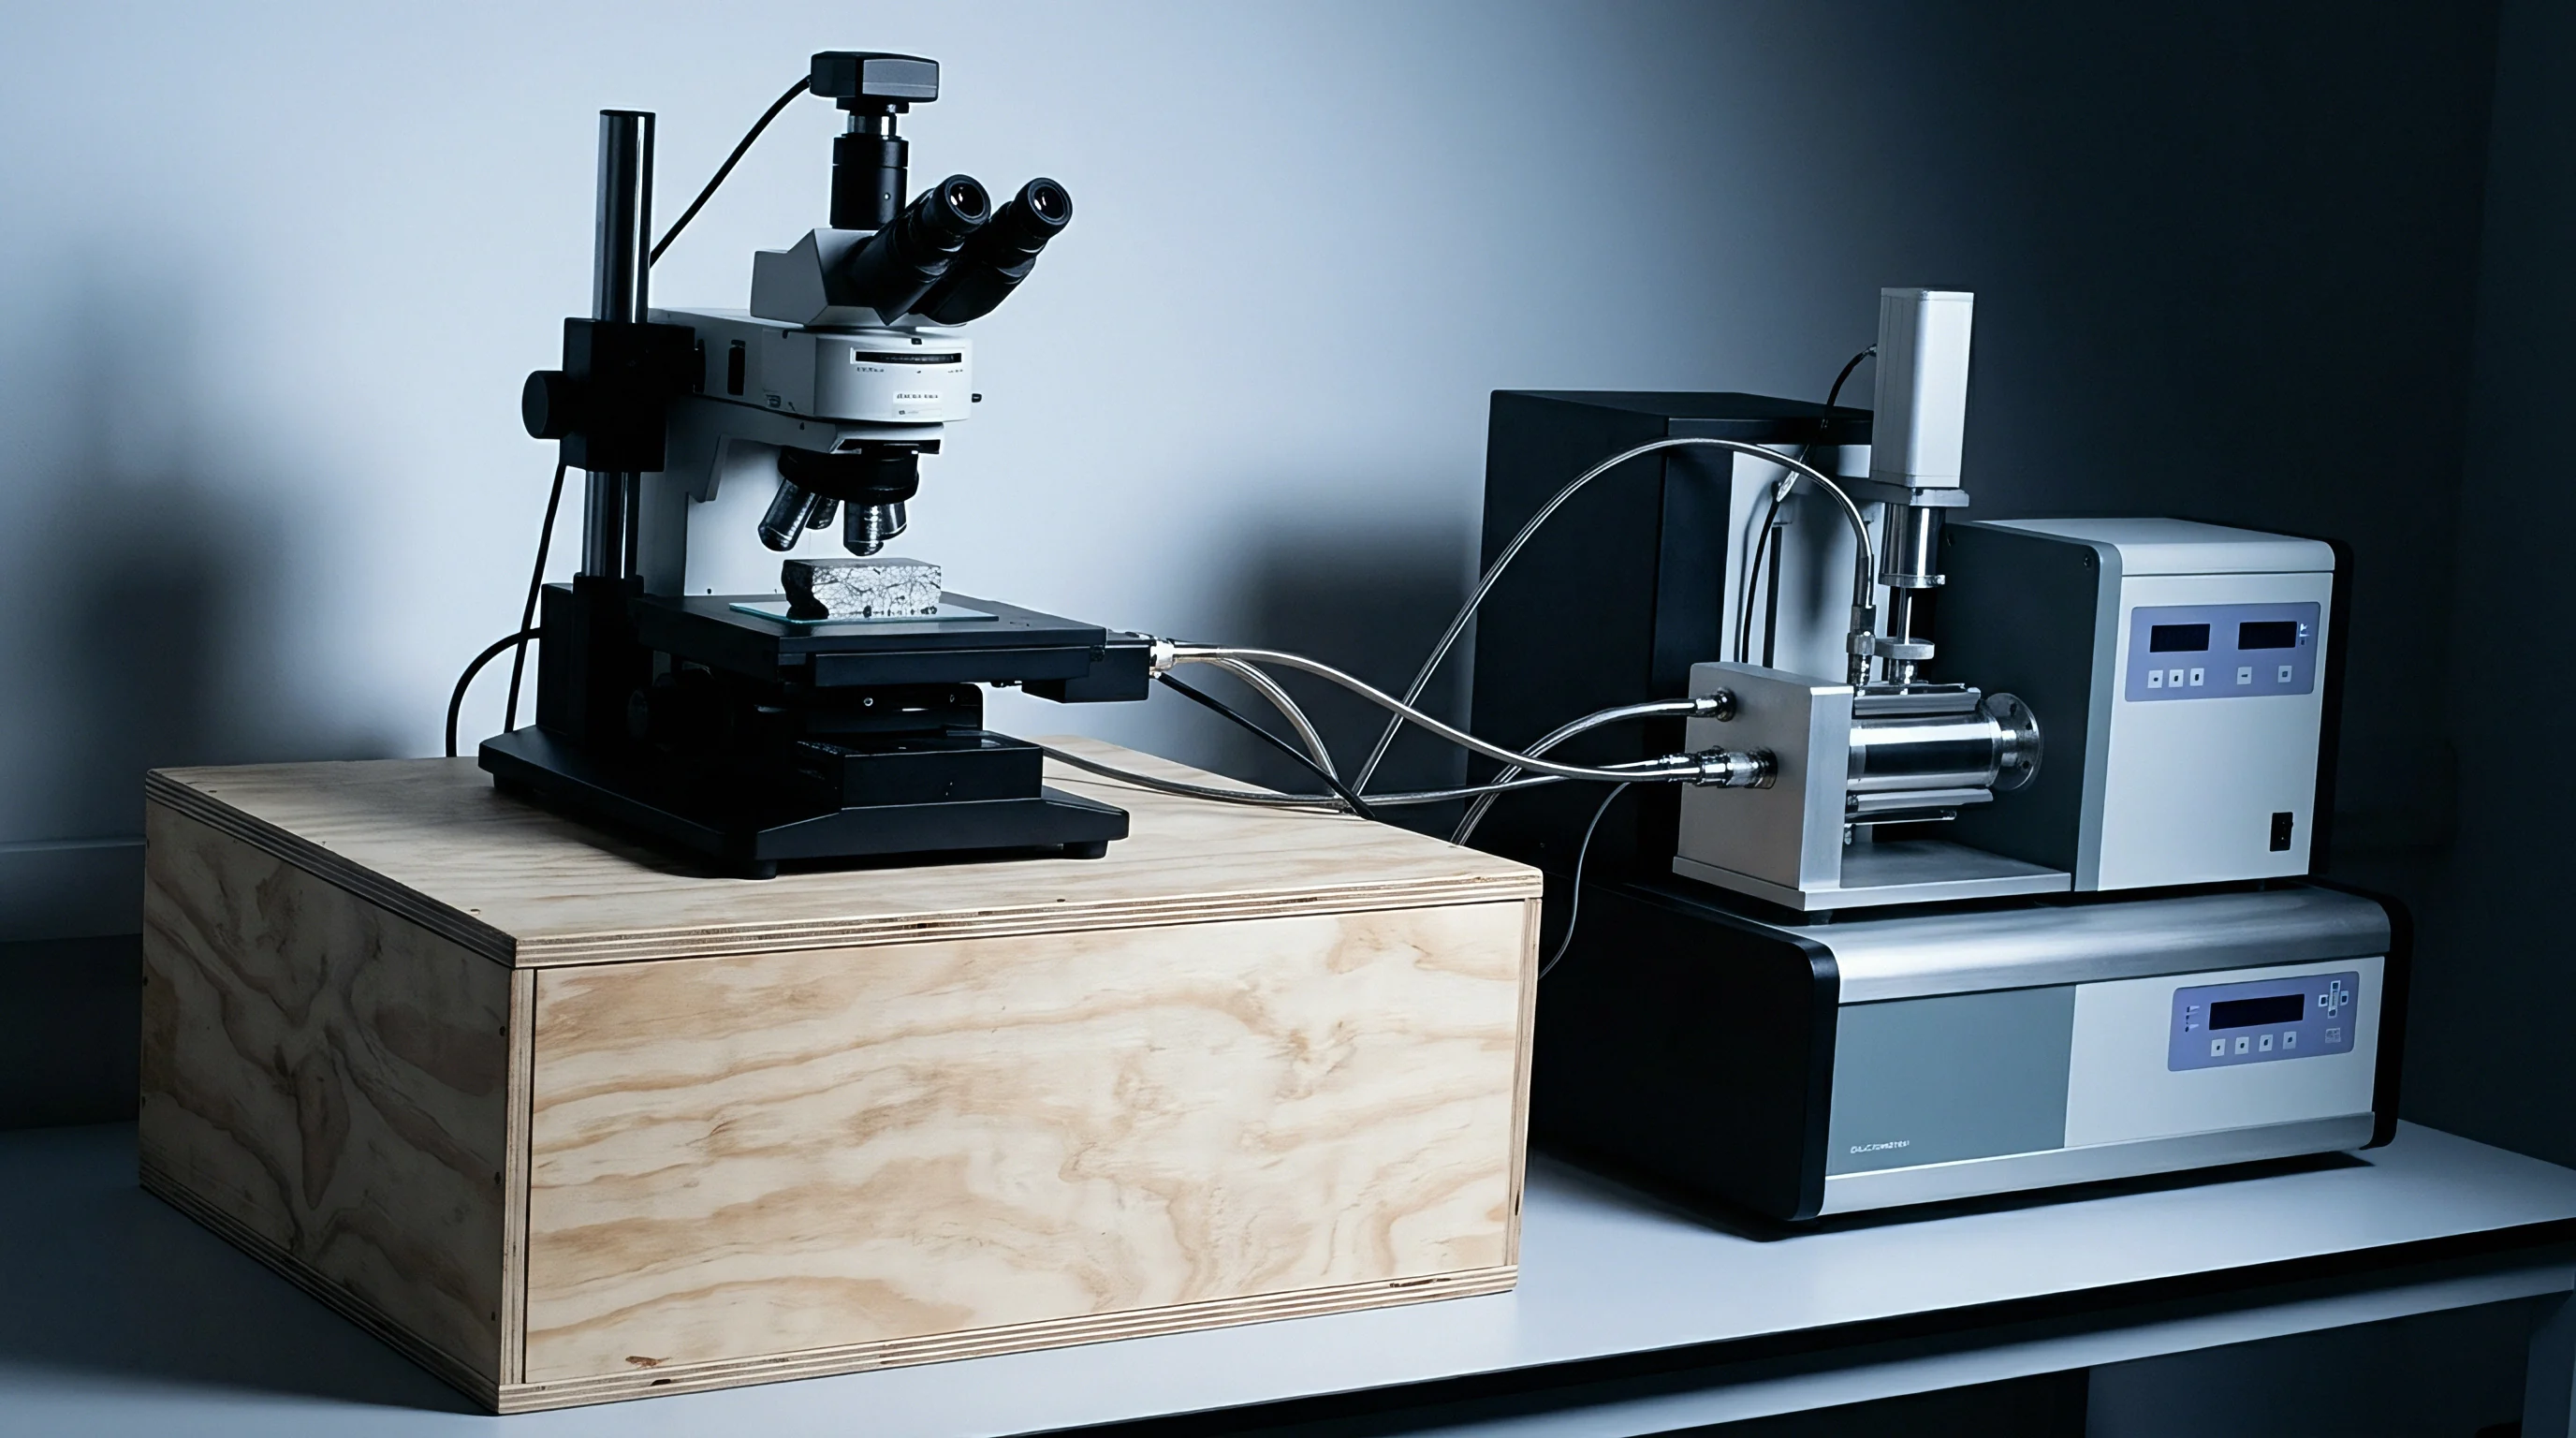
Experimental Setup and Signal Deconvolution on Nickel Rich Pouch Cells
During a 2C fast charge, a 100 Ah NMC pouch cell heats up rapidly while moving through lithiation states. Running measured displacement through regularized deconvolution separates the 342-micrometer total displacement into its underlying physical components: electrochemical lithiation swelling and cross-plane thermal expansion.
Core temperature reconstruction showed a peak core value of 44.2 °C near 82 percent state-of-charge, exceeding surface readings by 5.6 °C. Integrating this thermal field across the cross-plane expansion model gave a peak thermal displacement artifact of 88 micrometers. Subtracting thermal strain from total displacement left a net electrochemical swell of 254 micrometers at 100 percent state-of-charge.
| State of Charge Range (%) | Raw Measured Total Displacement (µm) | Reconstructed Core Temp (°C) | Calculated Thermal Strain Artifact (µm) | Deconvoluted Electrochemical Swelling (µm) |
|---|---|---|---|---|
| 0 to 20 | 38 | 27.2 | 10 | 28 |
| 20 to 40 | 85 | 31.5 | 29 | 56 |
| 40 to 60 | 154 | 36.8 | 53 | 101 |
| 60 to 80 | 262 | 42.1 | 77 | 185 |
| 80 to 100 | 342 | 44.2 | 88 | 254 |
Phase transition steps in the graphite anode showed up clearly in the deconvoluted electrochemical strain curve. A distinct slope change at 22 percent state-of-charge marks the transition from stage 3L to stage 2C lithiation, followed by a second inflection at 54 percent state-of-charge matching the stage 2 to stage 1 transformation. In uncorrected displacement curves, thermal expansion smooths over these boundaries, hiding structural phase shifts.

Sensitivity Analysis of Thermal Coefficient Uncertainties
Errors in baseline thermal expansion coefficients feed directly into calculated electrochemical displacement curves. Shifting the cross-plane thermal expansion coefficient by plus or minus 15 percent around its nominal value (2.8 × 10⁻⁴ /K) alters peak electrochemical swelling by up to 13.2 micrometers, introducing a 5.2 percent relative error into state-of-health estimates.
Error propagation scales non-linearly with C-rate. Higher charge currents drive steeper core-to-surface temperature gradients, growing the thermal strain correction relative to the underlying electrochemical signal. At 0.5C, thermal strain accounts for only 8 percent of total displacement; at 3C fast charge, it reaches 34 percent.
Thermal deconvolution becomes critical as fast-charging rates climb.
Thermal expansion dominates total strain during the first 180 seconds of fast charge. Heat generation spikes immediately when high current hits, driving thermal expansion before bulk anode lithiation starts macroscopic swelling. Deconvolution algorithms correctly attribute this initial jump to heat, preventing state-of-charge trackers from registering false intercalation steps early on.
Thermal displacement tracking without dynamic core temperature mapping attributes structural heat expansion to phase changes and under-sizes end-plate stiffness.
Failing to separate thermal expansion from electrochemical strain during fast-charge testing leads engineers to overestimate solid-state intercalation swell. That results in miscalculated cell gap dimensions, leaving the stack loose once the pack cools to ambient equilibrium.


Tooling
Pack engineering teams convert deconvoluted strain profiles into end-plate spring rates and cell-to-cell expansion gaps. Designing EV module housings requires predicting stack pressures across a 10-year operating lifespan. Enclosures must maintain cell pre-load (0.3 to 0.7 MPa) to prevent electrode delamination, while keeping peak compressive stress under 1.5 MPa at full state-of-charge and elevated temperatures to protect separators from puncture or pore collapse.
Deconvoluted strain curves establish the mechanical displacement baseline that module spring interfaces absorb during each cycle. Combining reversible electrochemical swelling, irreversible aging growth, and transient thermal expansion gives the total displacement vector. Engineers insert compressible pads (such as polyurethane or micro-cellular silicone foam) between adjacent cells to take up these compound dimensional changes.
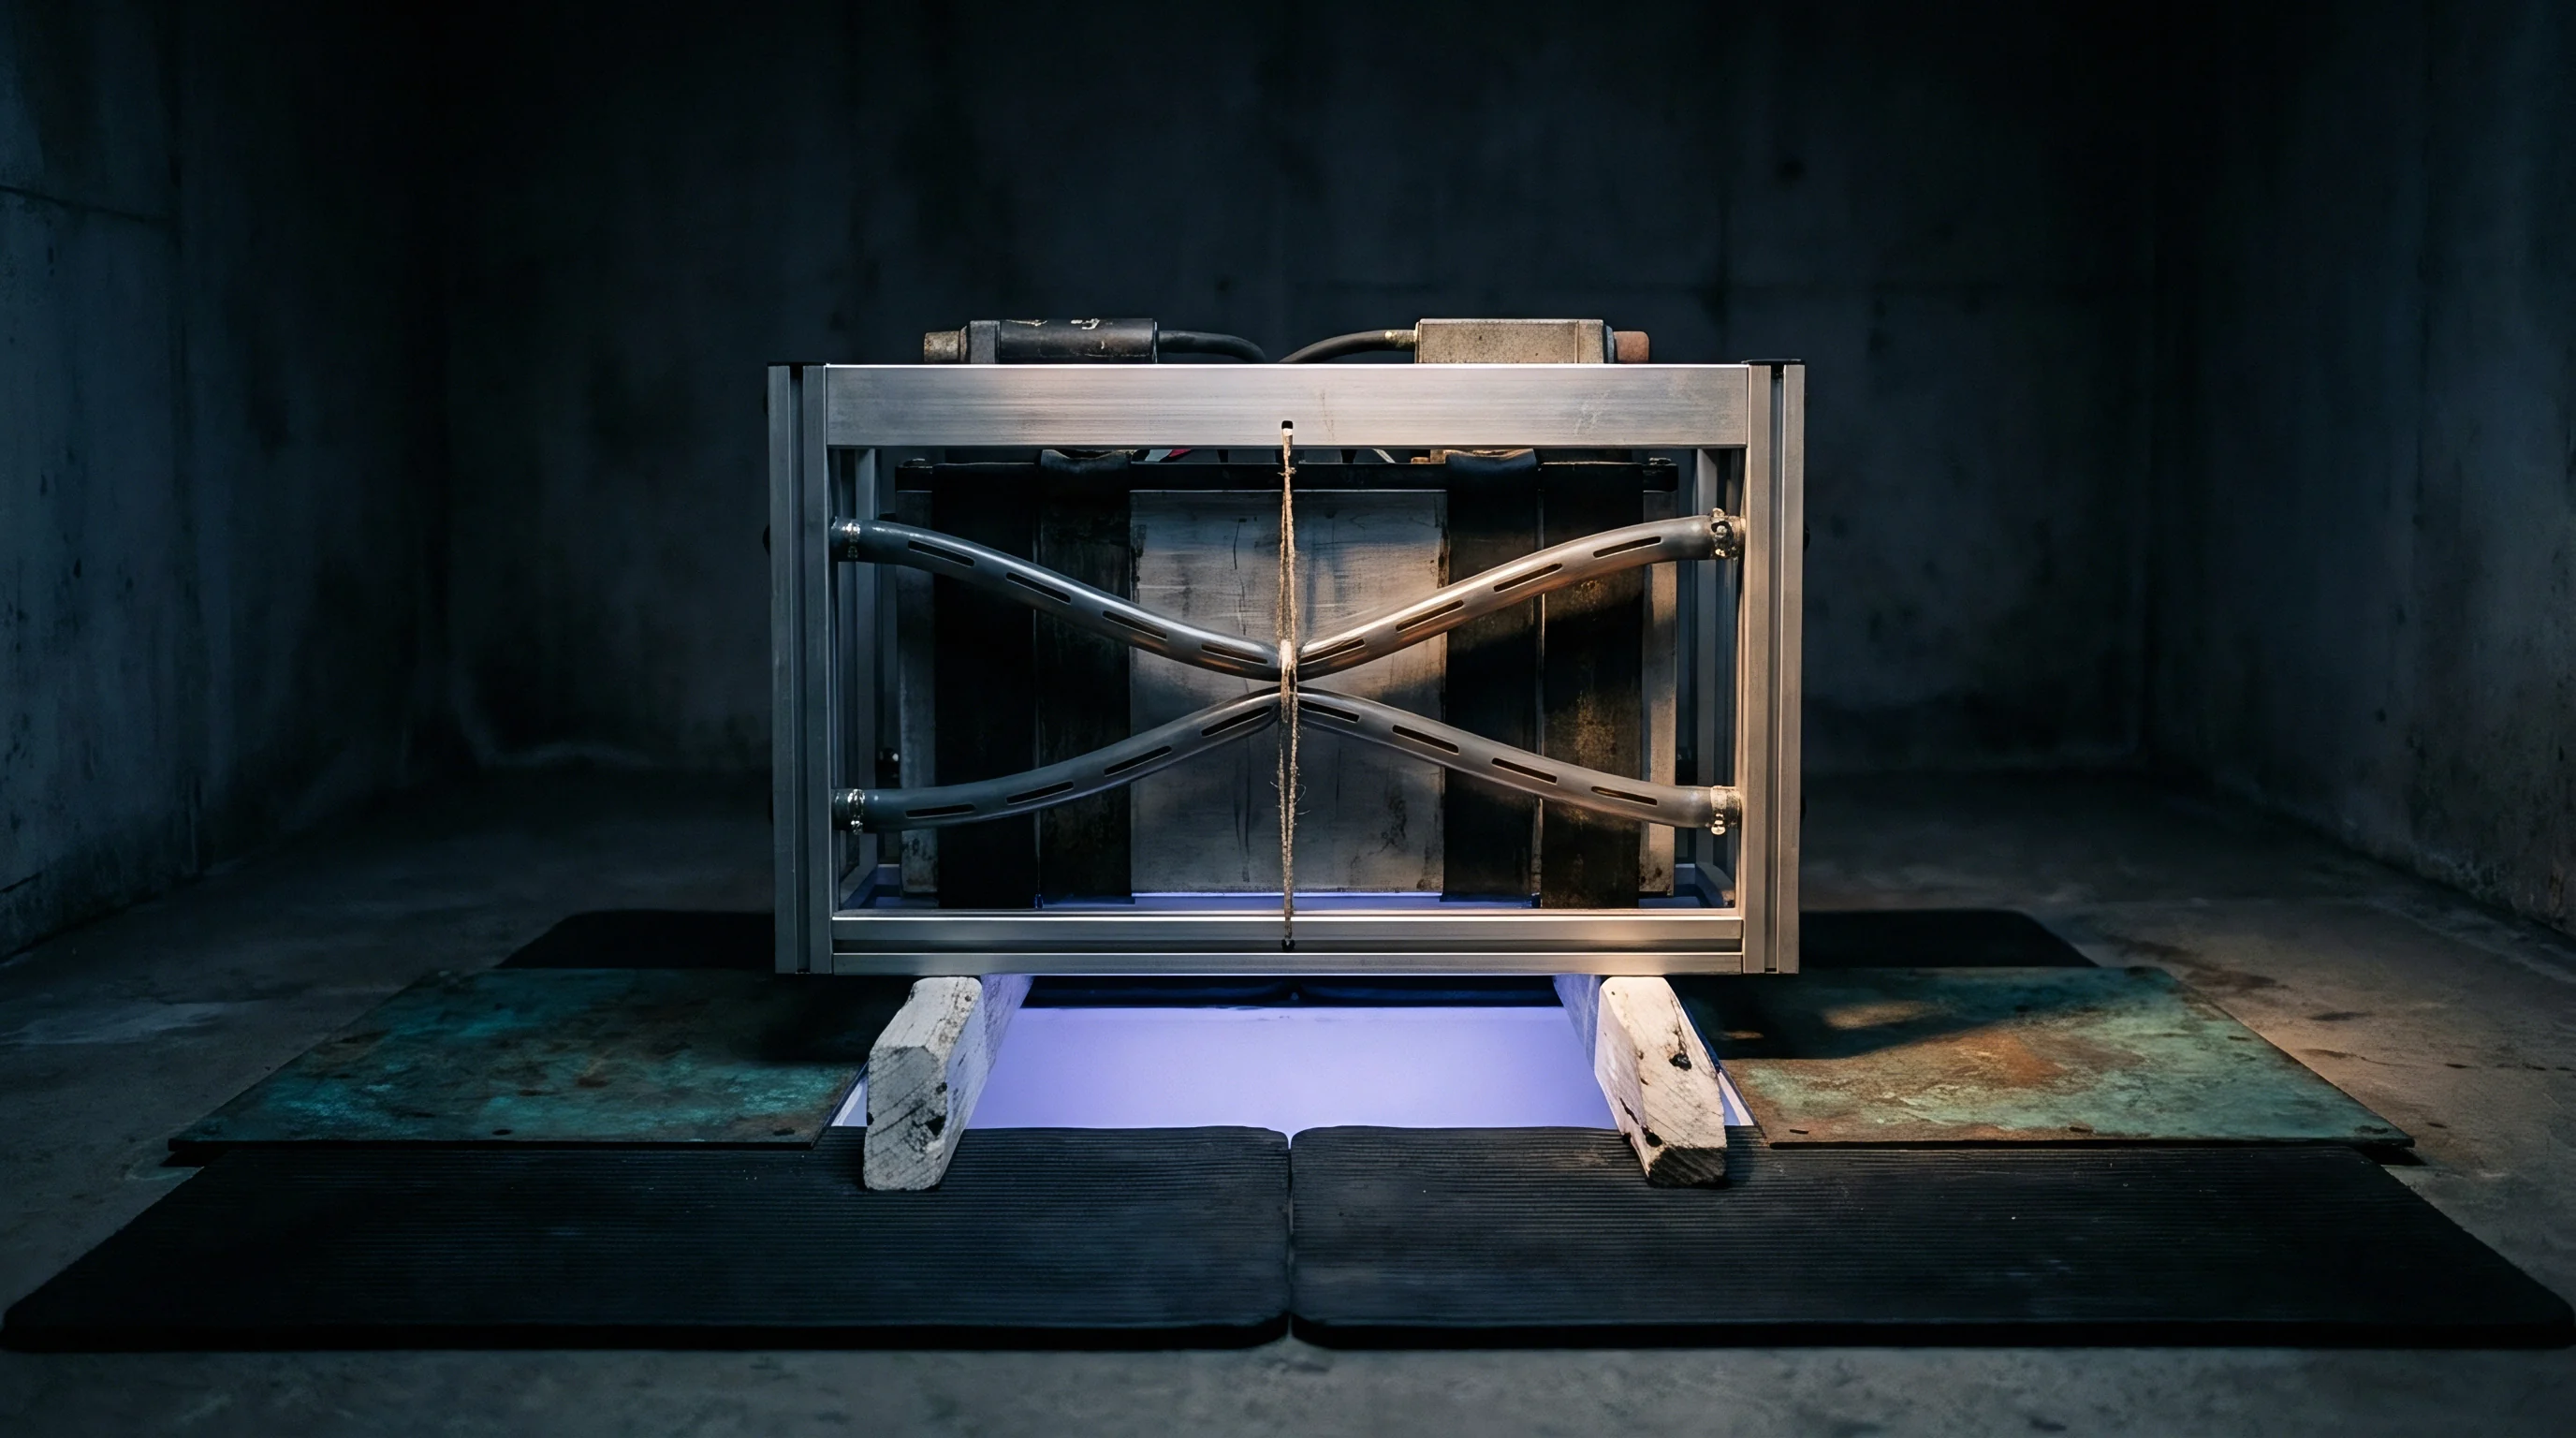
End Plate Spring Rates and Stack Pressure Optimization
Clamping prismatic or pouch cells inside rigid enclosures accelerates mechanical degradation when swelling pressure climbs too high. End-plates and tie-rods form a stiff spring network around the stack. Designing end-plates means balancing structural mass against bending compliance: overly stiff plates cause internal stress spikes during thermal events, while overly compliant plates allow stack gapping and accelerate capacity fade.
| Pack Design Requirement | Input Derived from Deconvolution | Impact of Un-Deconvoluted Raw Data | Optimal Target Specification |
|---|---|---|---|
| Inter-Cell Pad Thickness | Reversible electrochemical strain amplitude | Pad over-sized by 25-30% due to thermal expansion inclusion | 1.2 mm micro-cellular silicone foam (40% deflection at 0.5 MPa) |
| End-Plate Bending Stiffness | Peak combined thermal plus electrochemical force | Excess mass added to end-plate structural ribs | 125 kN/mm structural rigidity limit |
| Initial Assembly Pre-load | 0% SOC unconstrained dry stack dimension | Assembly pre-load set too low, causing low-SOC stack looseness | 0.35 MPa uniform compressive face stress |
| Maximum Swelling Gap | Irreversible aging strain plus peak thermal swell | Module length oversized, reducing volumetric energy density | 1.8 mm clearance margin per 10-cell sub-stack |
Compression pads exhibit non-linear stress-strain behavior. Operating within their linear plateau keeps stack pressure steady across state-of-charge and temperature sweeps. Relying on deconvoluted strain metrics avoids over-specifying pad thickness, preserving volumetric energy density and saving module length in dense pack designs.

Commercial Specification Clauses and Warranty Boundaries
Datasheets often report dimensional changes measured under unconstrained, isothermal bench conditions. Those numbers understate actual thickness growth inside constrained battery packs running under dynamic thermal loads. Procurement teams need to build clear characterization protocols into cell supply contracts to protect against premature warranty disputes caused by swelling failures.
Setting cell mechanical specifications requires documenting unconstrained electrochemical expansion alongside constrained stress-generation limits across life. Supply contracts should spell out these core engineering metrics:
- Isothermal Electrochemical Swelling Rate defines maximum allowable thickness growth per 100 equivalent full cycles at an isothermal 25 °C.
- Transient Thermal Strain Limits sets maximum cross-plane thermal expansion limits per degree Celsius across specified state-of-charge bands.
- Beginning-of-Life Stack Pre-load Range sets permissible face pressures during initial module assembly.
- End-of-Life Constrained Pressure Cap limits generated internal pressure at 80 percent capacity retention under full-charge steady-state thermal conditions.
- Standard Deconvolution Test Compliance binds both manufacturer and pack integrator to agreed regularized strain deconvolution algorithms during inspection audits.
Disputes over cell dimensional compliance resolve cleanly when test protocols enforce algorithmic deconvolution of thermal strain artifacts. Standardizing these algorithms eliminates ambiguity over whether a cell failed tolerance due to solid-state anode degradation or uncompensated test chamber fluctuations.
Section 4.3 of the standard cell purchase agreement specifies that cell dimensional compliance audits shall evaluate deconvoluted electrochemical strain signals using Tikhonov-regularized inversion matrices to verify that end-of-life growth remains within 8.5 percent of nominal initial cell thickness.