Diagnostic Protocols for Cathode Interphase Characterization and Degradation Tracking
Advanced cathode interphase diagnostics combine cryogenic vacuum spectroscopy with operando gas analysis to prevent high-voltage capacity fade and regulatory transport rejections.
Probe
Surface sensitive analytical instrumentation resolves chemical states across the cathode interphase within shallow sampling depths ranging from sub-nanometer to tens of nanometers. Characterization of cathode-electrolyte interphases in high-voltage lithium-ion chemistries demands strict selection of probe mechanisms. High-nickel cathodes, including nickel-manganese-cobalt formulations with nickel content exceeding eighty percent, generate reactive surface states that oxidize carbonate solvents above 4.2 V versus Li/Li+.
Probing these interfacial layers without inducing beam damage or ambient degradation requires calibrated vacuum transfer techniques and energy-tuned irradiation sources.
Surface degradation layers consist of organic alkyl carbonates, inorganic lithium fluoride, lithium carbonate, and reduced transition metal species. Laboratory X-ray photoelectron spectroscopy utilizing monochromatic Aluminum K-alpha radiation provides atomic composition and chemical bonding information within the top five to ten nanometers. Synchrotron-based hard X-ray photoelectron spectroscopy extends probe depths beyond thirty nanometers.
This non-destructive depth profiling reveals buried phase boundaries without ion beam milling artifacts.

Analytical Sampling Depths and Beam Limits
Surface spectroscopy instruments require strict power attenuation to prevent surface reduction during measurement. Photoelectron emission yields decrease as X-ray photon energy increases, requiring extended acquisition times that increase thermal exposure. High-energy X-ray beams induce photo-reduction of tetravalent nickel to divalent nickel, generating false interphase degradation signatures.
Secondary electron emission during focused ion beam sectioning disrupts sensitive organic poly-carbonate structures.
Cryogenic transfer workflows maintain native interphase composition during transport from cleanroom dry environments to high-vacuum analysis chambers. Atmospheric moisture exposure converts lithium salts to lithium hydroxide and hydrofluoric acid within seconds. Hydrofluoric acid attacks the cathode surface, dissolving transition metal ions and inflating surface lithium fluoride concentrations.
At 4.4 V vs Li/Li+, laboratory XPS depth profiling yields a 3.5 nanometer thick fluorinated cathode interphase on NMC811 cathodes aged at 45 degrees Celsius.

Cryogenic Sample Preparation and Isolation
Ex situ measurements demand complete atmospheric exclusion during transport from the glovebox to the test chamber. Translucent vacuum transfer vessels equipped with inert gas isolation valves preserve sample integrity. Sealed transfer cells permit sample mounting under argon atmospheres containing under 0.1 parts per million oxygen and moisture.
Cryogenic cooling during focused ion beam milling protects delicate polymer species from beam-induced melting and carbonization.
| Diagnostic Technique | Sampling Depth | Lateral Resolution | Key Interphase Markers | Beam Damage Susceptibility |
|---|---|---|---|---|
| X-ray Photoelectron Spectroscopy | 2 to 10 nm | 10 micrometers | LiF, Li2CO3, C-O/C=O carbonates | Moderate under unmonitored exposure |
| Hard X-ray Photoemission Spectroscopy | 10 to 50 nm | 1 micrometer | Sub-surface oxygen vacancy states | Low at flux density below 10^11 photons/s |
| Time-of-Flight SIMS | 1 to 2 nm | 50 nanometers | Organic fragment ions, metal fluorides | High during sputter depth profiling |
| Operando Mass Spectrometry | Bulk headspace | Systemic baseline | CO2, O2, ethylene gas release rates | Zero direct radiation exposure |
| Transmission Electron Microscopy | Lattice edge | 0.1 nanometers | Spinel, rocksalt phase boundaries | Severe beam-driven knock-on displacement |
Raman spectroscopy complements X-ray methods by detecting localized structural symmetry changes in the bulk lattice. Laser excitation power stays below 0.5 milliwatts to eliminate thermal phase changes. Infra-red absorption techniques track organic species growth across extended cycling schedules.
Combined probe strategies link bulk structural stability directly to surface interphase chemistry.
Improper sample cleaning with polar solvents strips organic polycarbonate interphase layers, producing falsified interphase impedance calculations that misguide cell qualification decisions.
Spectra
Core-level photoelectron binding energy assignments provide precise identification of chemical species within the cathode interphase layer. Deconvolution of high-resolution photoelectron emission features requires peak fitting models grounded in quantum chemical reference states. The carbon 1s emission spectrum separates graphite substrate signals from aliphatic carbons, ether linkages, and carbonyl groups.
Fluorine 1s spectral features isolate metal-bound fluorine from organic fluoro-phosphate decomposition compounds.
Operando gas emission spectra track solvent oxidation and lattice oxygen release as cell potential increases. Differential electrochemical mass spectrometry registers carbon dioxide evolution beginning at 4.1 V vs Li/Li+. Oxygen gas release intensifies above 4.3 V vs Li/Li+ in nickel-rich layered oxides.
This gaseous release accompanies severe phase degradation at the particle surface, accelerating cell capacity fade.

X-Ray Photoelectron Spectroscopy Binding Energy Deconvolution
Core-level spectra assignment relies on precise charge neutralization using the adventitious carbon C 1s peak at 284.8 electronvolts. Oxygen 1s spectra differentiate lattice oxygen at 529.5 electronvolts from surface hydroxide, carbonate, and species containing organic carbon-oxygen bonds. Transition metal 2p photoelectron spectra exhibit complex multiplet splitting and shake-up satellite structures.
Oxidation state quantification demands fitting algorithms calibrated against stoichiometric oxide powders.
Secondary ion mass spectrometry maps three-dimensional distribution patterns of organic fragments and inorganic cluster ions across cathode particle clusters. Fluoride ion species concentrate at the outer interphase surface. Poly-carbonate compounds penetrate into inter-granular cracking networks inside secondary spherical particles.
Depth profiling with gas cluster ion beams minimizes matrix sputter artifacts during profiling.
Cryogenic transfer vessels prevent moisture condensation and organolithium thermolysis during vacuum chamber loading.

Operando Gas Evolution Monitoring Protocols
Differential electrochemical mass spectrometry tracks volatile degradation products during initial formation cycles. Carrier gas flows sweep headspace gases directly into quadrupole mass filters. Ethylene gas signals confirm carbonate ring-opening reactions at the anode, while carbon monoxide evolution indicates high-voltage solvent oxidation at the cathode interphase.
Quantified gas volumes correspond directly to total charge consumed during parasitic side reactions.
Characterization workflows encounter specific analytical artifacts during sample processing and spectroscopic recording:
- Solvent Washing Artifacts strip soluble organic species like lithium alkyl carbonates, altering measured atomic ratios during ex-situ surface analysis.
- Sample Oxidation occurs within seconds of air exposure, converting reduced metal centers into artificial hydroxide and oxide surface films.
- X-Ray Beam Reduction converts tetravalent nickel ions into divalent forms during prolonged spectral accumulation, distorting oxidation state calculations.
- Differential Surface Charging shifts photoelectron energy scale positions inconsistently across non-conductive interphase regions, compromising peak deconvolution accuracy.
High-resolution transmission electron microscopy combined with electron energy loss spectroscopy measures localized oxygen coordinate environments. Standard layered structures display distinct oxygen K-edge pre-peak features. Surface transformation to rocksalt structures eliminates this pre-peak feature entirely.
Mapping these spectral changes across particle radii reveals structural boundary migration speeds under varied temperature regimes.
Cell vendors frequently attribute rapid interphase growth to storage room temperature excursions during factory holding periods rather than high-voltage interfacial side reactions.

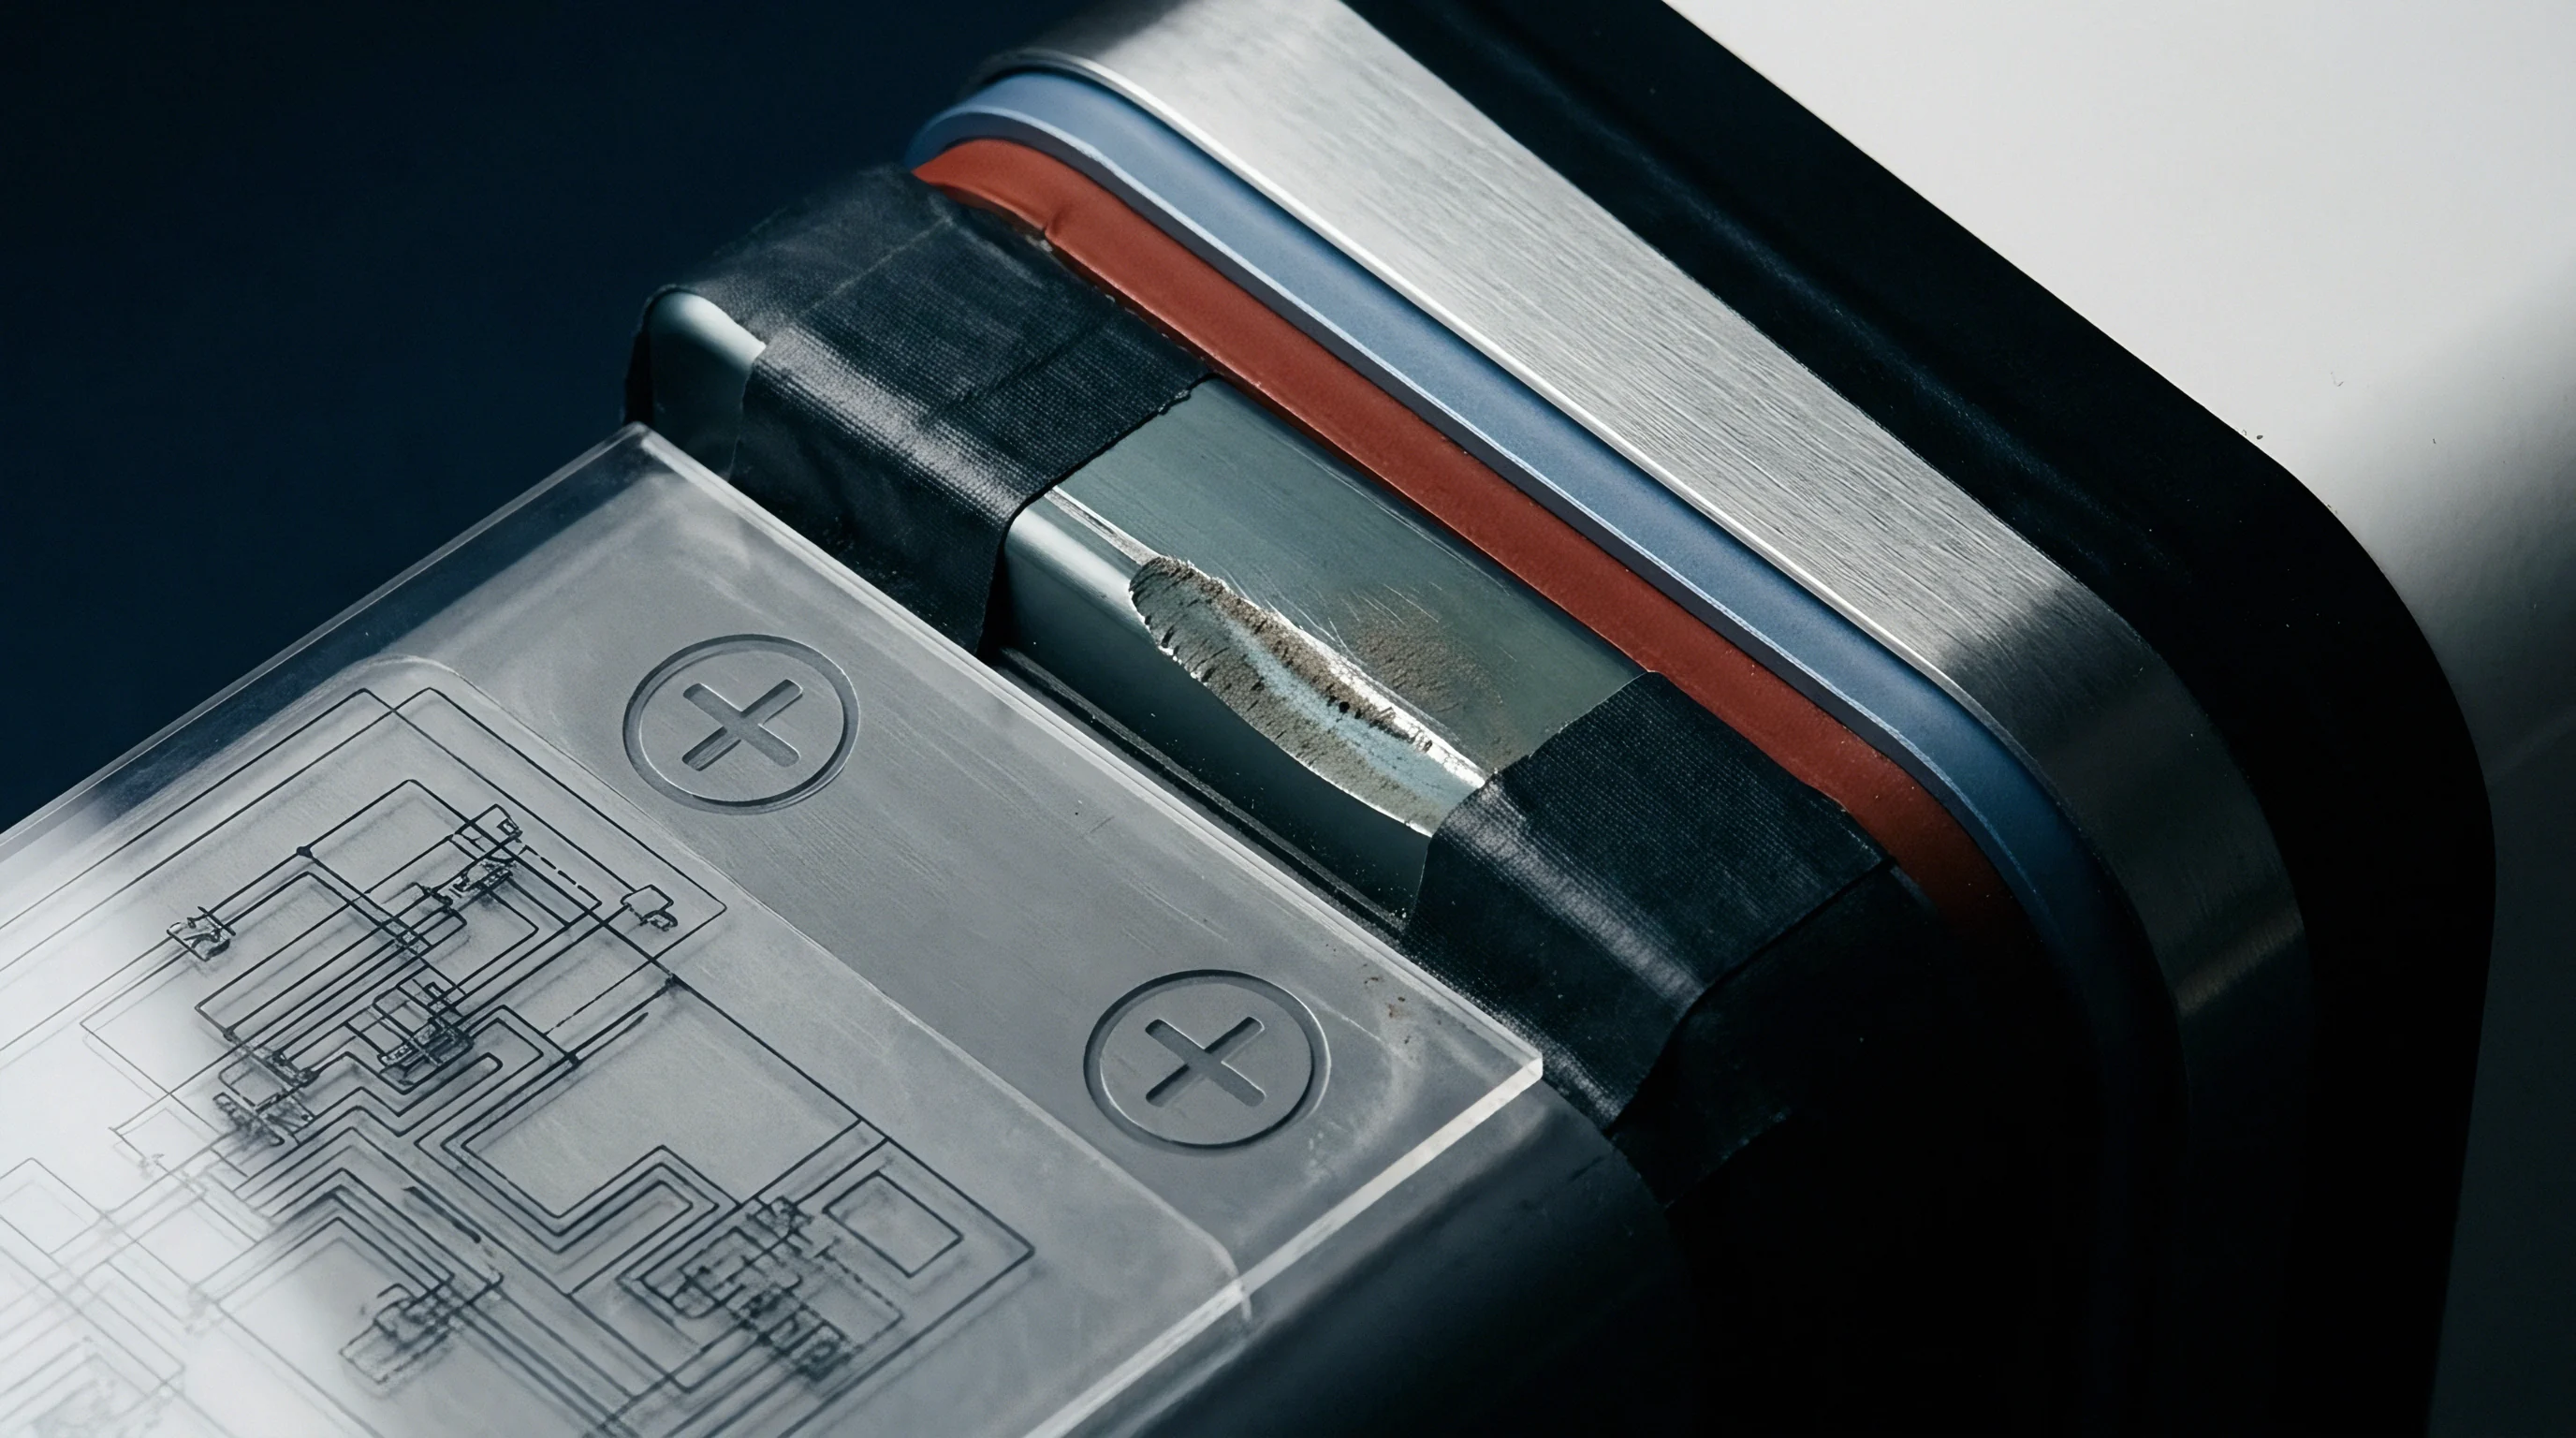
Decay
Cathode interphase structural degradation proceeds through distinct chemical pathways dependent on upper cutoff voltage and operational temperature. Layered transition metal oxides undergo parasitic surface phase transformations during high-voltage operation. The native R-3m space group symmetry transforms into an intermediate spinel-like phase before degrading into a disordered Fm-3m rocksalt surface layer.
This inactive rocksalt coating increases lithium-ion transport resistance, driving capacity fade.
Transition metal dissolution accompanies this phase conversion. Acidic species in the liquid electrolyte dissolve nickel, manganese, and cobalt ions from unpassivated cathode surfaces. Dissolved cations migrate through the separator, depositing on the graphite anode surface.
This cross-over poisons the solid electrolyte interphase, causing severe capacity loss through active lithium consumption.

What Diagnostic Signal Separates Surface Passivation from Lattice Oxidation?
Gas evolution profiles collected via differential electrochemical mass spectrometry reveal clear onset potential shifts during high-voltage holds. Passivation film growth produces self-limiting carbon dioxide emission during initial formation. Lattice oxygen evolution produces continuous oxygen gas release above 4.3 V vs Li/Li+.
Oxygen loss triggers lattice collapse, forming microcracks that expose fresh particle surfaces to electrolyte attack.
Electrochemical impedance spectroscopy tracks the growth of cathode interphase resistance across cycle life. Impedance spectra recorded across temperatures yield activation energy values for interfacial charge transfer. Rapid impedance rise indicates continuous accumulation of non-conductive reaction products on cathode particle surfaces.
| Cathode Chemistry | Upper Cutoff Voltage | Phase Transformation Depth | Transition Metal Dissolution Rate | Interphase Impedance Rise Rate |
|---|---|---|---|---|
| LiNi0.8Mn0.1Co0.1O2 (NMC811) | 4.3 V | 3 to 8 nm | 12.4 mg/kg per 100 cycles | 2.1 Ohms per 100 cycles |
| LiNi0.9Mn0.05Co0.05O2 | 4.4 V | 8 to 15 nm | 28.7 mg/kg per 100 cycles | 4.8 Ohms per 100 cycles |
| LiFePO4 (LFP) | 3.8 V | Under 1 nm | 0.2 mg/kg per 100 cycles | 0.1 Ohms per 100 cycles |
| LiNi0.5Mn1.5O4 (LNMO) | 4.9 V | 10 to 22 nm | 45.1 mg/kg per 100 cycles | 8.3 Ohms per 100 cycles |
Degradation proceeds through a connected sequence of structural and chemical failures across the interphase region:
- Electrolyte Oxidation occurs above 4.2 V vs Li/Li+, generating radical species, organic acids, and free protons at the cathode surface.
- Proton Attack breaks metal-oxygen bonds in the cathode lattice, accelerating transition metal leaching into the liquid electrolyte.
- Lattice Oxygen Release creates subsurface oxygen vacancies, driving structural rearrangement from layered to rocksalt geometry.
- Microcrack Propagation opens secondary particle interiors to electrolyte penetration, multiplying active interphase area and continuous decay reactions.
Transition metal ions dissolved from the cathode diffuse across the separator to poison the solid electrolyte interphase on the graphite anode.
Lattice vacancy generation accelerates bulk mechanical degradation. Micro-cracking within secondary particles exposes fresh crystal facets to liquid electrolyte. Electrolyte enters these internal fractures, creating secondary interphase layers deep inside secondary particles.
Internal impedance rises rapidly, isolating active primary grains from electron transfer pathways.
Standard procurement contracts invoking IEC 62660-3 Clause 6.2 enforce lot rejection when calendar aging under 55 degrees Celsius elevates cathode interphase resistance beyond 150 percent of baseline.


Dossier
Regulatory compliance files for lithium-ion cell shipments require strict alignment between analytical degradation evidence and transport safety testing certificates. Interphase instability directly affects cell thermal safety during transportation. Thermal abuse tests mandated under international dangerous goods regulations expose latent interphase breakdown mechanisms.
Unstable cathode interphase layers break down exothermically at elevated temperatures, triggering cell thermal runaway.
United Nations UN 38.3 testing standards evaluate cell structural integrity under mechanical, environmental, and electrical stress. High-voltage cathode degradation compromises cell performance during the T.7 overcharge sequence. Damaged interphases allow rapid organic solvent oxidation, generating internal heating and pressure buildup inside sealed cell cans.
Regulatory documentation must link electrochemical degradation limits to certified safety test performance.

UN 38.3 Thermal and Overcharge Test Validation
High-temperature exposure during regulatory safety sequences triggers rapid interphase breakdown and exothermic oxygen release. Test T.2 subjects fully charged cells to extreme temperature cycles between 72 degrees Celsius and minus 40 degrees Celsius. Cells with degraded interphase layers exhibit internal gas generation and venting during thermal holds.
Passing regulatory criteria demands zero weight loss, zero leakage, and zero internal short-circuiting.
Overcharge testing under UN 38.3 Section 38.3.4.7 forces excess current into cells until full capacity overcharge occurs. Cathode interphases with high resistance accelerate internal Joule heating, driving separator collapse. Regulatory test dossiers require recorded temperature and voltage curves demonstrating thermal stability throughout the test duration.
UN Manual of Tests and Criteria Section 38.3.4.7 mandates thermal stability verification after 50 continuous cycling sequences to prevent latent interphase decomposition during air transport.

EU Battery Passport State of Health Verification
Mandatory digital tracking frameworks compel cell manufacturers to disclose validated interphase degradation rates throughout the product lifecycle. The European Union Battery Regulation requires state-of-health tracking containing internal resistance evolution metrics. Technical documentation must include calibrated capacity retention curves supported by documented diagnostic methodologies.
These records establish direct legal responsibility for commercial cell importers.
Cell buyers verify cathode stability through systematic dangerous goods safety audit steps:
- Review UN 38.3 Test Summaries issued by accredited ISO/IEC 17025 testing laboratories.
- Cross-check test summary batch identification numbers against factory manufacturing lots.
- Inspect high-temperature storage capacity retention data for abnormal impedance acceleration points.
- Verify differential capacity analysis curves for high-voltage peak decay patterns.
- Examine post-test destructive physical analysis reports for evidence of transition metal crossover.
- Validate transport safety compliance declarations prior to air freight carrier acceptance.
Transport packaging regulations under IATA Packing Instruction 965 mandate strict state-of-charge limits for air transit. Cells exhibiting accelerated interphase degradation self-discharge rapidly, causing deep discharge states during international transit. Deeply discharged cells risk internal copper dissolution, creating permanent short-circuit hazards upon subsequent charging.
The industry continues to debate whether non-destructive electrochemical impedance spectroscopy can legally substitute for destructive physical characterization when validating battery passport degradation metrics.

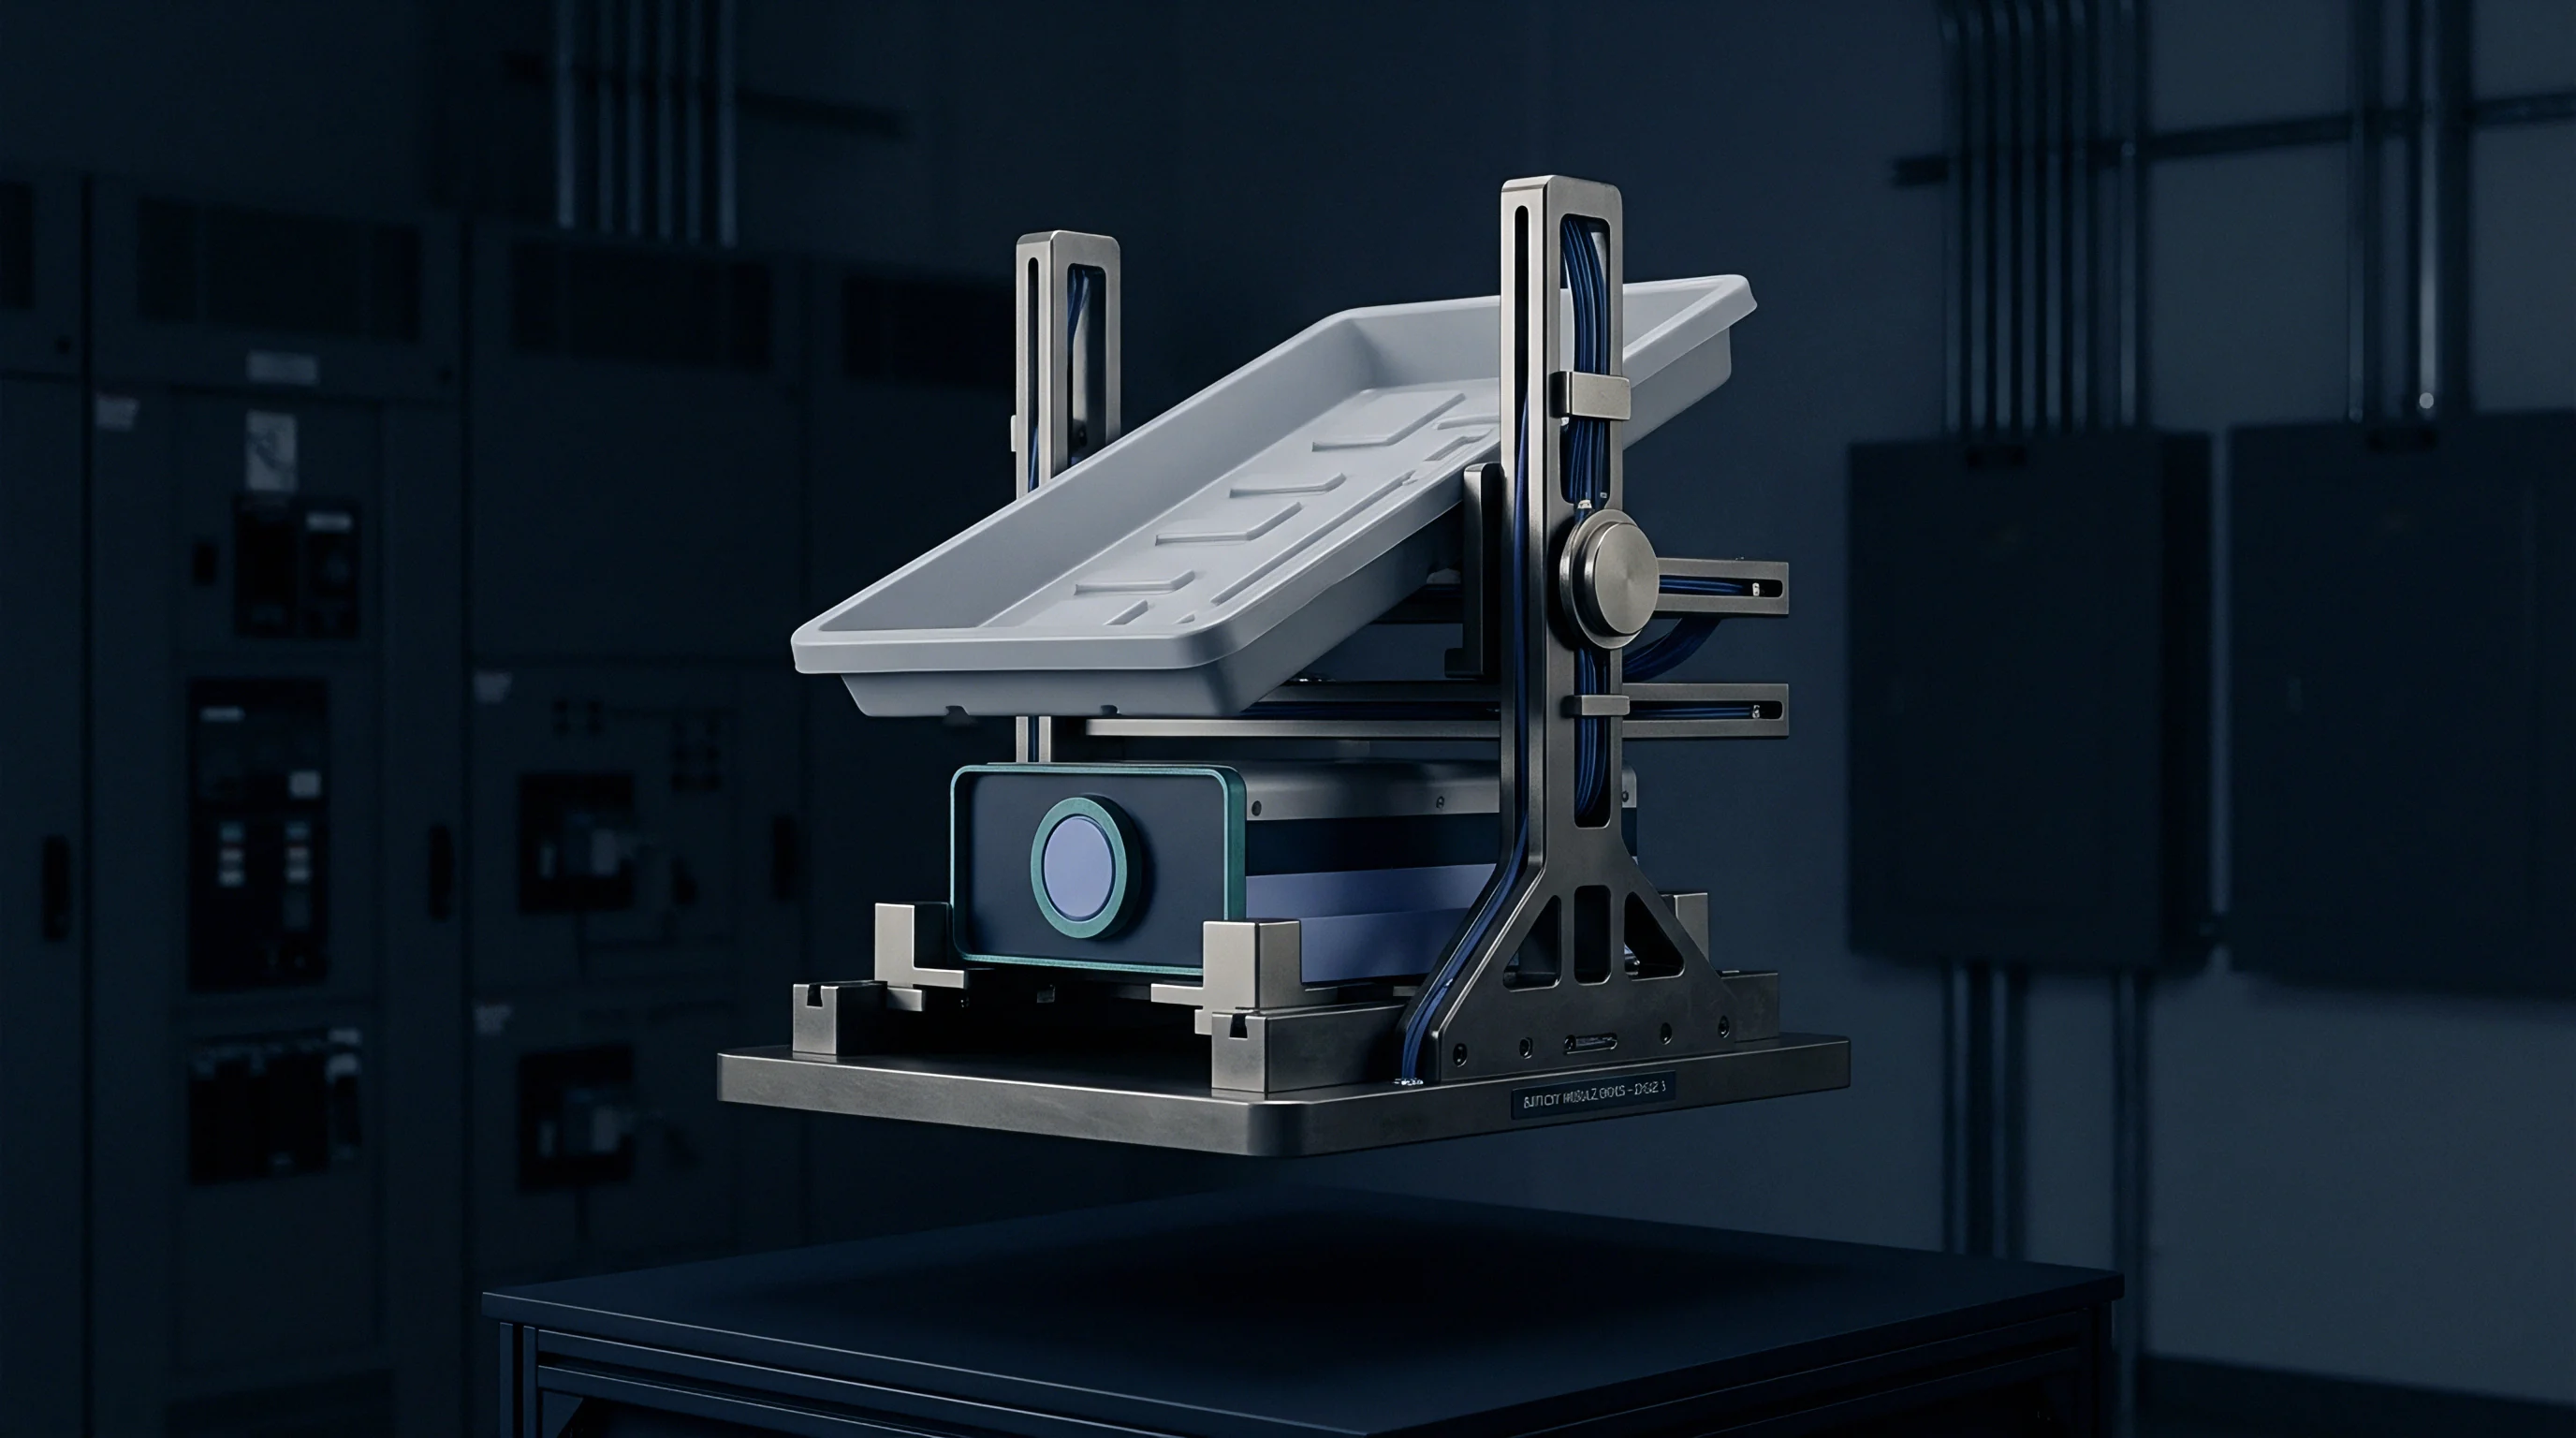
Invoice
Financial commitments in utility-scale cell procurement depend directly on the analytical validation costs required to secure long-term performance warranties. Tier 1 cell manufacturers incorporate cathode interphase characterization expenses directly into baseline cell pricing. Conducting comprehensive characterization suites adds fixed overhead expenses to battery cell orders.
Buyers weigh these upfront testing costs against the severe financial exposure of field recall events.
Diagnostic testing costs scale with analytical depth and beam line access requirements. Extended operando characterization suites increase lot qualification budgets. Basic impedance screening costs fractions of a cent per cell, while specialized synchrotron beam testing costs thousands of dollars per sample batch.
Allocating diagnostic resources efficiently minimizes overall landed procurement costs while ensuring product safety.
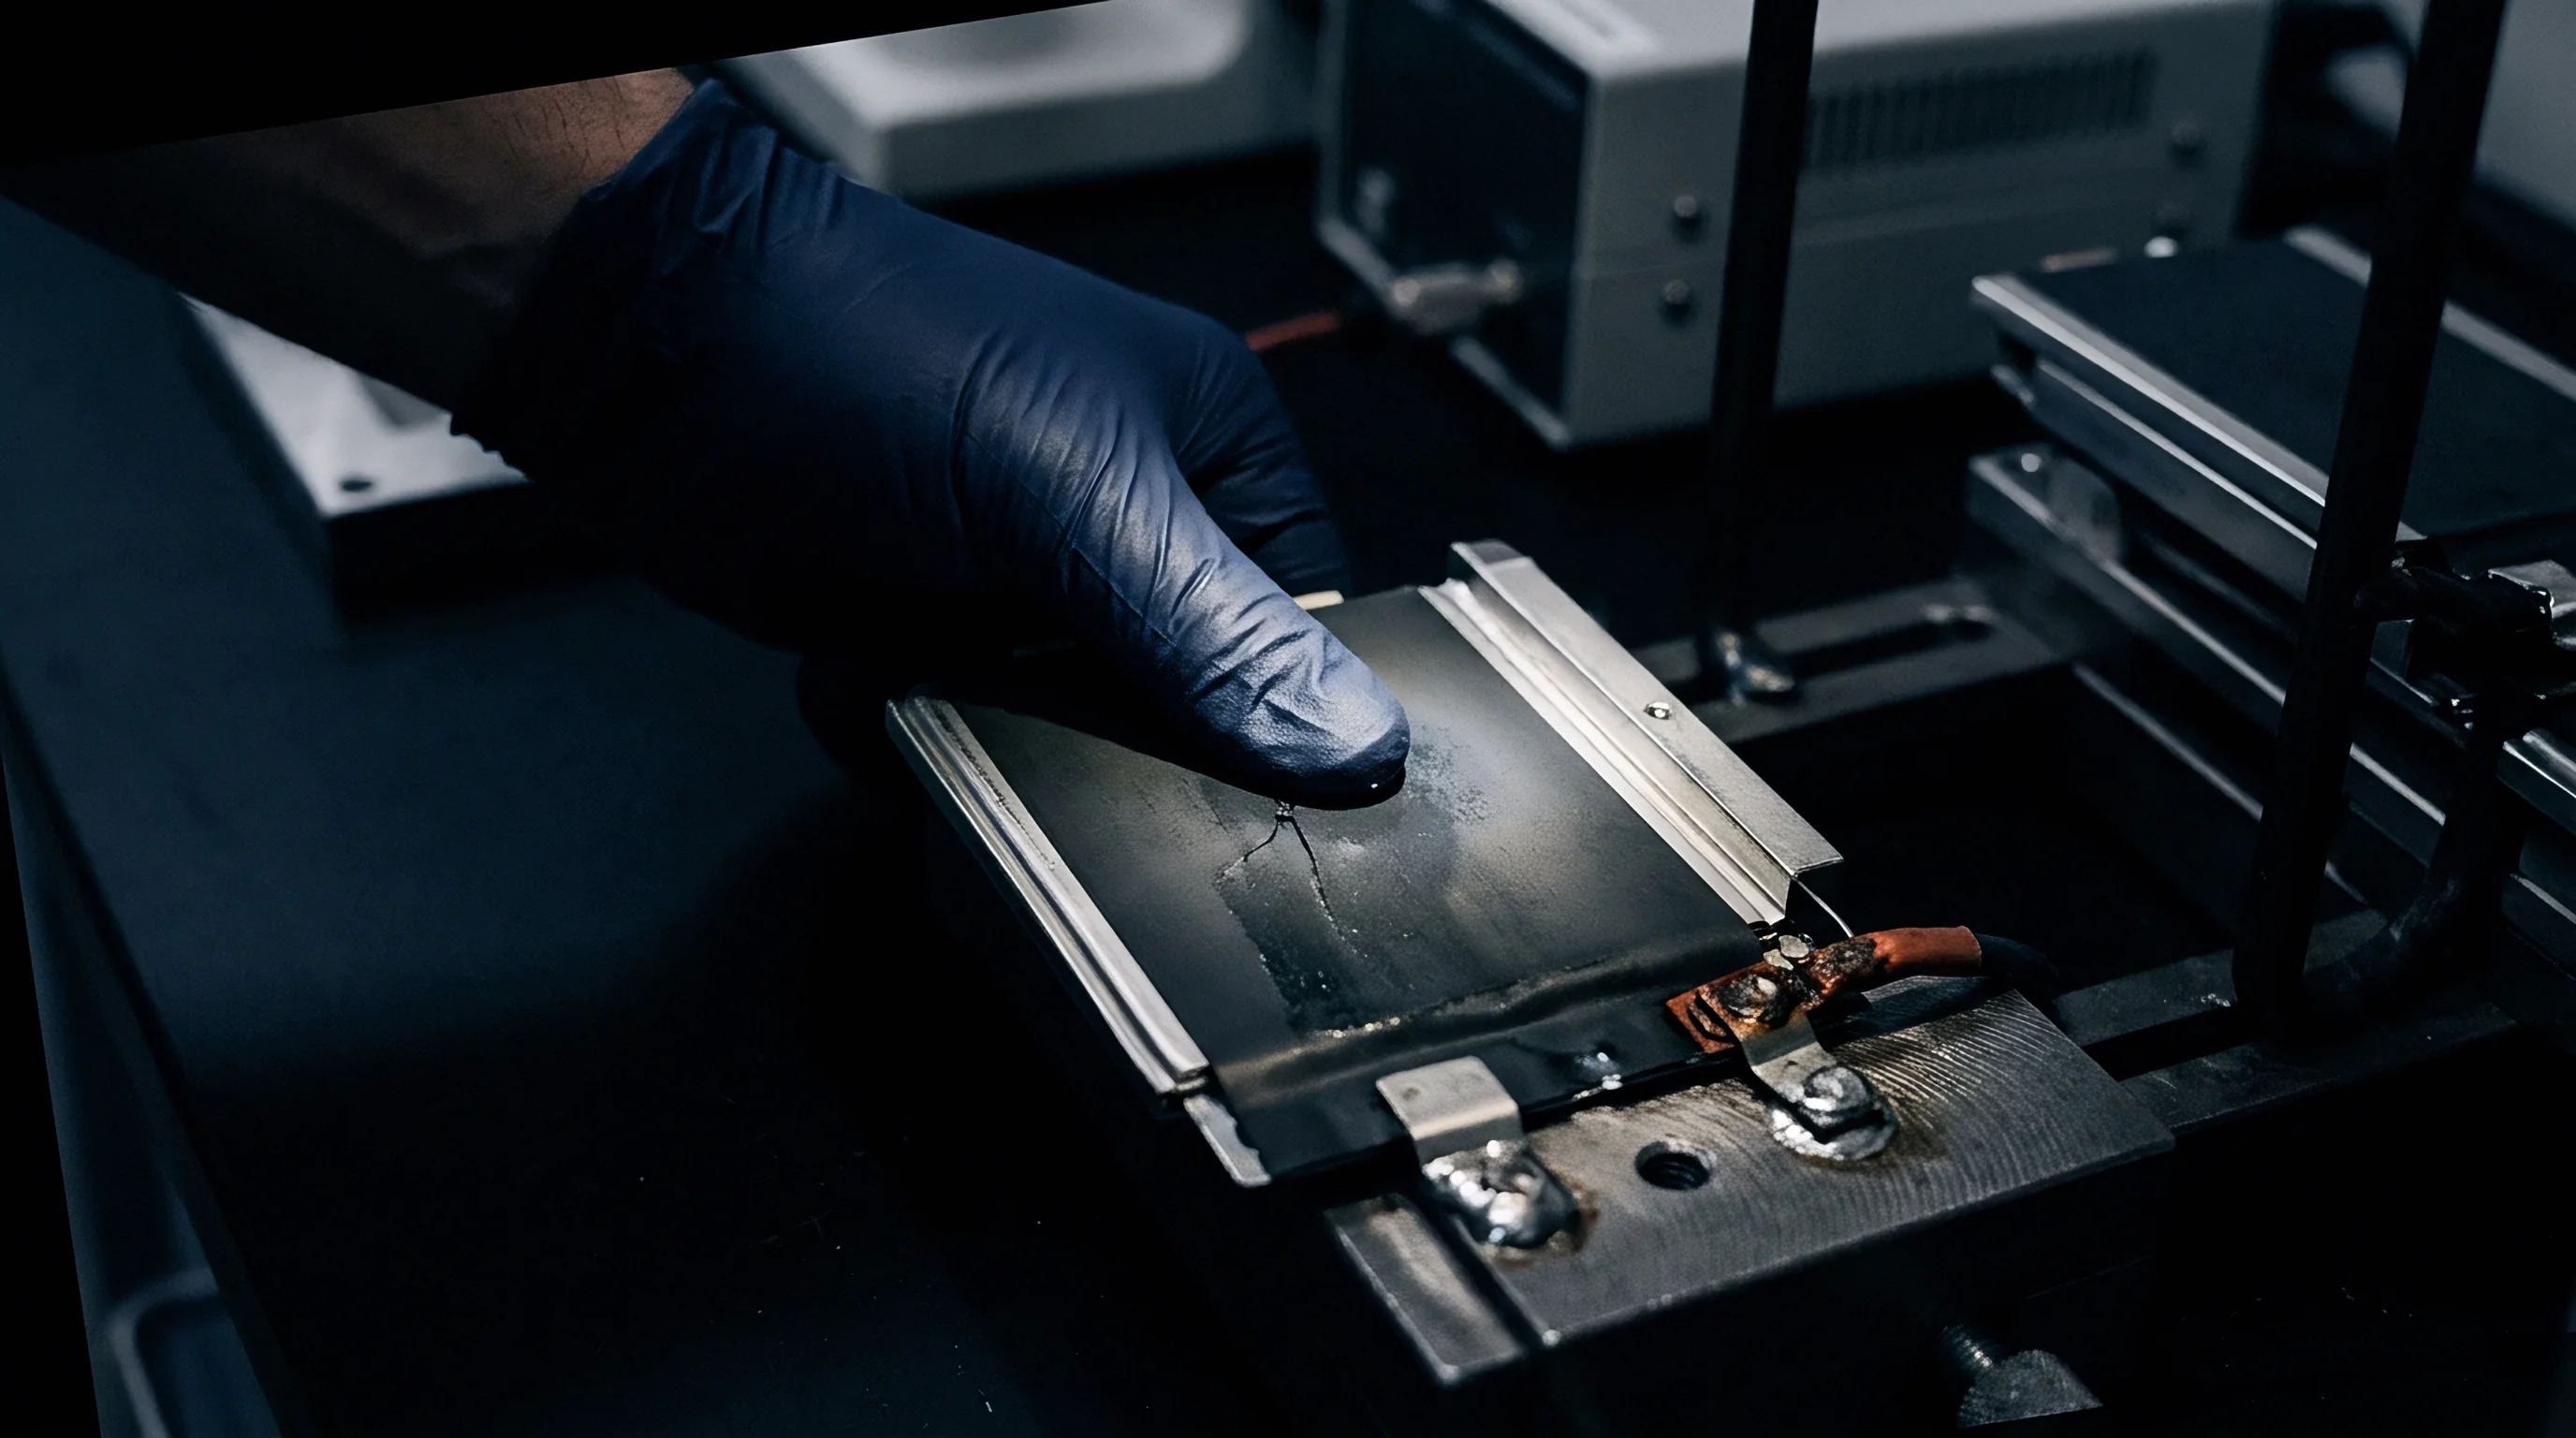
Diagnostic Suite Cost Allocation Model
Procurement teams balance destructive laboratory characterization budgets against the risk of unmitigated interphase impedance growth. Consider a procurement order for a 100 megawatt-hour energy storage project comprising 80,000 individual 300 ampere-hour cells. Basic factory acceptance testing costs $15,000 per production lot.
Advanced surface diagnostic suites, including XPS depth profiling and OEMS analysis, add $45,000 in analytical qualification expenses.
Skipping advanced interphase screening risks latent field failures. A three percent cell failure rate driven by interphase growth requires field replacements costing $450,000 in hardware and labor. Investing $60,000 in comprehensive upfront characterization mitigates this liability entirely, yielding clear economic returns on diagnostic investments.
| Diagnostic Tier | Sampling Frequency | Testing Cost Per Cell Lot | Identified Degradation Risk | Net Financial Exposure |
|---|---|---|---|---|
| Tier 1: Factory EIS & Cycling | 100 percent non-destructive | $2,500 | Gross capacity and resistance offset | High latent field failure exposure |
| Tier 2: Ex-Situ XPS & SEM | 5 cells per 10,000 units | $18,000 | Surface phase conversion and cracking | Moderate exposure bounded by batch sampling |
| Tier 3: Operando OEMS & TOF-SIMS | 2 cells per production run | $55,000 | Gas evolution onset and metal crossover | Low exposure with complete failure prevention |
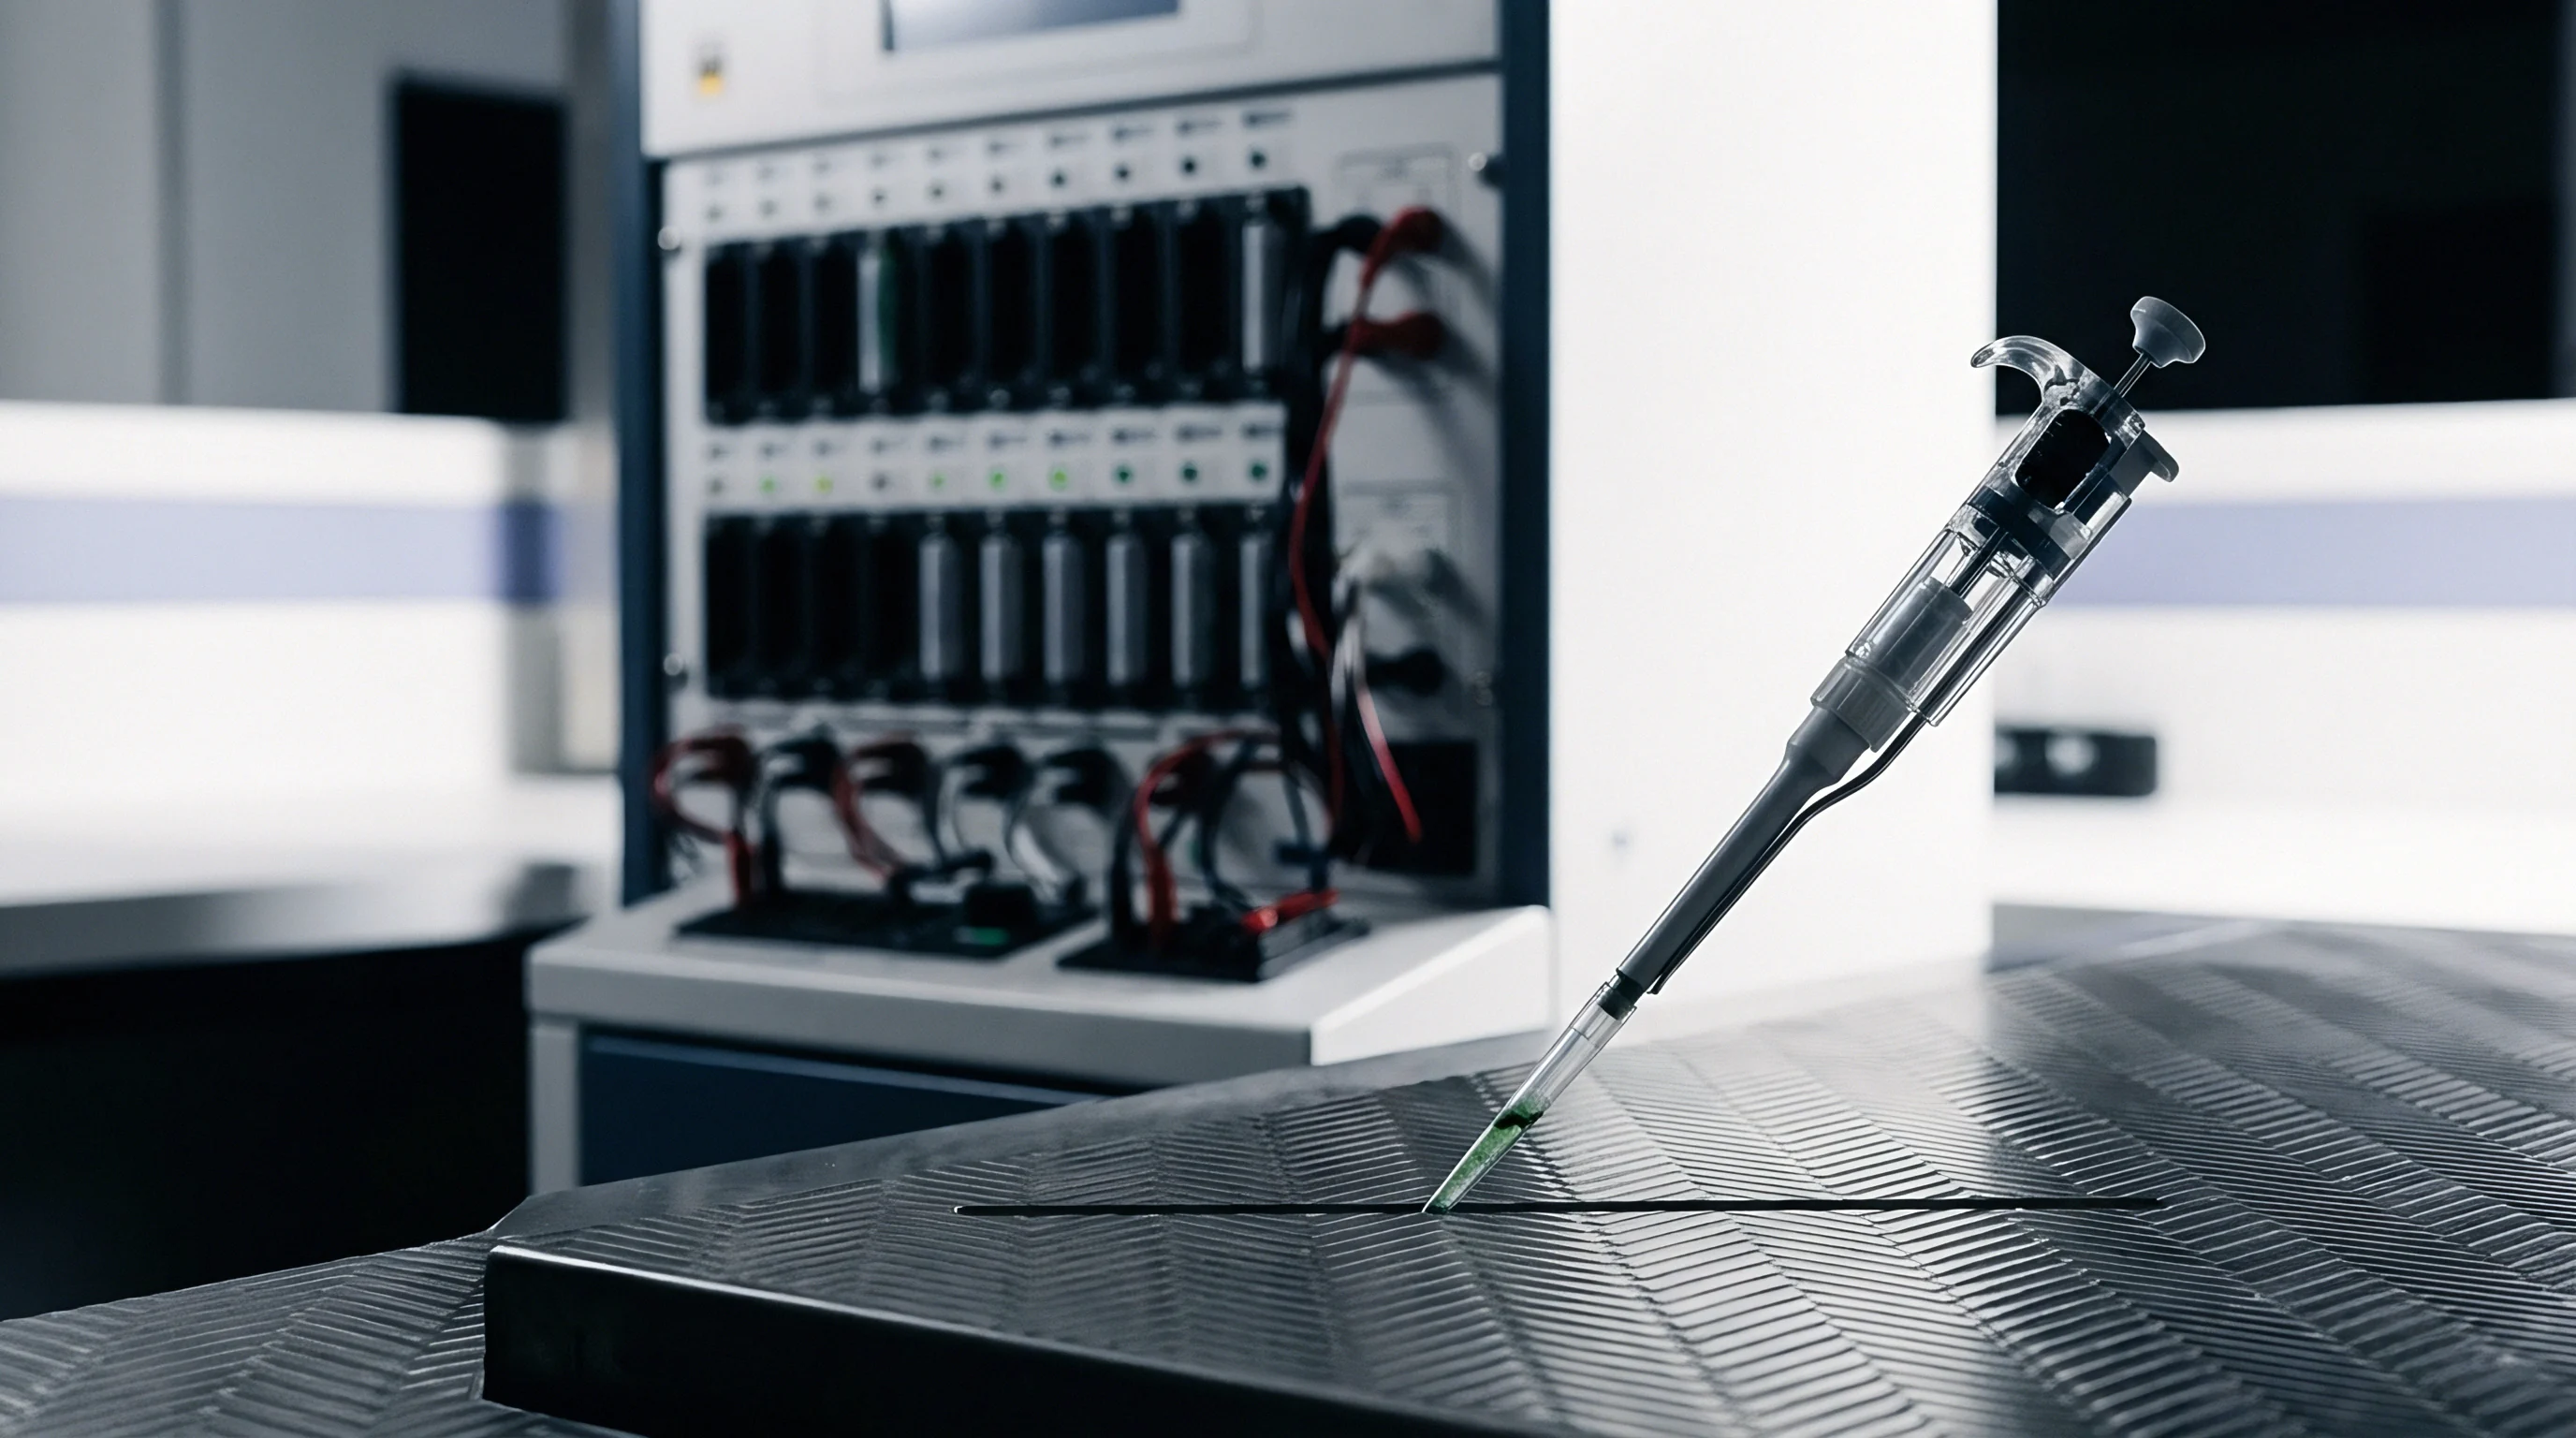
Warranty Exposure and Landed Risk Calculations
Contractual liabilities shift to cell suppliers when incoming quality audits detect unpassivated cathode surfaces before pack integration. Procurement contracts define explicit failure thresholds for interphase resistance growth. Exceeding agreed resistance metrics triggers warranty compensation clauses.
Validated analytical documentation provides unambiguous evidence during supplier dispute settlement proceedings.
Landed cost calculations incorporate regulatory delay penalties driven by incomplete safety documentation. Border customs authorities hold battery shipments lacking valid UN 38.3 test summaries. Demurrage charges at ocean freight terminals accrue rapidly, adding thousands of dollars in daily container storage costs.
Thorough diagnostic documentation prevents regulatory delays, securing scheduled delivery timelines and protecting project operating margins.
Systematic incoming characterization establishes clear audit trails that resolve supplier liability disputes before defective cell lots enter module production lines.