Receiving Dock Screening Protocols for Stored Prismatic Lithium Battery Lots
Receiving screening of stored prismatic lithium lots requires thermal stabilization, sub-millivolt OCV drift tracking, and clamped DCIR metrology to catch self-discharge and swelling defects.

Dock
Freight containers arriving from overseas cell production facilities carry hidden thermal and mechanical history. Unloading palletized prismatic lithium cells demands immediate non-destructive screening before ocean freight shipments enter warehouse storage locations. Receiving inspection starts at the moment container seals break, long before electrical test leads touch cell terminals.
Physical stress, moisture accumulation, and unrecorded temperature excursions during maritime transit degrade internal cell structures without leaving obvious signs on external cardboard packaging.
Uncontrolled environmental conditions during transport alter solid-electrolyte interphase layers and accelerate self-discharge rates. Receiving bay protocols establish clear baselines for freight condition, pallet integrity, and thermal equilibrium prior to electrical metrology.

Pallet Inspection and Environmental Arrival Verification
Shipment documentation must match physical box markings, batch numbers, and quantity manifest entries. Outer wooden crates and corrugated paper cartons require immediate inspection for structural deformation, crush damage, moisture stains, and breached tamper seals. Shock indicators and tilt sensors mounted on crate exteriors reveal whether pallets experienced mechanical impacts exceeding rated g-force thresholds during handling or ocean transit.
Damaged crates signal potential internal defects. When external indicators show activation or physical damage, inspectors mark the affected pallet for isolation and priority evaluation. Moisture absorption into cardboard packaging creates conductive pathways between stacked crates, increasing surface leakage currents and risking localized terminal shorting during long-term storage.

Thermal Imaging and Container Ingress Screening
Infrared thermography provides rapid identification of thermal anomalies across stacked cell crates upon opening container doors. Thermal cameras calibrated against blackbody sources prior to opening container doors ensure accurate temperature baselines. Scanning pallet surfaces identifies localized heating caused by internal micro-shorts or active thermal reactions within individual cells buried inside dense packaging configurations.
Pallets arriving from winter transit or cold-chain shipping show artificially low open-circuit voltage readings due to temperature-dependent chemical kinetics. Standard operating procedures dictate holding incoming pallets in a temperature-controlled stabilization zone at twenty-three degrees Celsius for twenty-four hours to achieve thermal equilibrium across all inner packaging layers before conducting open-circuit voltage metrology.
Palletized prismatic cells stored below fifteen degrees Celsius display artificial voltage depression that normalizes only after twenty-four hours of thermal equalization.
The table below summarizes mandatory freight intake verification parameters and critical failure thresholds for incoming shipments of stored prismatic lithium battery lots.
| Inspection Parameter | Measurement Tool | Acceptance Criteria | Action Limit |
|---|---|---|---|
| Container Ingress Ambient Temperature | Calibrated Data Logger | 15°C to 25°C | Excursions above 45°C or below -10°C |
| Pallet Surface Thermal Uniformity | Handheld FLIR Imager | Delta-T under 2.0°C across pallet | Hotspots exceeding 3.5°C above ambient |
| Mechanical Impact Indicator | Drop-N-Tell / ShockWatch | Unactivated status | Activated indicator above 25g threshold |
| Package Moisture Content | Pinless Moisture Meter | Below 12% relative humidity | Moisture levels exceeding 18% |
Standardized procedures enforce systematic intake steps for every incoming shipment of prismatic lithium battery inventory.
- Verify container seal numbers against ocean bill of lading and customs declarations.
- Capture high-resolution infrared thermal images of the interior freight space immediately upon opening container doors.
- Inspect external pallet tilt and shock indicators for mechanical impact activation.
- Check outer packaging cardboard for physical crushing, liquid staining, or seal tampering.
- Record pallet surface temperatures across top, middle, and bottom crate layers.
- Move verified pallets into the thermal stabilization zone for twenty-four hours of temperature equalization.
Transient temperature spikes in freight holds can cause anomalous voltage drops even when internal electrode structures remain intact.
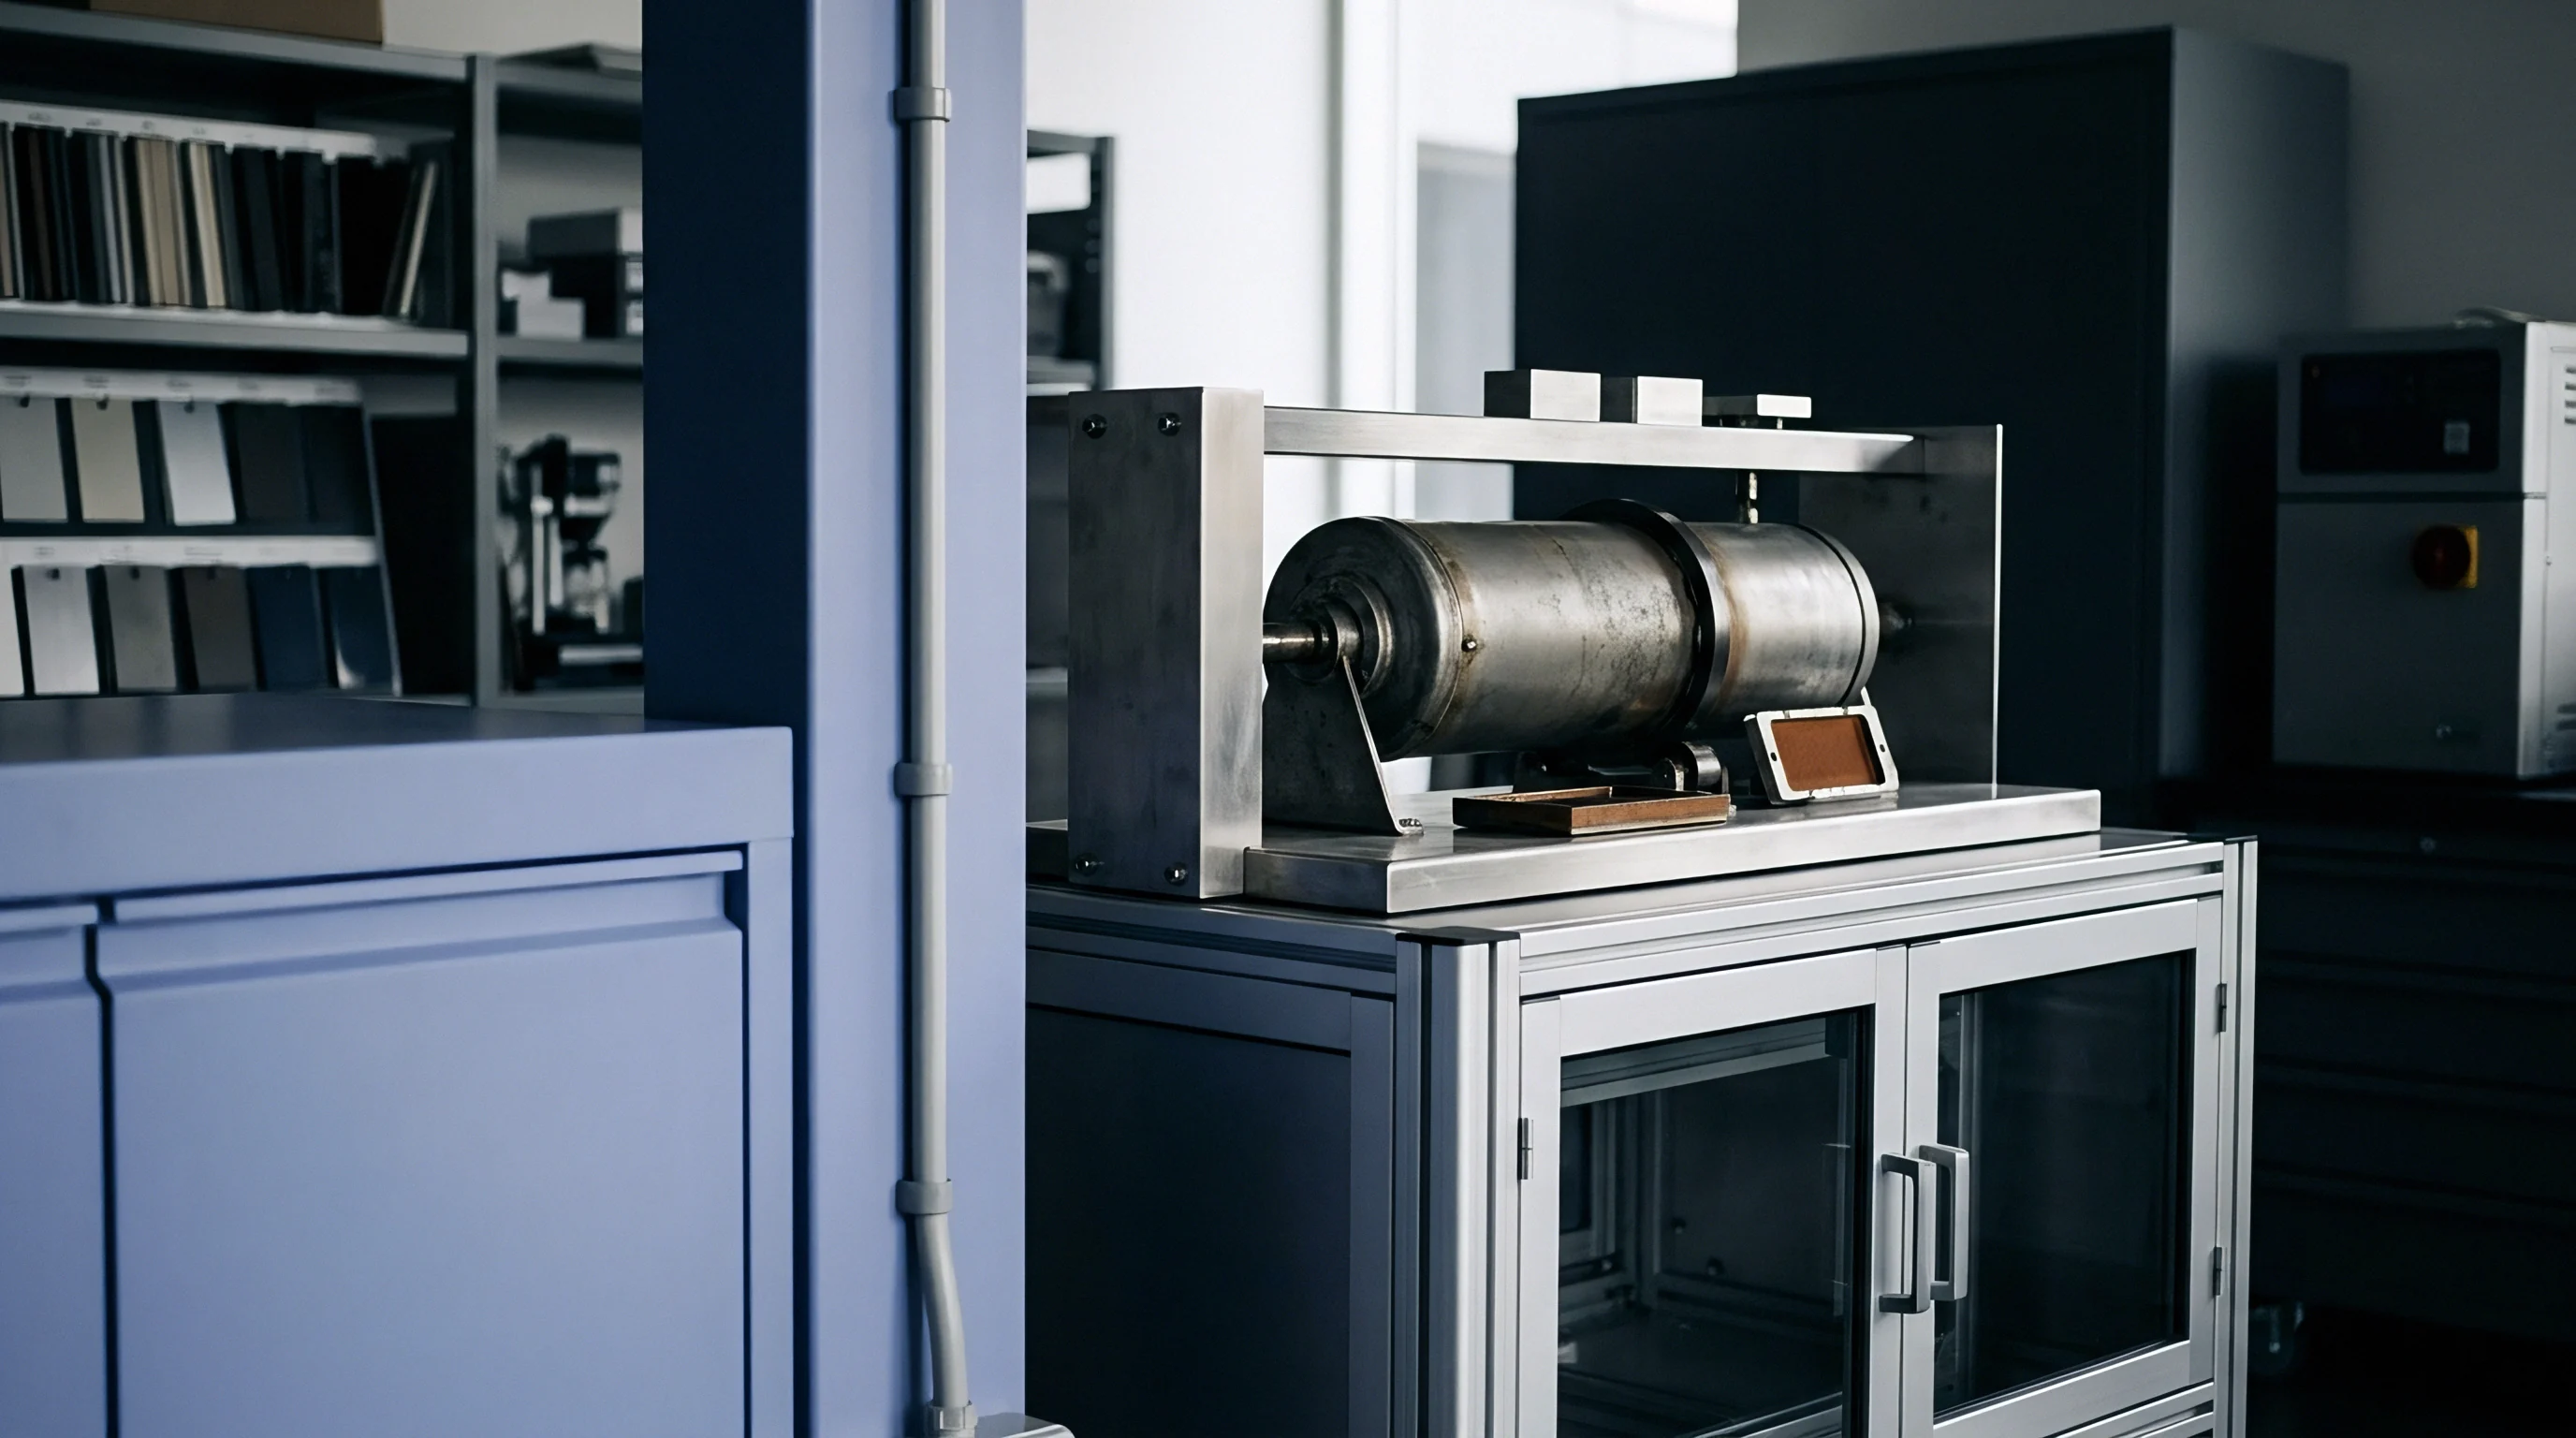
Voltage
Open-circuit potential remains the primary non-destructive indicator of self-discharge behavior in stored prismatic inventory. Precision voltage screening at the intake bay identifies cells suffering from internal micro-short circuits, active parasitic side reactions, or manufacturing defects in separator insulation. Evaluating cell potential across large stored lots requires instruments capable of sub-millivolt accuracy to distinguish normal thermodynamic relaxation from abnormal electrochemical decay.
Lithium iron phosphate and nickel manganese cobalt chemistries present distinctly different open-circuit potential profiles during storage, demanding chemistry-specific screening limits during intake metrology.

Open Circuit Potential Decay Metrics
Measuring cell potential requires calibrated six-and-a-half digit digital multimeters connected through four-wire Kelvin test leads. Contact resistance between probe tips and aluminum terminal posts introduces measurement errors if uncompensated. Probes must penetrate protective oxide layers on aluminum terminal surface pads without causing mechanical deformation or structural damage to terminal threads.
Electrochemical potential varies with temperature according to the Nernst equation and entropy changes within electrode materials. Standard screening protocols convert measured open-circuit voltage to equivalent values at twenty-five degrees Celsius using chemistry-specific temperature coefficients. Lithium iron phosphate cells display extremely flat open-circuit voltage curves between twenty percent and ninety percent state of charge, making small voltage shifts highly significant for detecting capacity loss or self-discharge anomalies.
Tracking open-circuit voltage over a fourteen-day baseline period isolates cells with elevated self-discharge rates caused by iron contamination, copper dendrite growth, or separator punctures. Normal self-discharge for stored lithium iron phosphate prismatic cells falls below zero point zero five millivolts per day at room temperature.

Self Discharge Rate Modeling for Stored Lithium Chemistries
Self-discharge mechanisms divide into reversible and irreversible components during extended warehouse storage. Reversible self-discharge stems from transient side reactions that disappear upon subsequent charge cycling. Irreversible self-discharge results from active material loss, solid-electrolyte interphase growth, or continuous consumption of lithium ions through internal short circuits.
Thermodynamic instability drives potential decay in nickel manganese cobalt cells stored at high states of charge. Higher storage voltages accelerate transition metal dissolution and electrolyte oxidation at the cathode interface. Storing prismatic cells at fifty percent state of charge minimizes structural degradation of transition metal oxides while preserving sufficient potential for accurate self-discharge tracking.
A LiFePO4 prismatic cell exhibiting an open-circuit voltage drop exceeding two millivolts per month at twenty-five degrees Celsius indicates internal micro-short circuiting from separator degradation.
The table below provides comparative metrics for potential decay, self-discharge behavior, and screening tolerances across standard stored prismatic cell chemistries.
| Chemistry Type | Nominal Storage SoC | OCV Range at 50% SoC | Max Allowable Delta-V (14 Days) | Micro-Short Threshold |
|---|---|---|---|---|
| LiFePO4 (LFP) | 30% – 50% | 3.280 V – 3.300 V | 0.7 mV | > 0.10 mV/day |
| NMC 622 | 40% – 50% | 3.720 V – 3.760 V | 2.5 mV | > 0.35 mV/day |
| NMC 811 | 30% – 40% | 3.680 V – 3.720 V | 3.8 mV | > 0.50 mV/day |
| LTO (Titanate) | 40% – 60% | 2.220 V – 2.260 V | 0.3 mV | > 0.05 mV/day |
Structural validation of incoming battery batches follows a rigorous screening workflow to identify self-discharge outliers.
- Open-Circuit Voltage Precision Screen measures baseline potential using four-wire Kelvin connections compensated for ambient temperature variations.
- Delta-V Time Series Analysis calculates daily potential decay rates over a fourteen-day holding interval to identify internal self-discharge trends.
- Batch Median Shift Comparison flags individual cells whose potential strays more than three standard deviations from the lot average.
- State-of-Charge Equivalent Conversion maps measured voltage back to estimated remaining capacity using reference relaxation curves.
- Thermal Sensitivity Correction adjusts raw potential readings to standard twenty-five degrees Celsius reference conditions using chemical temperature coefficients.
Cells exhibiting uniform potential decay across identical storage conditions present far lower risk than outliers that diverge from batch median values.

Clamp
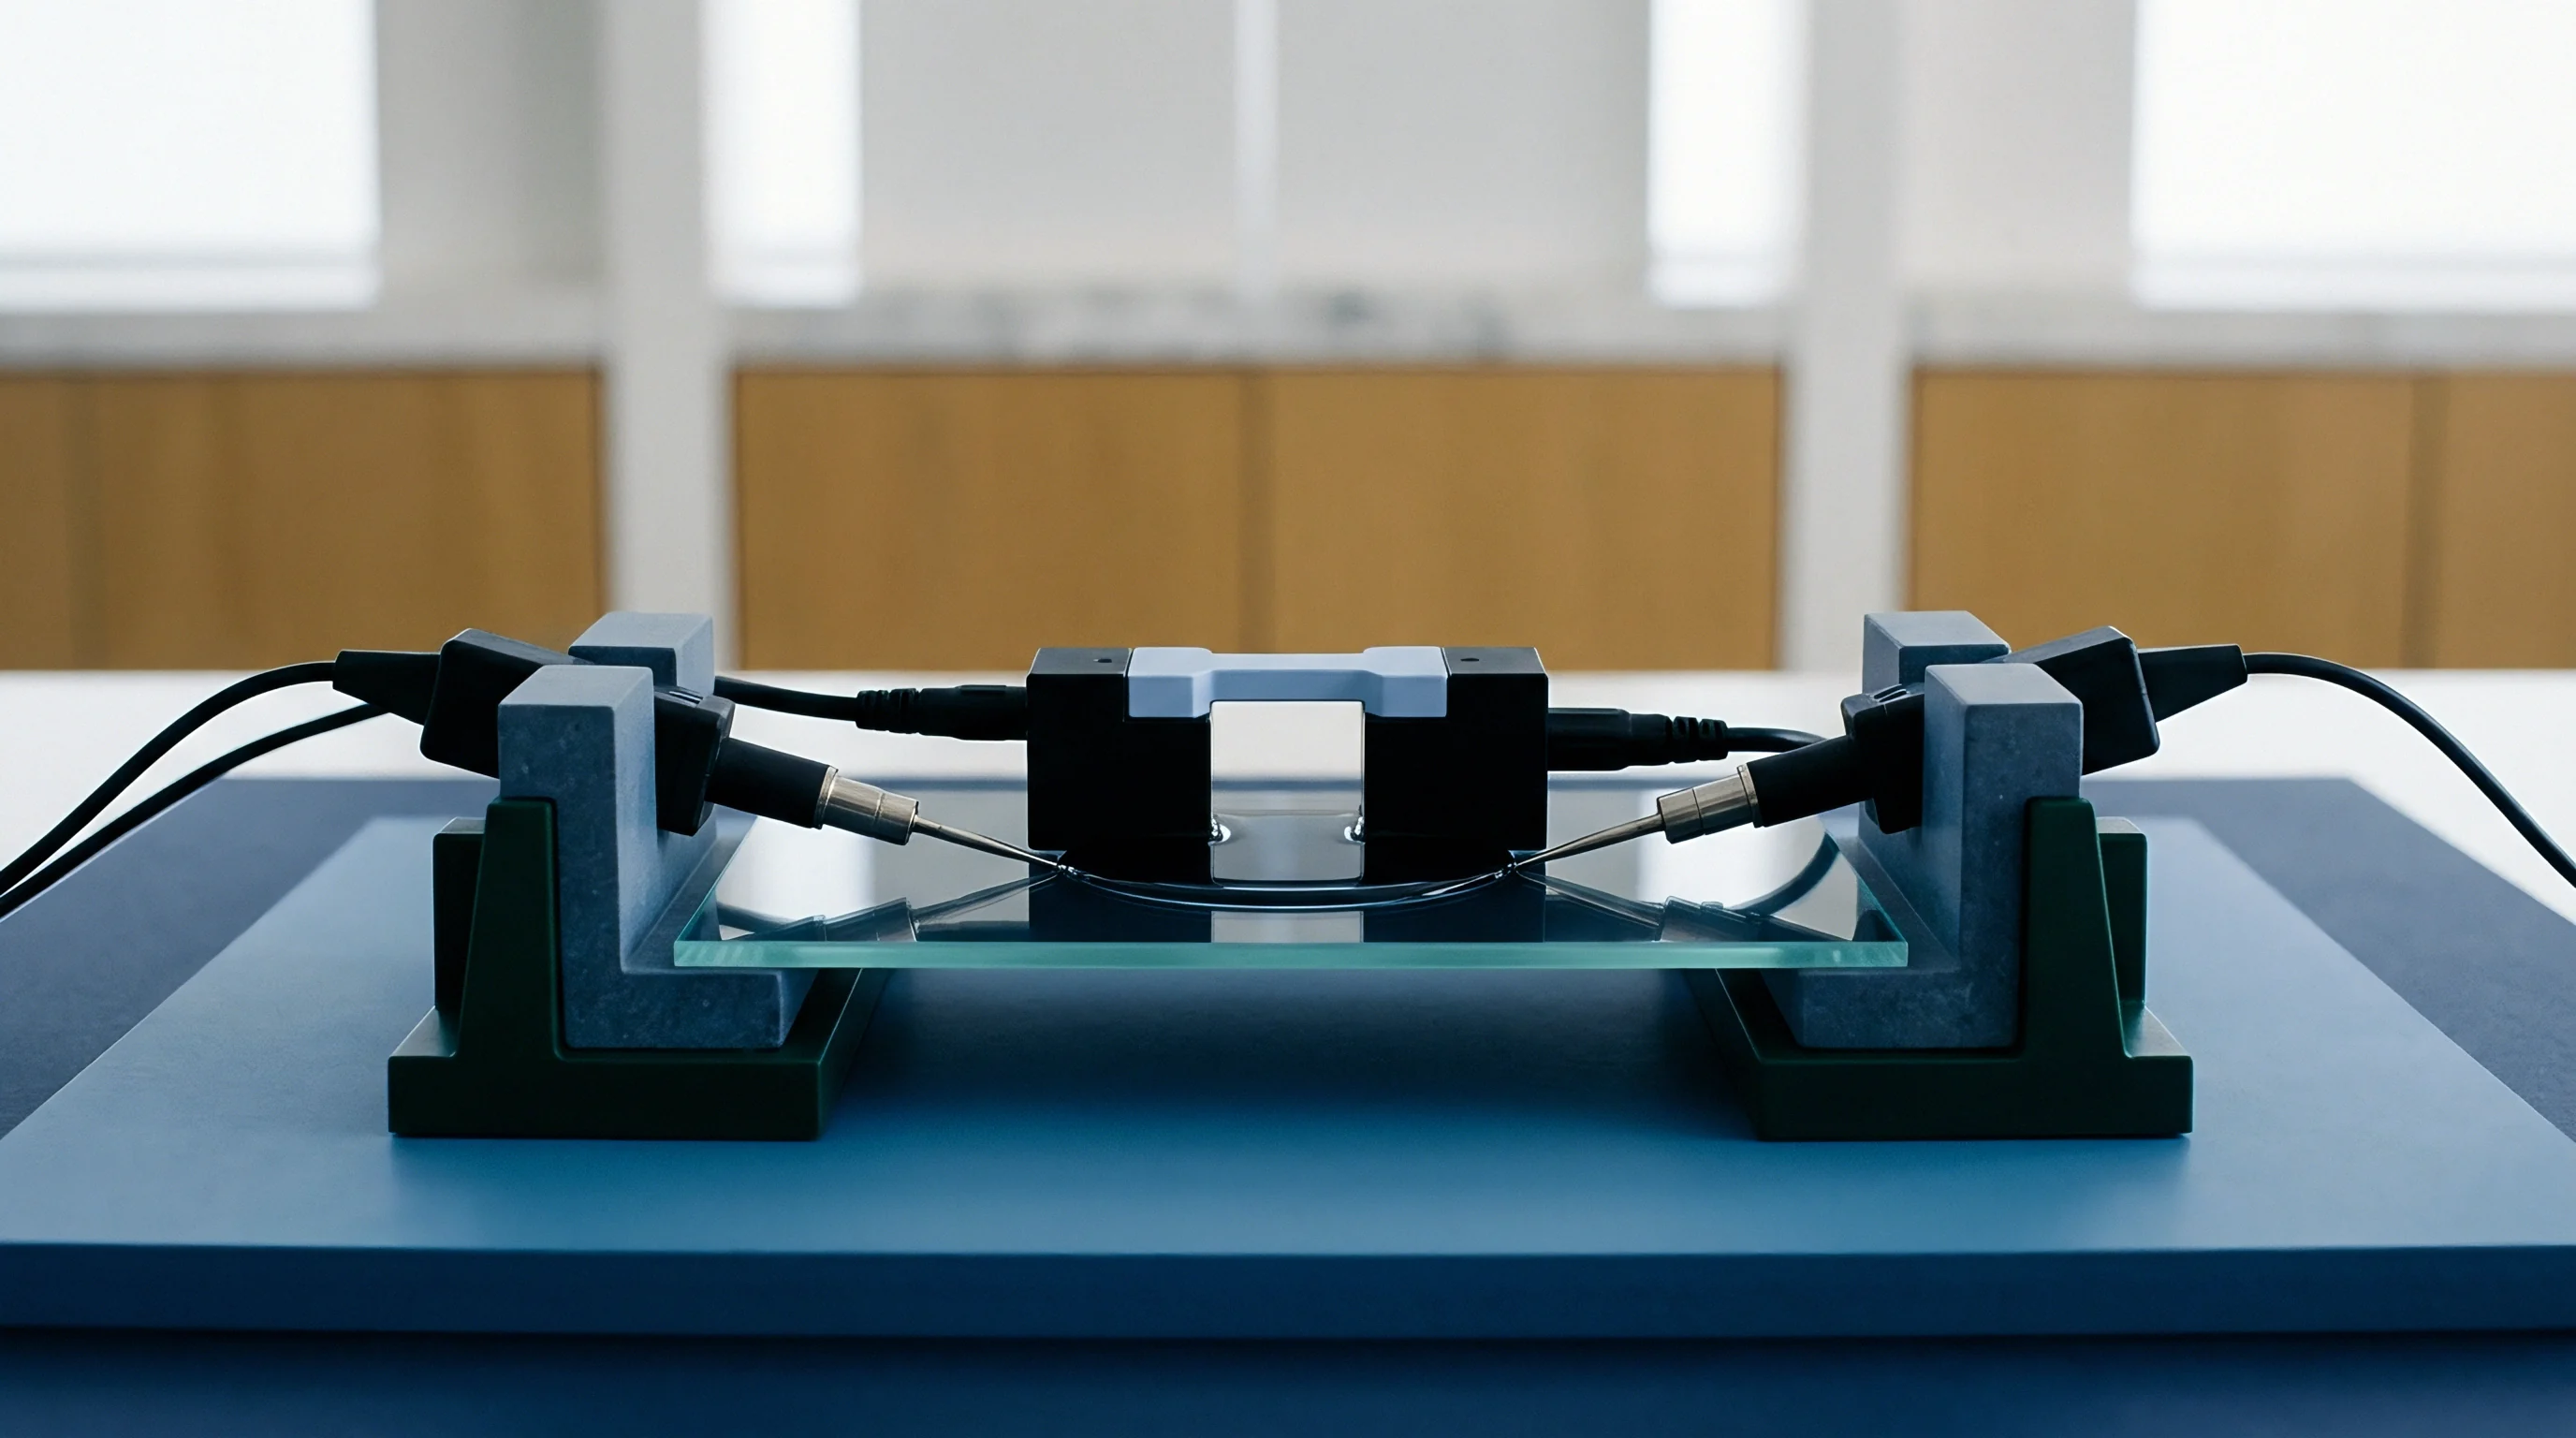
Prismatic cell architecture relies on mechanical containment to prevent electrode delamination during electrochemical cycling and passive storage. Aluminum housing covers expand when internal gas pressure accumulates or graphite anodes undergo irrecoverable solid-electrolyte interphase thickening. Measuring mechanical dimensions under specified fixture loads isolates structural swelling from harmless elastic gas expansion.
Screening protocols must evaluate both alternating-current impedance and direct-current resistance under controlled mechanical restraint to obtain valid electrochemical measurements.

Do Swollen Prismatic Cans Recover under Compression?
Aluminum housing dimensions expand when internal gas pressure accumulates or graphite anodes undergo irrecoverable solid-electrolyte interphase thickening. Mechanical compression applied via calibrated spring-loaded fixtures forces trapped gas back into electrolyte solution or relocates internal gas pockets toward cell headers, partially restoring thickness dimensions. Structural degradation of internal current collectors and anode delamination remains permanent even under extreme mechanical clamping force.
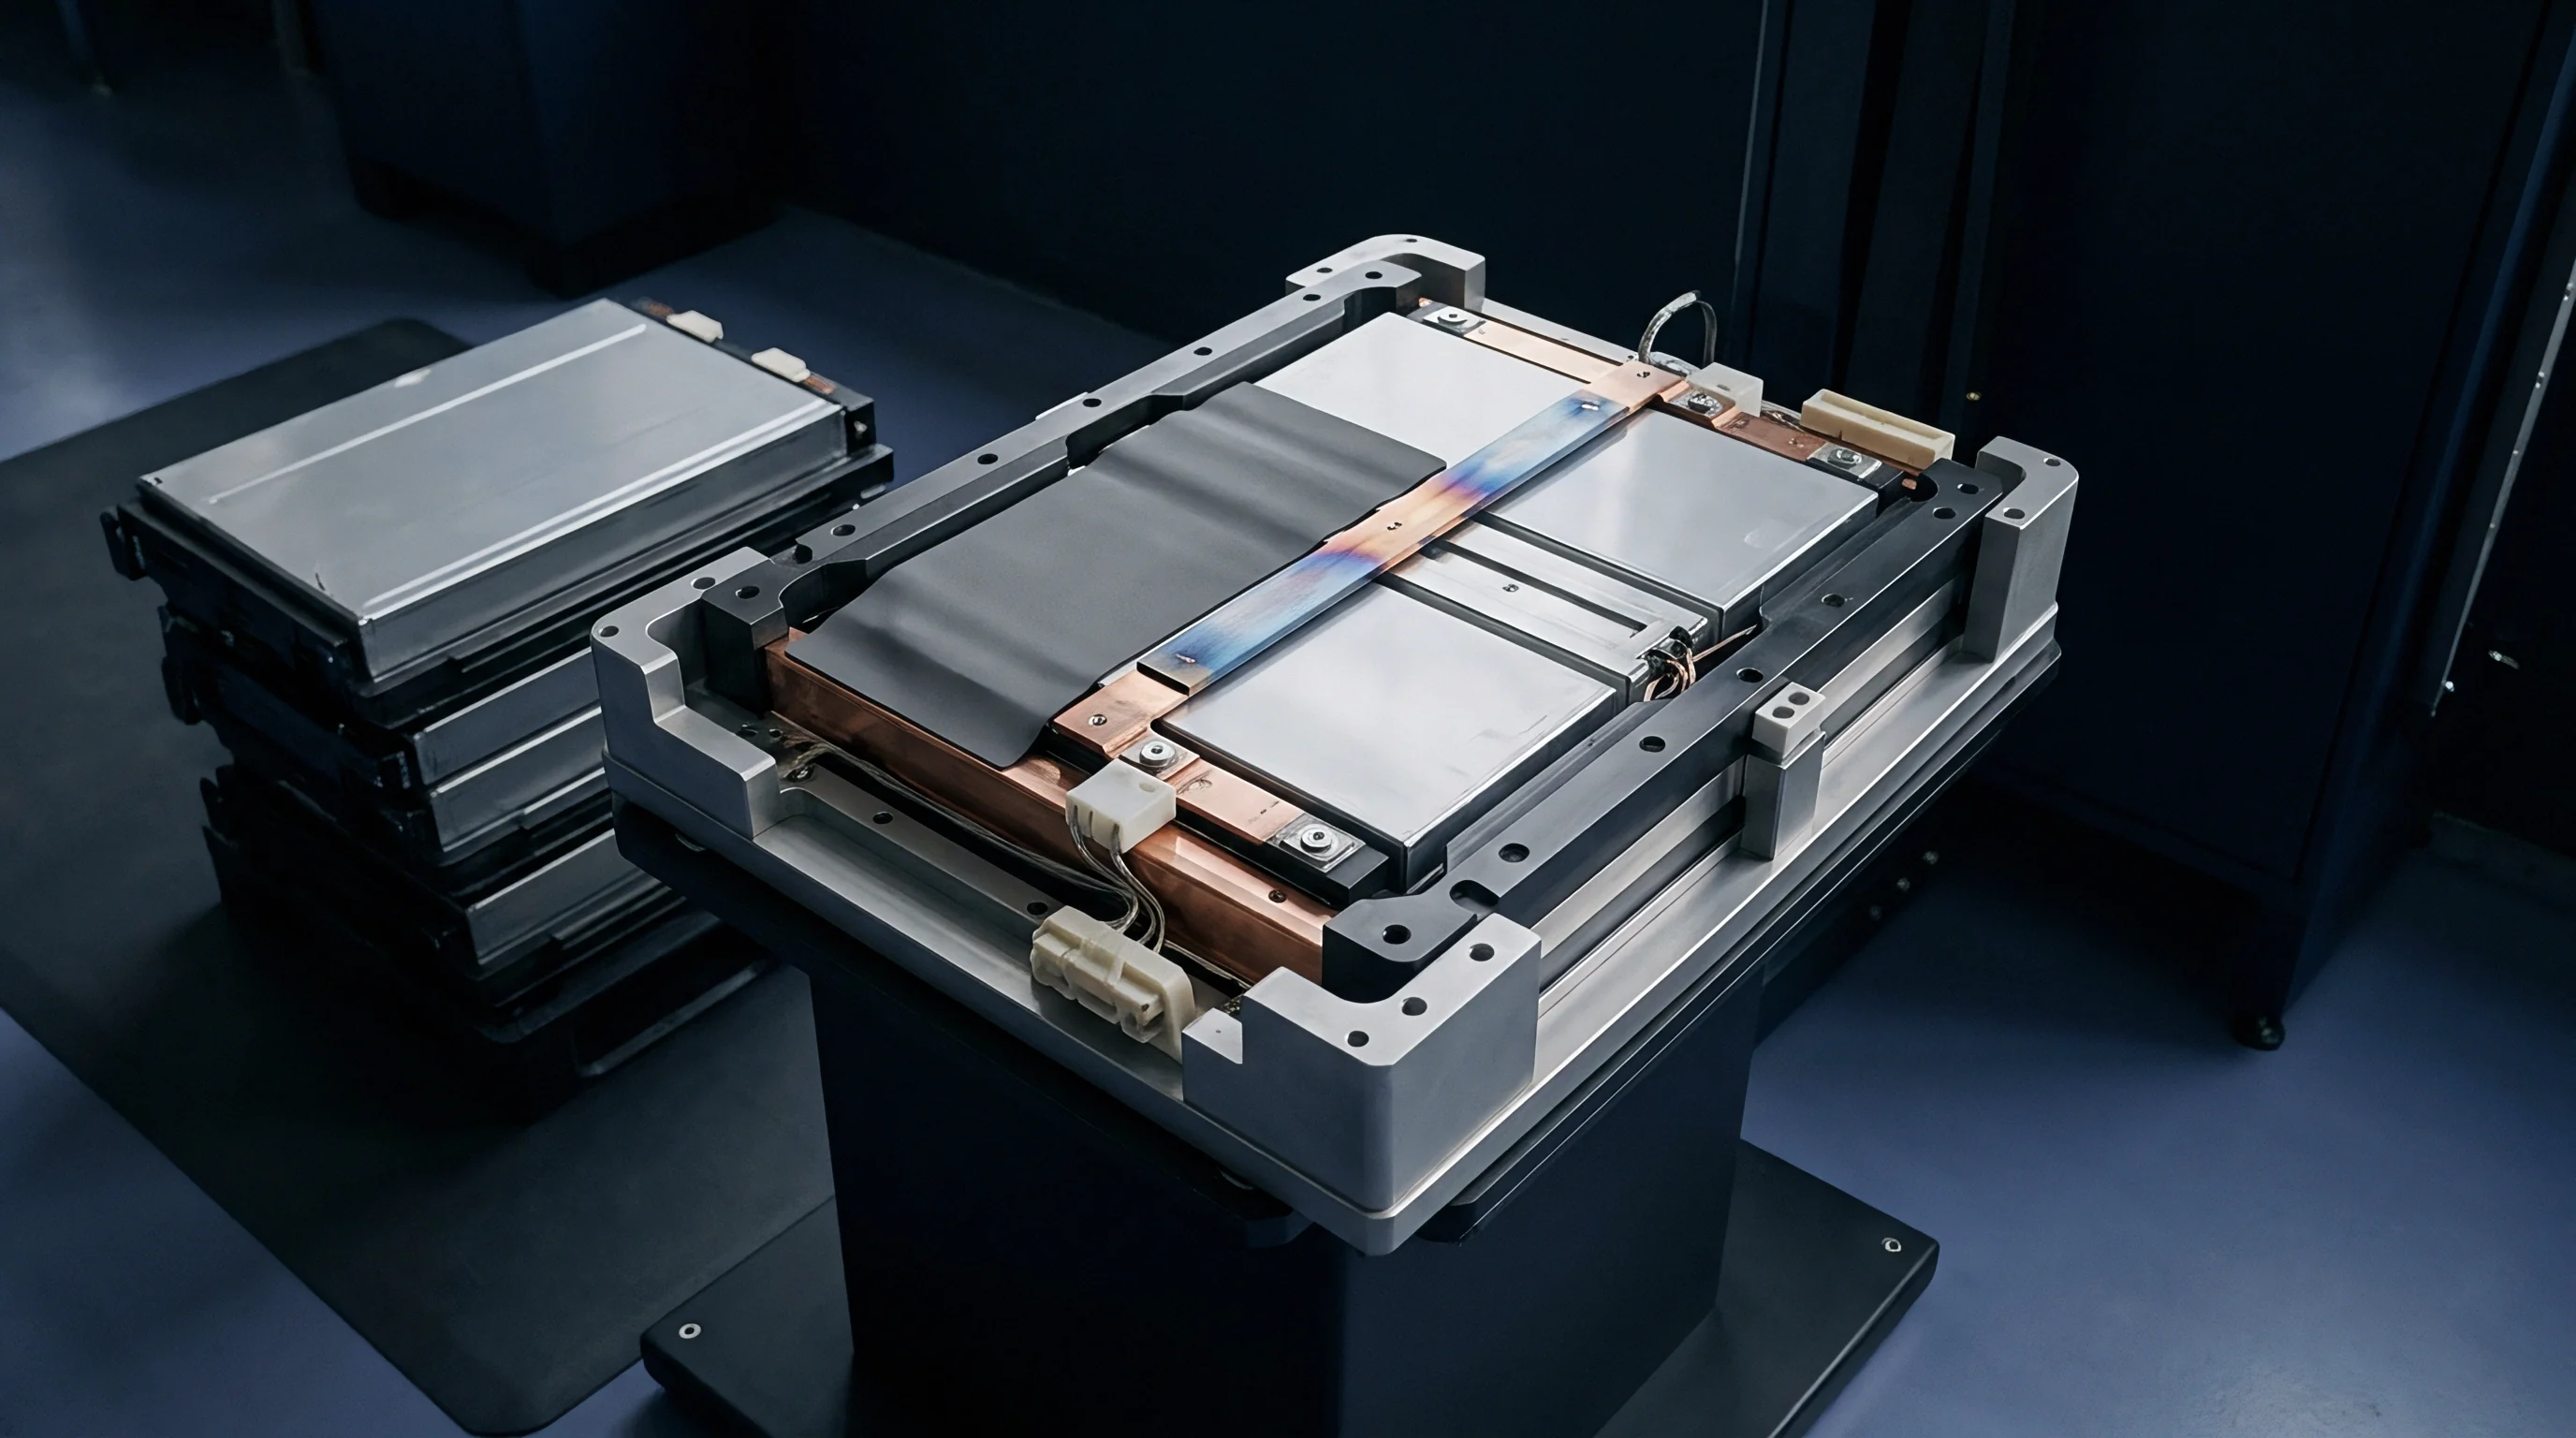
Measuring cell thickness requires digital micrometer bridges mounted on rigid granite surface plates. Fixture clamps apply standardized mechanical pressure, typically zero point three megapascals, matching nominal pack integration compressive loads. Unconstrained thickness measurements yield erratic results because flexible aluminum can walls bulge outward under slight internal pressure variations.
Measuring thickness under active mechanical compression and comparing uncompressed dimensions against compressed figures reveals the ratio of gas pouch formation to solid electrode expansion. Thickness increases exceeding one point five percent over baseline factory specifications indicate advanced electrolyte decomposition or internal delamination.

Impedance Spectrometry and Mechanical Swell Measurement
Alternating-current impedance testing at one kilohertz provides rapid assessment of cell ohmic resistance, tab weld integrity, and electrolyte conductivity. Four-point AC milliohm meters apply a small sinusoidal current signal across cell terminals, measuring real and imaginary impedance components without altering cell state of charge. Ohmic resistance increases indicate collector tab degradation, electrolyte dry-out, or terminal weld corrosion occurring during storage.
Direct-current internal resistance pulse testing measures charge-transfer resistance and mass transport limitations inside electrode structures. Applying a high-current discharge pulse, typically one C-rate for ten seconds, measures immediate voltage drop divided by applied current. Elevated charge-transfer resistance points to thick solid-electrolyte interphase layer formation, surface passivation, or cathode particle cracking induced by environmental stress during storage.
Compliance with IEC 62660-2 clause 6.2 invalidates cell warranty claims if receiving inspection testing omits mechanical fixture loading equivalent to baseline pack restraint.
The table below summarizes mechanical thickness tolerances, alternating-current resistance bounds, and direct-current pulse resistance limits for standard prismatic formats.
| Cell Capacity Format | Nominal Thickness | Max Allowable Swell (0.3 MPa) | 1 kHz AC Resistance Limit | 10s DCIR Limit (50% SoC) |
|---|---|---|---|---|
| 100 Ah Prismatic (LFP) | 38.0 mm | + 0.6 mm | < 0.45 mΩ | < 0.85 mΩ |
| 280 Ah Prismatic (LFP) | 71.5 mm | + 1.1 mm | < 0.18 mΩ | < 0.32 mΩ |
| 150 Ah Prismatic (NMC) | 45.0 mm | + 0.7 mm | < 0.35 mΩ | < 0.65 mΩ |
| 300 Ah Prismatic (NMC) | 72.0 mm | + 1.2 mm | < 0.15 mΩ | < 0.28 mΩ |
Detecting structural and electrochemical defects in stored lots requires systematic screening across physical and electrical parameters.
- Mechanical Swell Distortion manifests as permanent aluminum housing dimensional expansion caused by anode thickening or gas generation.
- Terminal Weld Corrosion creates erratic alternating-current resistance readings due to atmospheric oxidation on exposed terminal contact faces.
- Electrolyte Dry-Out raises ohmic resistance values by depleting ionic transport pathways between separator membranes and active materials.
- Solid-Electrolyte Interphase Growth increases direct-current charge-transfer resistance by consuming active lithium ions during extended storage.
- Separator Membrane Puncture triggers localized micro-shorting, lowering open-circuit potential while causing localized thermal elevation.
Omitting baseline mechanical compression during impedance testing yields inaccurate resistance values that result in rejected warranty claims and early pack failure.


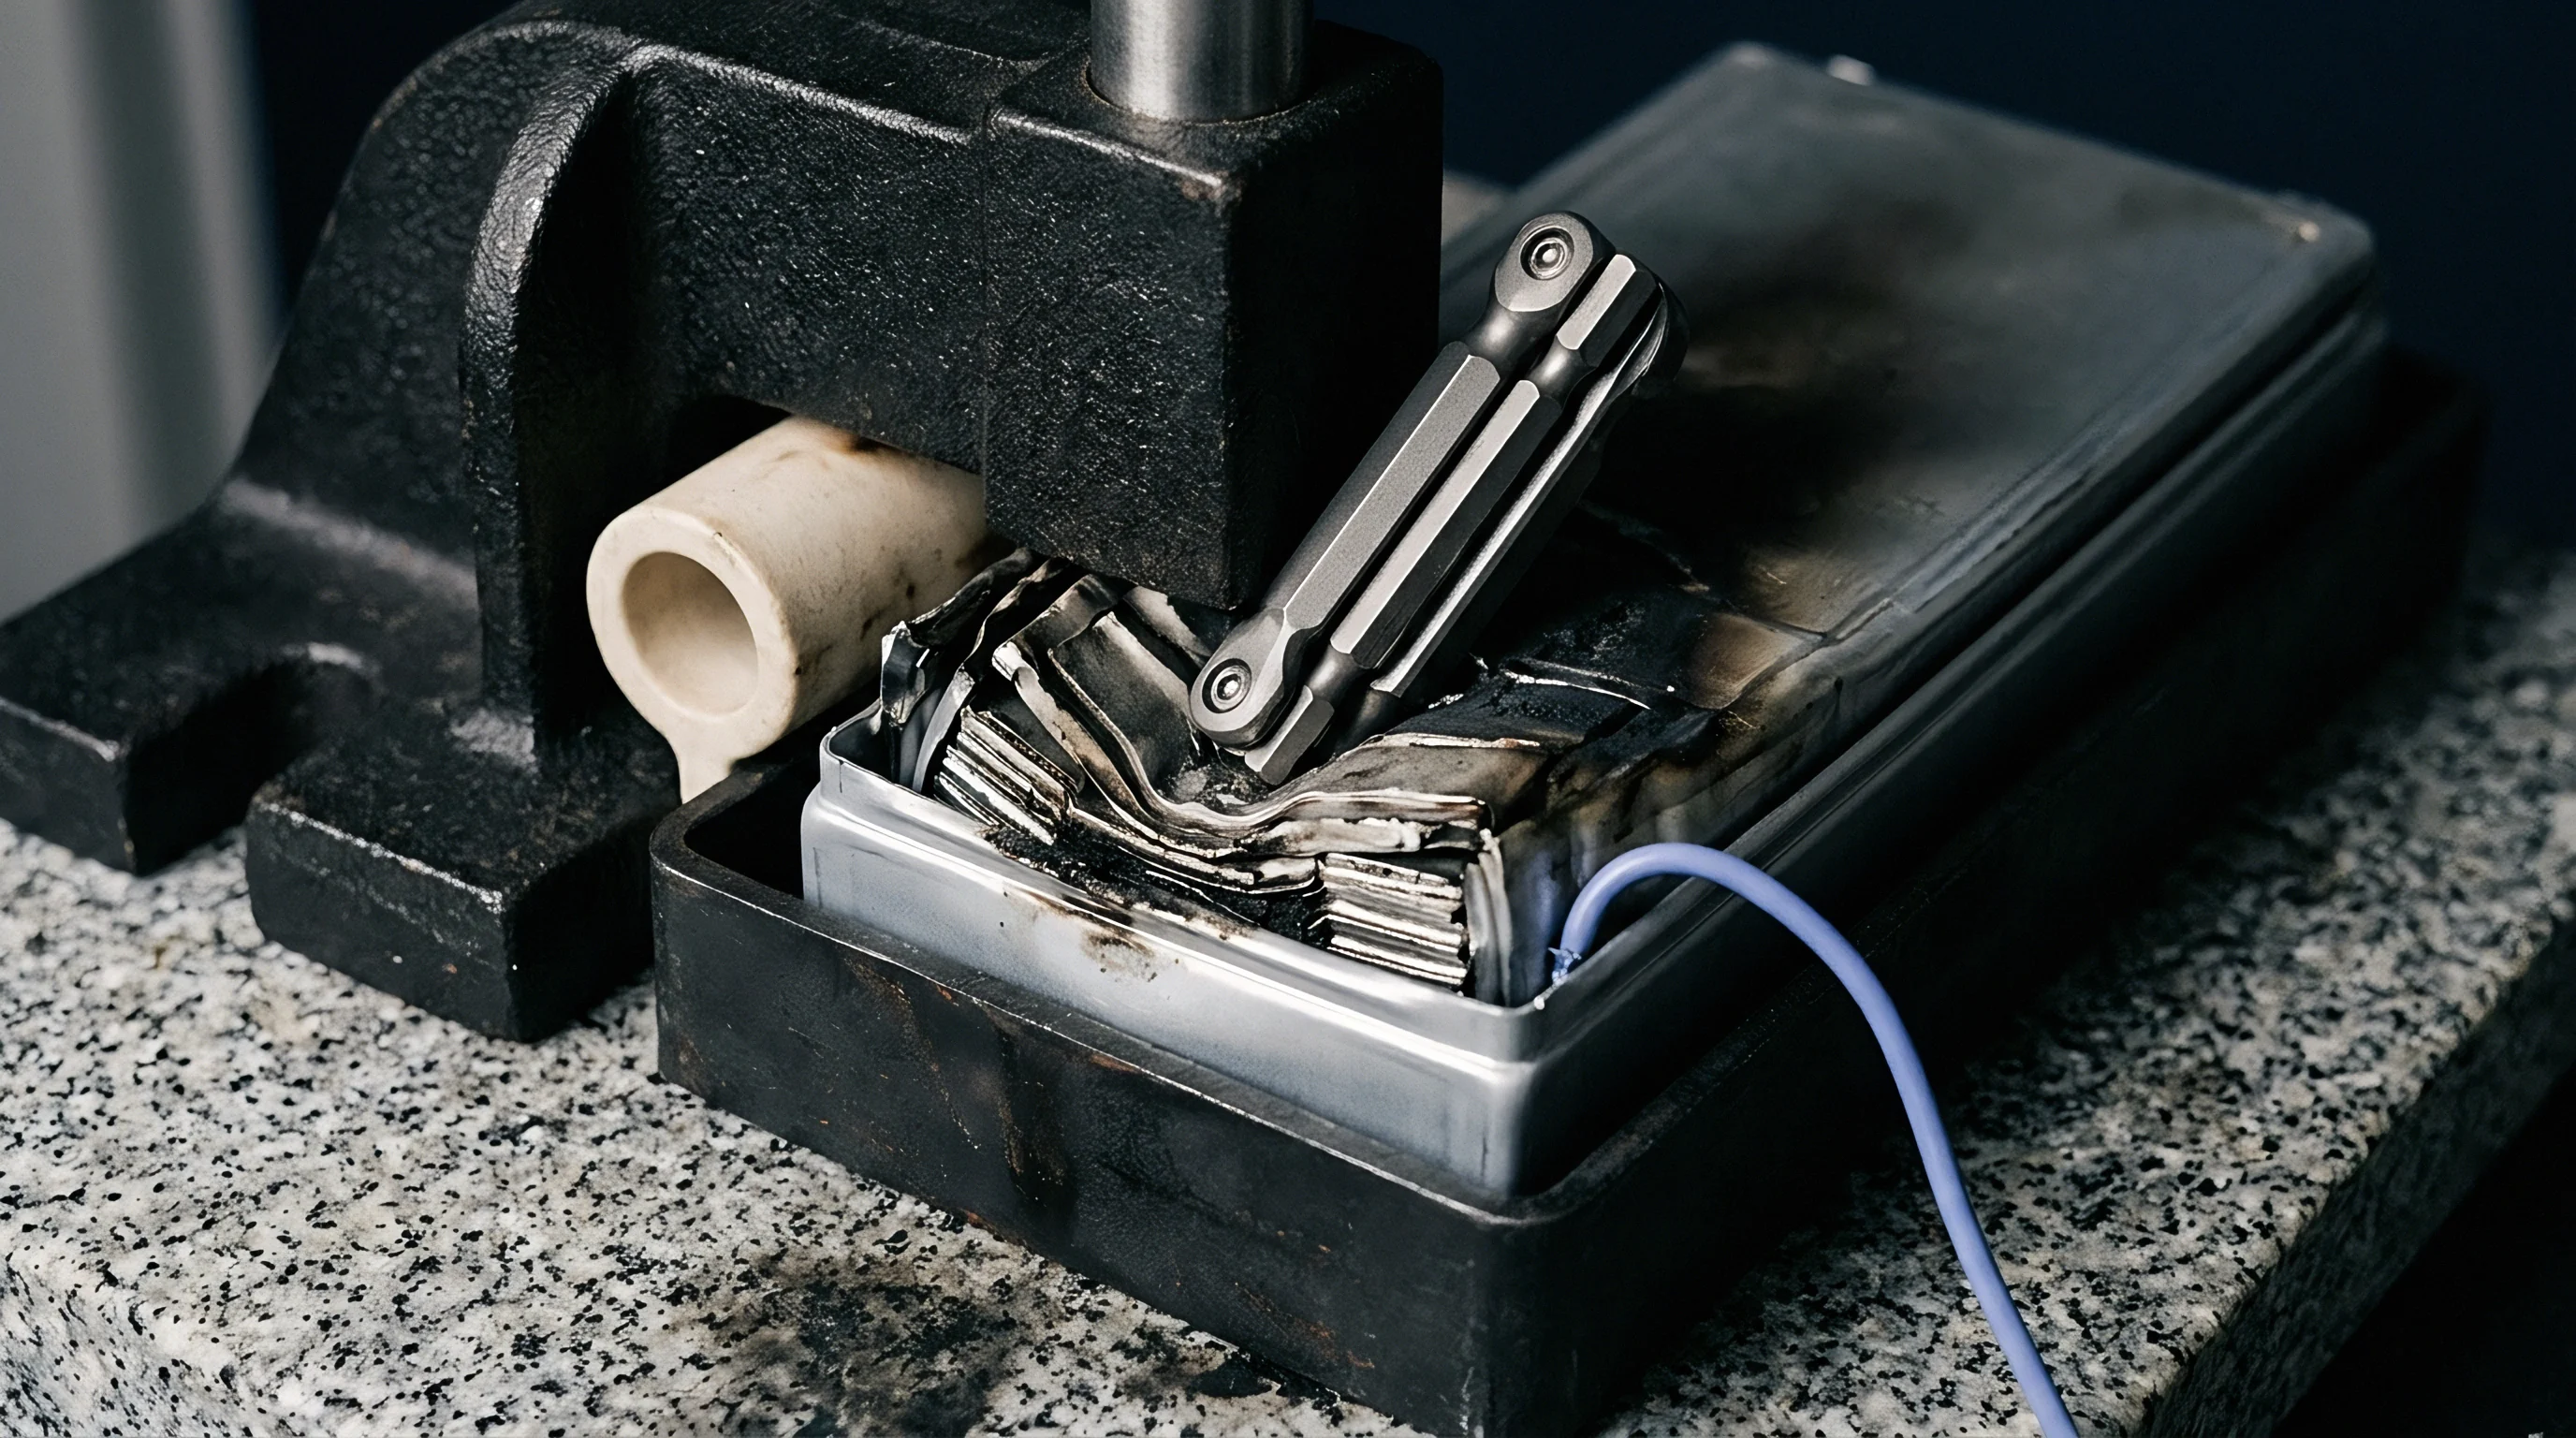
Quarantine
Holding suspected inventory in an isolated environmental chamber prevents cascading thermal events across warehouse bays. Cells displaying abnormal potential decay, mechanical swelling, or elevated internal resistance require immediate transfer out of main storage locations into secondary containment zones. Receiving protocols define strict criteria for quarantining sub-standard lots while preserving physical evidence for vendor defect claims.
Quarantine bays incorporate specialized gas monitoring, fire suppression systems, and environmental control equipment to manage high-risk cells safely.

Isolation Protocols for out of Spec Cell Batches
Quarantine facilities operate isolated environmental controls separate from main warehouse HVAC systems. Physical separation demands minimum five-meter spacing between quarantined cell pallets, backed by fire-rated steel barriers designed to contain thermal runaway propagation. Quarantined pallets sit on non-combustible steel racks equipped with integrated load cells to detect sudden weight loss caused by electrolyte leakage or venting.
Dedicated carbon monoxide detectors mounted above every storage rack provide continuous monitoring. Gas sampling checks volatile organic compound concentrations, hydrogen gas levels, and carbon monoxide presence to provide early warning of cell degradation or micro-venting events. Atmospheric changes trigger automated nitrogen purge systems and lower room ambient temperatures to suppress exothermic reaction kinetics.
Gaseous off Gas Monitoring and Destructive Sampling
Off-gas analysis identifies specific chemical species released by failing prismatic cells. Dimethyl carbonate, ethyl methyl carbonate, and diethyl carbonate vaporize when internal cell temperatures exceed electrolyte boiling points during localized micro-shorting. Gas chromatography coupled with mass spectrometry identifies trace solvent vapors long before visible thermal runaway occurs.
Destructive physical teardown sampling provides definitive confirmation of degradation mechanisms inside quarantined cells. Extracting electrode samples inside argon-filled gloveboxes allows microscopic inspection of anode surface plating, separator breakdown, and cathode cracking. Scanning electron microscopy combined with energy-dispersive X-ray spectroscopy confirms whether elevated self-discharge stems from metallic dendrite growth or chemical impurity contamination introduced during production.
Isolating questionable inventory at the first sign of off-gas detection costs far less than remediating a thermal runaway propagation event across stored pallets.
Documenting quarantined inventory requires comprehensive evidence packages to support legal and commercial disputes with cell suppliers.
- Chain of Custody Logbook records every physical movement, handler identity, and storage location transfer from dock arrival through quarantine.
- Calibrated Metrology Time-Series captures automated open-circuit voltage, internal resistance, and surface temperature readings taken at hourly intervals.
- Gas Chromatograph Vapor Reports document volatile organic compound signatures collected from quarantine bay headspace gas sampling ports.
- High-Resolution Photographic Dossier preserves clear visual documentation of mechanical swell, terminal corrosion, valve distortion, or cardboard staining.
- Supplier Compliance Cross-Reference links detected defect metrics directly to guaranteed contract specifications and international quality standards.
Incorporating standard safety clauses under UN 38.3 section 38.3.4 transfers financial liability back to the supplier when off-gassing occurs during post-transit storage.


Record
Data integration bridges physical measurement on the bay floor with commercial remedies under international purchase agreements. Screening protocols generate vast quantities of voltage, resistance, dimensional, and thermal data that must sync with supplier factory end-of-line grading records. Reconciling receiving metrology against original production records identifies lot degradation during transit, unauthorized cell regrading, or fraudulent batch swapping by intermediaries.
Factory grading sheets contain baseline values. Systematic ledger tracking ensures every cell entering warehouse stock meets specified performance guarantees.

Data Traceability and Batch Log Reconciliation
Prismatic aluminum cans feature laser-etched two-dimensional Data Matrix codes containing manufacturer identification, production plant location, line number, production date, and individual cell serial numbers. Scanning cell barcodes at receiving dock screening stations queries internal databases to match measured open-circuit voltage and internal resistance values against factory end-of-line birth certificates.
Discrepancies between factory birth certificates and dock metrology reveal degradation occurring after manufacturing. When lot data diverges from factory end-of-line records, buyers initiate formal commercial dispute procedures. Significant drops in open-circuit potential or jumps in internal resistance between factory gate release and dock receiving signal poor transit control, improper warehouse storage conditions, or extended delays in transit holds.

Landed Cost Recovery and Commercial Lot Claims
Landed cost calculations incorporate base cell purchasing price, international ocean freight fees, customs duties, dangerous goods transport surcharges, and receiving screening costs. Rejecting a sub-standard battery lot requires immediate commercial action to recover capital and prevent production delays. Automated ledger tracking generates formal non-conformance reports containing verified screening data, statistical outlier distributions, and quarantine logs.
Purchase contracts must define specific quality limits based on statistical sampling frameworks. Acceptable Quality Limit standards, typically AQL zero point one zero for critical safety defects and AQL zero point four zero for major performance defects, govern lot acceptance or rejection decisions. Demonstrating that a received lot exceeds allowable defect thresholds compels suppliers to refund full landed costs or provide replacement inventory under expedited air freight terms.
The industry still lacks a universal standard for determining whether subtle internal resistance growth during ninety-day storage stems from reversible passivation film growth or permanent electrolyte decomposition.