Contractual Impedance Limits and Microstructural Interphase Degradation Models in Commercial Lithium Energy Storage
Contractual impedance guarantees depend on ten-second DC resistance metrics, bridging microstructural interphase degradation models to commercial warranty enforcement.

Phase
In long-term stationary storage operations, lithium cell aging manifests primarily as internal impedance escalation. While capacity fade reduces total stored energy, internal resistance growth restricts power capability, increases thermal management loads, and limits usable round-trip energy efficiency. In commercial battery purchasing agreements, impedance limits establish the boundary between normal electrochemical wear and enforceable warranty defects.
Tracing the physical origin of resistance growth requires looking past high-level datasheet numbers to how internal boundary films evolve at the microstructural level.
Charge transport across active electrode surfaces relies on thin passivation films formed during initial formation cycles. On graphite anodes, the solid-electrolyte interphase acts as an electronically insulating yet ionically conductive membrane composed of inorganic species such as lithium fluoride and lithium carbonate alongside organic alkyl carbonates. As storage systems cycle, persistent electron tunneling through this interface decomposes solvent molecules, driving continuous interphase growth that forces lithium ions to navigate increasingly resistive pathways during intercalation.
Parasitic electrochemical reactions at graphite anodes consume cyclable lithium ions while depositing resistive inorganic compounds, altering the passivating layer’s structural uniformity. High ambient temperatures accelerate chemical degradation pathways, while low-temperature operation increases overpotential and promotes localized lithium plating on the anode surface. Plated metallic lithium reacts aggressively with liquid electrolyte, producing a porous, non-uniform film where dense lithium fluoride layers distort localized current density distributions across the electrode surface.
Graphite anode interphase thickening accounts for over seventy percent of total ohmic and charge transfer impedance expansion during early cycle life.
Evolution of the cathode-electrolyte interphase introduces secondary impedance drivers, particularly in high-nickel layered oxide chemistries such as lithium nickel manganese cobalt oxide. High-voltage charging strips oxygen from the cathode lattice, triggering phase transformations from the active layered structure to electrochemically inactive rock-salt nickel oxide phases. As oxygen loss degrades high-nickel active material, dissolved transition metal ions migrate across the separator to deposit on the graphite anode, where they catalyze further solid-electrolyte interphase breakdown.
In lithium iron phosphate cells, cathode interphase degradation follows a different path. Phase change strain between iron phosphate and lithium iron phosphate creates localized mechanical stress at grain boundaries during high-rate cycling. Interfacial micro-cracks allow electrolyte ingress into particle cores, generating isolated passivation surfaces that strip active lithium and elevate low-frequency mass transfer resistance, while pouch cell swelling distorts stack contact pressure.
Managing these structural shifts requires rigorous mathematical modeling capable of mapping interphase kinetics to measurable electrical parameters.
Cell manufacturers frequently attribute mid-life resistance expansion to operational thermal spikes inside rack enclosures rather than baseline electrolyte decomposition.

Formulation
Quantifying internal resistance escalation demands mathematical representations that tie physical transport changes to equivalent circuit values. Microstructural models bridge the gap between physical degradation mechanisms and measurable electrical response, allowing engineers to track interphase thickening through non-destructive testing.

Mathematical Kinetics Models
Parabolic rate equations describe solid electrolyte passivation layer growth by relating film thickness to square-root time scales. The growth rate of the anode passivating layer scales inversely with existing layer thickness, driven by solvent diffusion through porous inorganic salt matrices or electron tunneling through dense organic outer layers. When mechanical strain causes secondary particle cracking, fresh active material surfaces are exposed directly to the electrolyte, resetting local film growth dynamics and accelerating total impedance growth.
Mathematical degradation formulations account for this structural disruption by coupling stress-strain equations with chemical reaction rates. Anisotropic lattice expansion during lithium intercalation generates shear stresses exceeding active particle yield strength, inducing intergranular fracturing. Electrolyte ingress into micro-cracks accelerates solvent consumption, causing charge transfer resistance to scale exponentially rather than parabolically under aggressive thermal and voltage profiles.

Equivalent Circuit Parameter Mapping
Electrochemical impedance spectroscopy isolates distinct transport processes by fitting measured complex spectrum data to lumped electrical components. Ohmic resistance corresponds to the high-frequency real-axis intercept, capturing electrolyte ionic conductivity, separator tortuosity, and current collector contact integrity as solution resistance rises with electrolyte depletion. Intermediate frequencies form arcs governed by solid-electrolyte interphase capacitance and charge transfer kinetics at the active material interface.
| Equivalent Circuit Element | Physical Mechanism | Primary Interphase Location | Impedance Signature |
|---|---|---|---|
| R_s (Ohmic Intercept) | Electrolyte salt depletion and binder oxidation | Bulk liquid electrolyte and foil contact interface | High-frequency shift on real axis |
| R_sei / Q_sei | Passivation film growth and organic salt deposition | Graphite anode outer surface film | Mid-high frequency semicircle expansion |
| R_ct / Q_dl | Phase transformation and surface film passivation | Active particle liquid interface | Mid-low frequency semicircle expansion |
| Z_w (Warburg Element) | Solid-state lithium ion diffusion kinetics | Active material grain interior | Low-frequency forty-five degree tail angle shift |
Consider a three hundred five ampere-hour lithium iron phosphate prismatic cell operated under stationary storage profiles. Baseline ohmic resistance measures zero point two two milliohms at twenty-five degrees Celsius and fifty percent state of charge. Solid-electrolyte interphase resistance begins at zero point one eight milliohms, while charge transfer resistance reads zero point two eight milliohms.
After three thousand equivalent full cycles at one C-rate discharge and zero point five C-rate charge, continuous solvent reduction increases solid-electrolyte interphase film resistance to zero point four five milliohms.
Microcracking inside active particles simultaneously elevates charge transfer resistance to zero point six eight milliohms as surface phase degradation impedes charge exchange. Accounting for reduced diffusion rates at low temperatures, total direct current resistance ~ measured via a ten-second discharge pulse ~ climbs from an initial zero point six eight milliohms to one point three six milliohms. This represents a one hundred percent expansion in internal resistance, directly traceable to the combination of interphase growth and microstructural particle damage.
Degradation modeling uses these extracted circuit elements to forecast cell health trajectories. Integrating non-linear Arrhenius factors into passivation film rate equations allows forecasting impedance rise across variable operational profiles, where high temperatures accelerate parasitic chemical reactions and elevated state of charge drives solvent oxidation at the cathode surface. Uncalibrated measurement channels introduce additional error into these calculations.
- Anode interphase growth increases mid-frequency charge transfer resistance through dense inorganic salt accumulation.
- Particle micro-cracking opens secondary channels that expose unpassivated core material to liquid electrolyte.
- Cathode phase transition forms inactive surface layers that restrict solid-state ion injection during charging.
- Electrolyte consumption depletes active lithium salt ions, elevating bulk liquid ohmic resistance across high frequencies.
Charge transfer resistance increases by three hundred percent after two thousand C-rate cycles at forty-five degrees Celsius due to secondary particle microcracking.
Whether continuum diffusion equations accurately capture localized resistance spikes resulting from stress-induced microcracking in high-nickel pouch cells remains an open technical question.


Threshold
Battery supply contracts govern long-term cell performance by defining upper boundaries on permissible direct current resistance growth. Procurement contracts must align these chemical and physical limits with verifiable inspection parameters to protect project investments over multi-year commercial lifespans.
Contractual Resistance Metrics
Commercial supply agreements fix lifetime performance guarantees by limiting internal resistance expansion relative to baseline values. A typical utility-scale cell contract caps direct current resistance growth at sixty to eighty percent over nominal baseline figures across a ten-year or six-thousand-cycle warranty period. Passing this threshold triggers supplier remedies, such as cell replacement obligations or pro-rated financial compensation, assigning explicit financial liability for failure.
Ambiguities arise when contracts fail to define precise measurement standards for baseline and aged resistance values. Alternating current resistance measured at one kilohertz captures bulk ohmic components while ignoring interphase growth and charge transfer kinetics. Direct current pulse testing captures the combined impact of ohmic, film, and charge transfer resistance, presenting a more realistic reflection of system thermal loads under operational stress.

Does AC Impedance Predict DC Pulse Rise?
Single-frequency measurements at one kilohertz evaluate electrolyte conductivity changes while bypassing mid-frequency interphase resistance arcs and charge transfer dynamics entirely. Consequently, a cell exhibiting significant microstructural passivation degradation can pass a one-kilohertz alternating current acceptance check while failing direct current pulse criteria under field loads.
- Ohmic pulse suppression disguises interfacial kinetic retardation during brief millisecond sampling steps.
- Thermal gradient variation shifts charge transfer resistance values by five percent per degree Celsius shift.
- State of charge drift alters open circuit voltage and distorts measured solid-state diffusion kinetics.
- Sampling frequency mismatch prevents direct comparison between alternating current bench checks and field pulse metrics.
Defining direct current pulse parameters within purchase agreements prevents supplier disputes during warranty claims. Contracts must specify pulse duration, pulse amplitude, test temperature, state of charge, and thermal soak duration. A ten-second discharge pulse at one C-rate and fifty percent state of charge, conducted at twenty-five degrees Celsius following a four-hour soak, establishes a clear, repeatable standard for baseline resistance verification.
Standard supply contract clauses specifying ten-second direct current pulse limits at fifty percent state-of-charge bind suppliers to verifiable warranty claim baseline metrics.
Thermal stabilization controls eliminate localized core temperature errors during acceptance sampling, using designated soak times to clear internal core gradients before measuring voltage drop for ohmic losses. Because charge transfer kinetics follow Arrhenius temperature dependencies, testing a cell at twenty degrees Celsius instead of twenty-five artificially inflates measured resistance, triggering false contract default flags. Baseline data prevents vendor claim disputes.
Section 8.4 of the primary supply framework agreement mandates that direct current resistance expansion exceeding seventy percent over baseline triggers full cell replacement without requiring destructive teardown analysis.

Validation
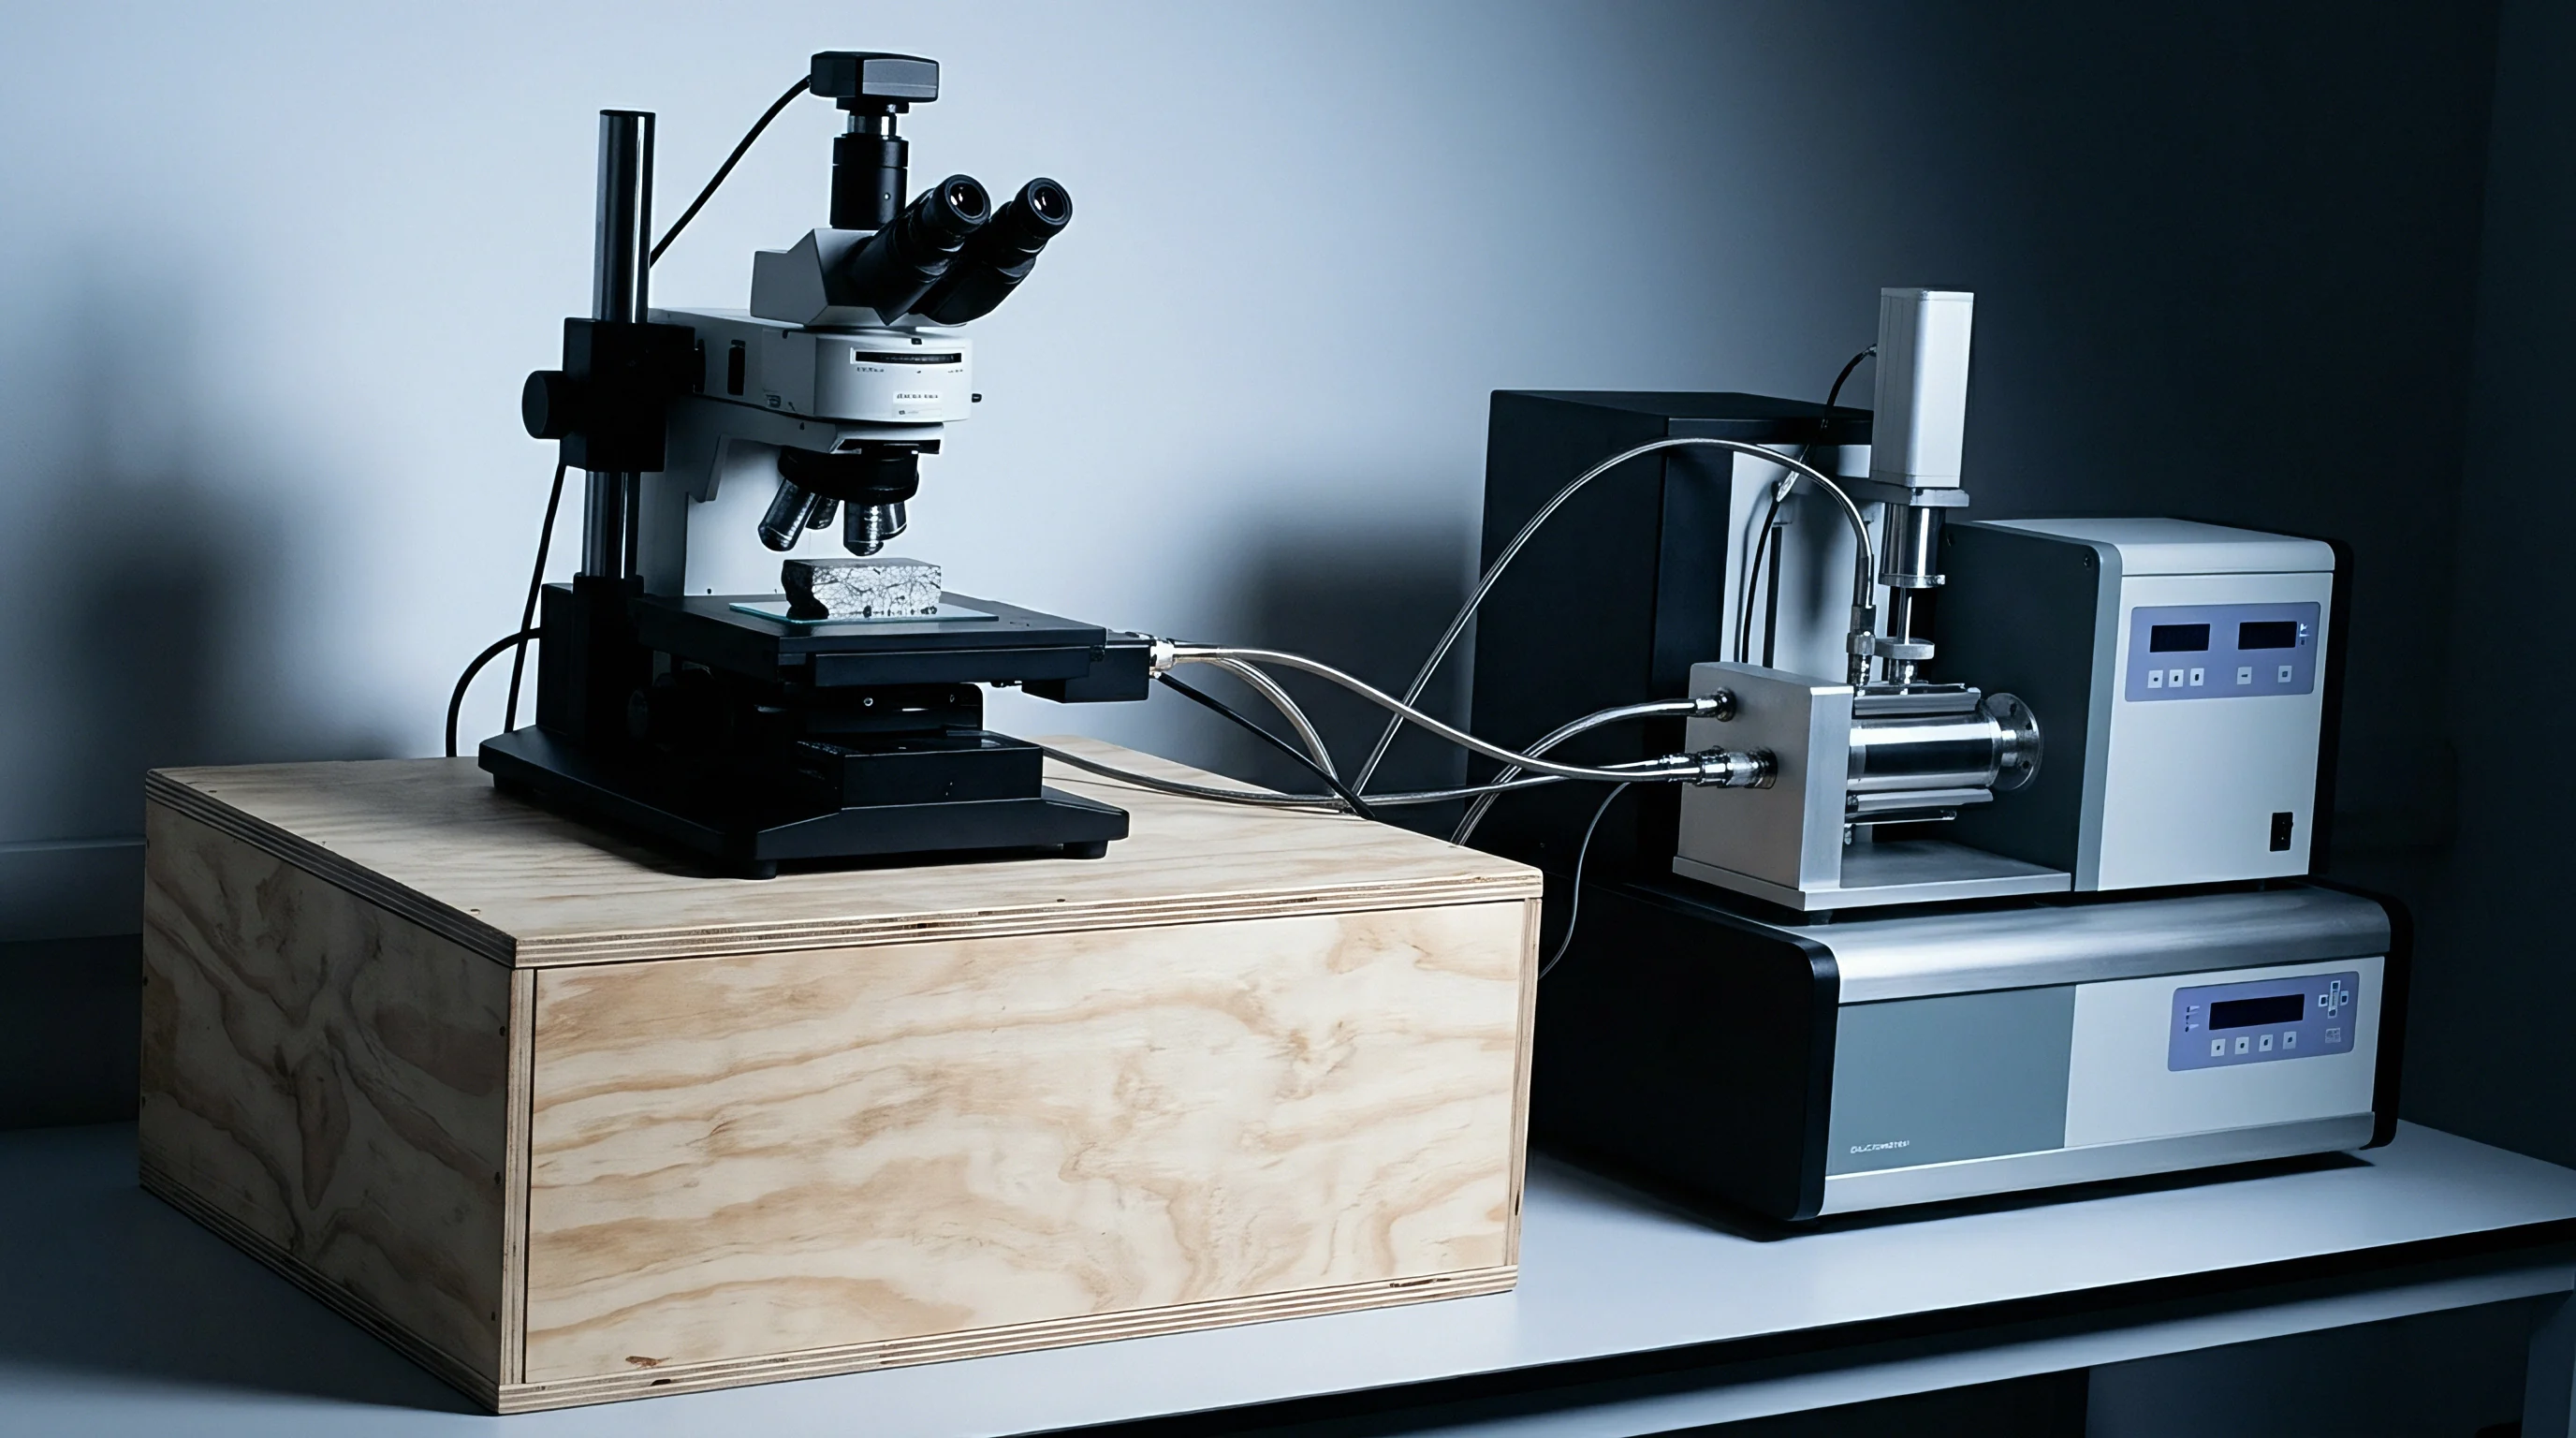
Accurate performance auditing relies on standardized laboratory procedures that measure cell voltage response under controlled thermal conditions. Incoming lot testing validates baseline metrics before cell integration into commercial module architectures.

Diagnostic Measurement Workflows
Establishing reproducible baseline data demands strict thermal stabilization prior to applying current steps. Test equipment calibration directly influences verification accuracy. Channel voltage accuracy must fall within zero point zero two percent of full scale, with current response rise times under one millisecond to capture fast ohmic steps before interphase polarization builds up.
| Measurement Parameter | Reference Test Standard | Test Condition | Rejection Threshold |
|---|---|---|---|
| Ohmic Resistance (R_ohmic) | IEC 61960-3 Clause 6.3.1 | 1 kHz AC sinusoidal signal, 25°C, 50% SOC | > 0.30 mΩ initial value |
| DC Internal Resistance (DCIR_10s) | ISO 12405-4 Clause 8.2 | 10s 1C discharge pulse, 25°C, 50% SOC | > 0.75 mΩ initial value |
| Low-Temperature DCIR | UL 2580 Annex C | 10s 0.5C discharge pulse, 0°C, 50% SOC | > 2.10 mΩ initial value |
| Self-Discharge K-Value | IEC 62620 Clause 6.4.2 | 28-day open circuit voltage drop at 25°C | > 1.5 mV per day drop |
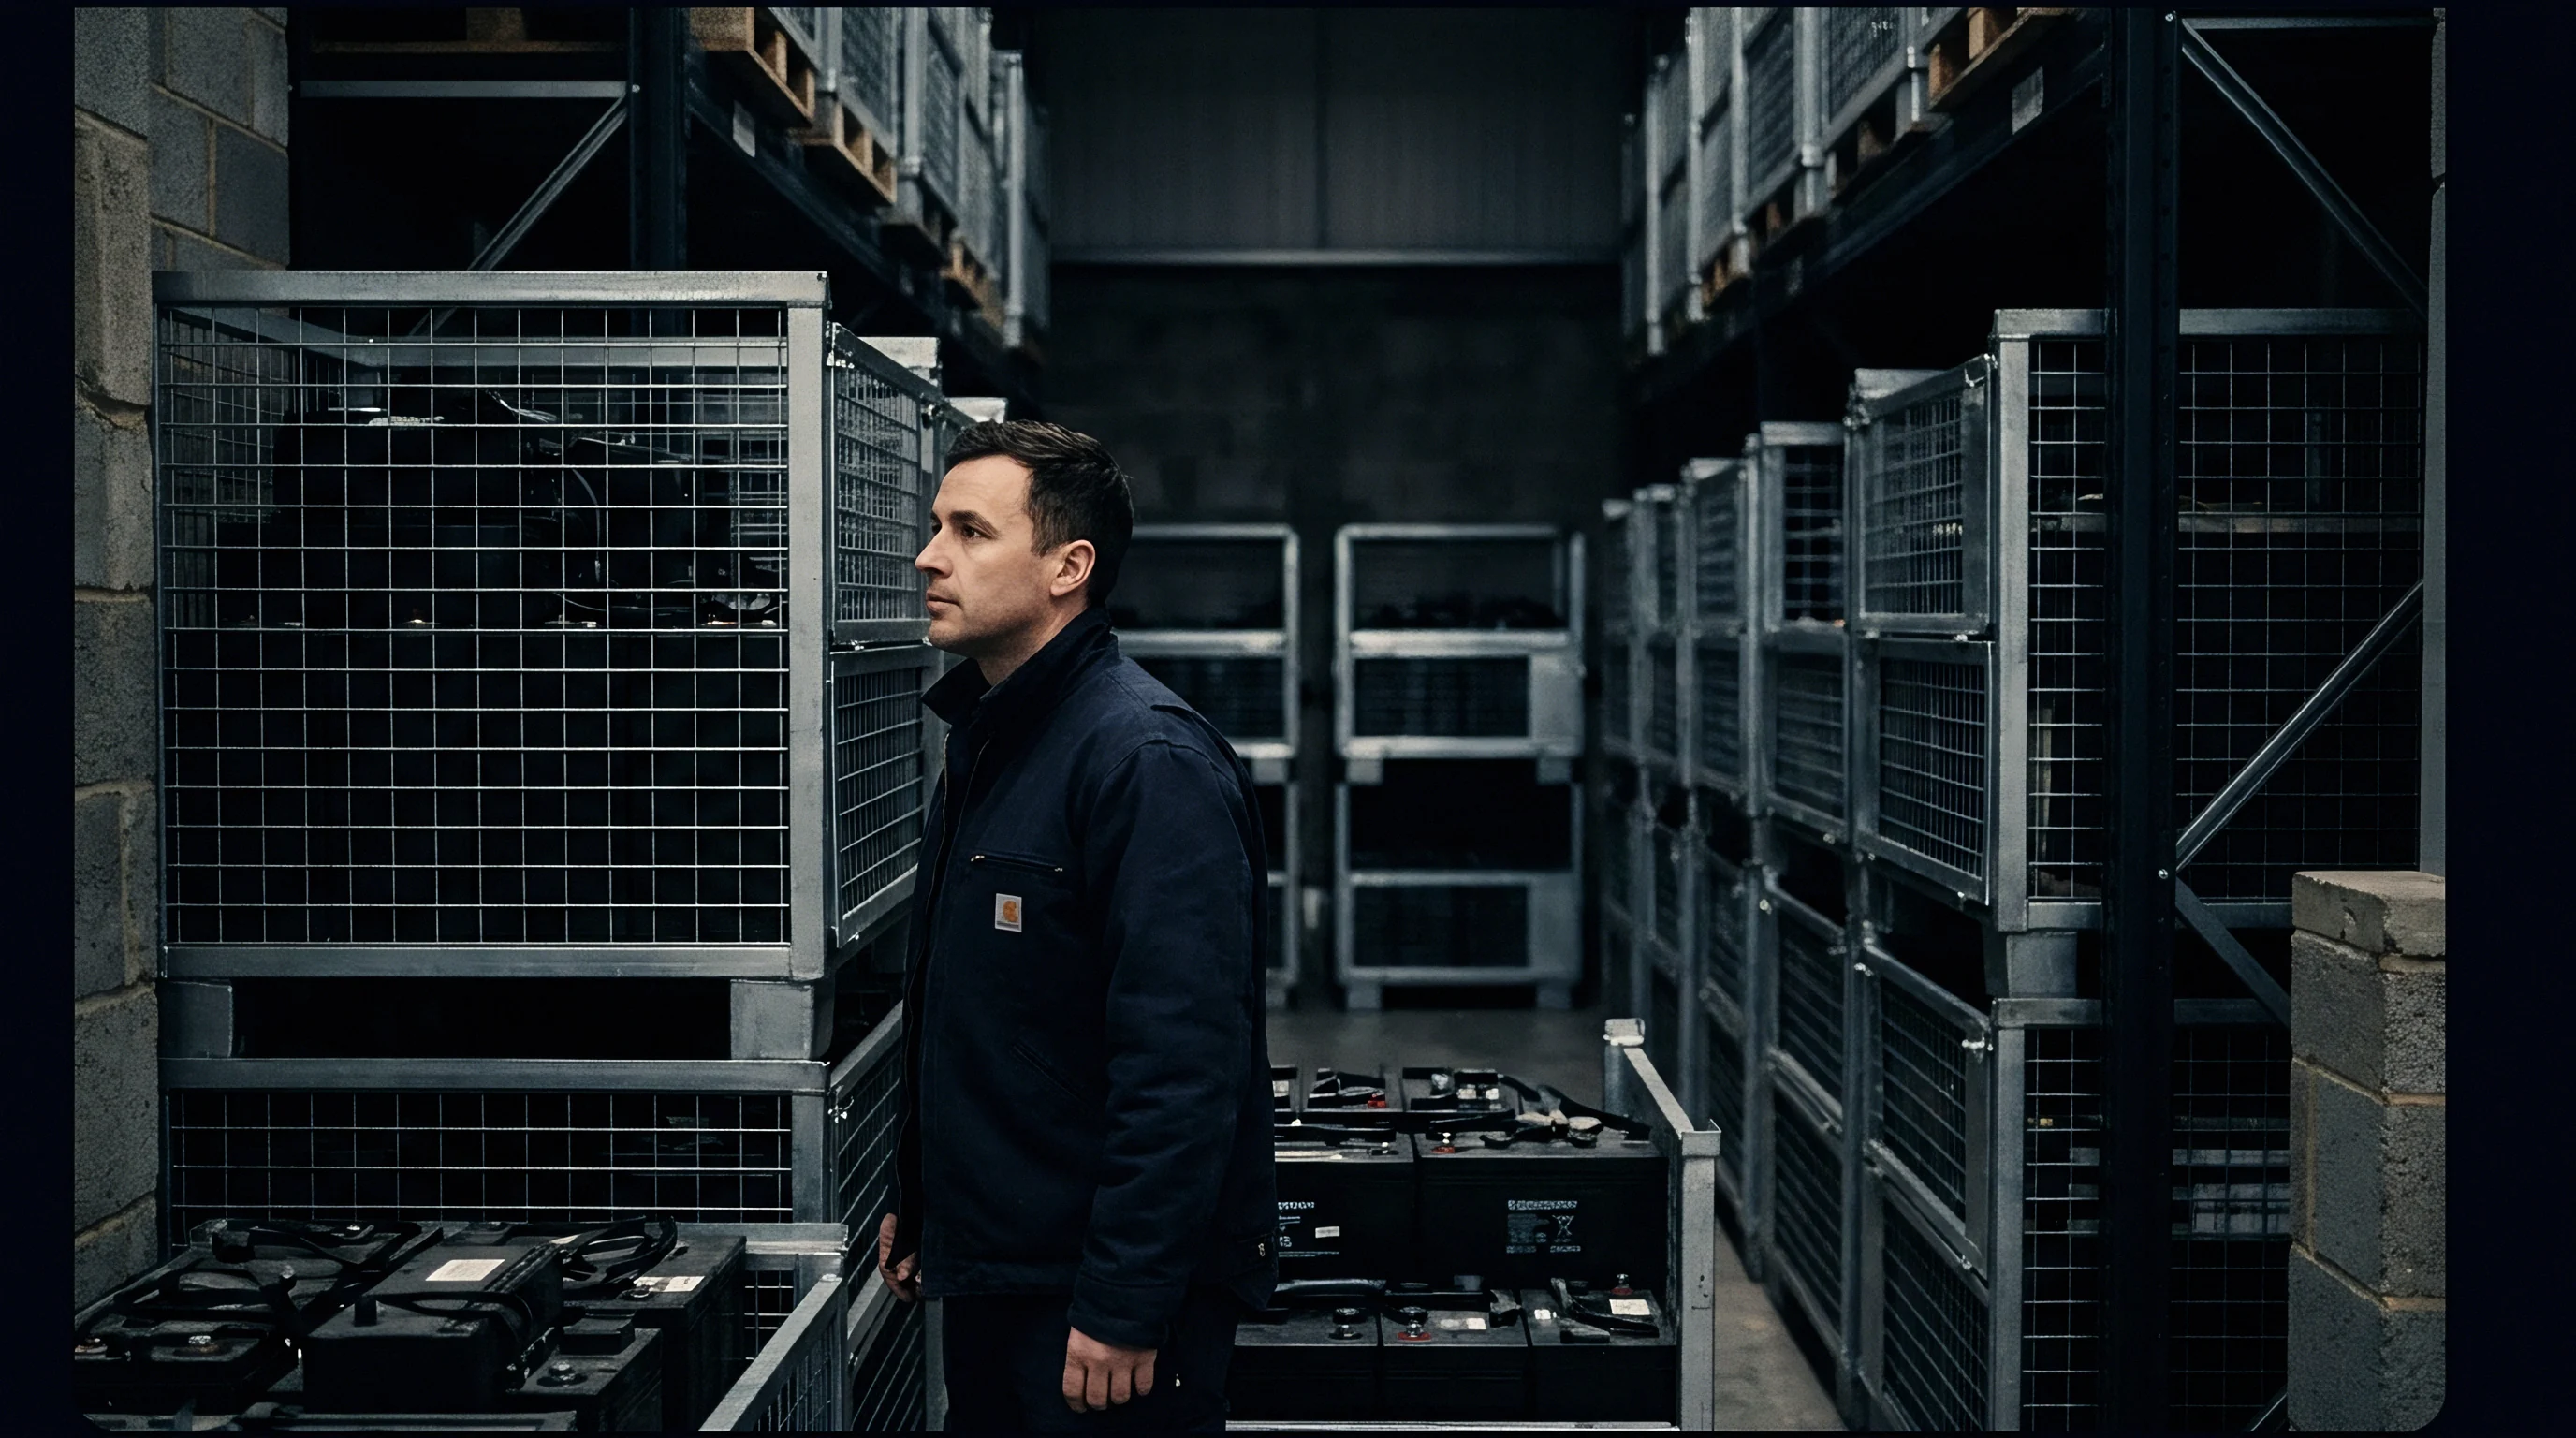
Measuring incoming cell lots against contractual baseline thresholds follows a strict sequence to eliminate environmental noise and channel calibration bias.
- Stabilize the cell lot inside an environmental chamber at twenty-five degrees Celsius for four hours minimum.
- Adjust cell state of charge to fifty percent using a constant-current constant-voltage charging sequence at C-fifth rate.
- Rest the cell for two hours to stabilize internal lithium concentration profiles and minimize thermal gradients.
- Apply a ten-second discharge pulse at one C-rate while recording voltage at ten-millisecond intervals.
- Calculate direct current resistance by dividing total voltage drop at ten seconds by applied pulse current.
Laboratory to Site Correlation
Field telemetry recorded by battery management systems frequently exhibits higher resistance growth than cell cycling channels. Because field sampling rates are typically limited to one-hertz updates, rapid voltage steps get smoothed out, underestimating true ohmic resistance jumps while microcontroller processing limits constrain dynamic impedance calculation accuracy during transient field operations.
To bridge field data to laboratory standards, battery software must execute automated pulse sequences during standardized idle windows. Recording voltage recovery kinetics after current cessation allows estimating charge transfer and interphase resistance without interrupting field operations. Comparing automated field data against laboratory reference degradation curves isolates systemic chemistry aging from localized contact resistance changes caused by module swelling.
Direct current pulse measurements conducted prior to complete thermal equilibration yield artificially elevated resistance values that undermine warranty negotiations.


Remedy
Excessive internal resistance growth degrades round-trip energy efficiency and reduces net financial returns on storage assets. Cell interphase degradation increases operational expenses while shortening economic asset life.
Financial Consequences of Impedance Expansion
Increased Joule heating inside operational modules accelerates parasitic cooling energy consumption during peak discharge periods. Elevated internal heating forces auxiliary HVAC systems to run continuously at full capacity, consuming energy that would otherwise discharge to the electrical grid and increasing parasitic cooling loads.
| Operational Year | Relative DCIR Growth | Round-Trip Efficiency | Annual HVAC Load | Annual Energy Loss Revenue Impact |
|---|---|---|---|---|
| Year 1 (Baseline) | 0% (+0.00 mΩ) | 86.5% | 1.2 GWh | Baseline reference |
| Year 3 | 25% (+0.17 mΩ) | 84.8% | 1.8 GWh | $170,000 loss |
| Year 6 | 55% (+0.37 mΩ) | 82.1% | 2.7 GWh | $440,000 loss |
| Year 10 | 85% (+0.58 mΩ) | 78.9% | 3.9 GWh | $790,000 loss |
Round-trip efficiency losses directly reduce daily arbitrage revenues. As cell direct current resistance doubles, system round-trip efficiency drops by several percentage points, wasting megawatt-hours of charging power during every charge-discharge cycle. Across a four-hundred megawatt-hour energy storage installation, a five percent drop in efficiency represents thousands of megawatt-hours in lost discharge energy annually.

Warranty Execution and Claim Structuring
Drafting enforceable contract terms depends on establishing objective baseline parameters during factory acceptance testing. Warranty structures must establish progressive compensation tiers tied to resistance expansion milestones. If cell direct current resistance exceeds sixty percent growth before year five, suppliers must deliver supplemental capacity or execute pro-rated cash settlements based on lost project revenue projections.
Sustained operation at elevated internal resistance compound thermal losses and shortens the economic service window of stationary storage assets.
Liquidated damages provisions must explicitly account for elevated auxiliary cooling expenses alongside unrecovered energy capacity losses. Buyers protect project capital by requiring suppliers to post warranty performance bonds that cover potential interphase degradation defaults. Defining clear, enforceable resistance thresholds aligns cell quality specifications directly with project financing terms.
Vague resistance definitions in commercial contracts leave energy storage developers exposed to unrecoverable losses when interphase degradation reduces system efficiency.