Differential Capacity and Electrochemical Impedance Metrics for Early Cell Resistance Screening
Combining high-frequency impedance metrics with dQ/dV peak shifting catches early cell resistance variations before cycling degradation becomes visible.

Probe
Electrochemical impedance spectra reveal structural resistive shifts long before nominal amp-hour capacity degrades. Total internal resistance in commercial lithium-ion cells combines ohmic resistance, surface layer impedance across the solid electrolyte interphase, charge transfer polarization at the electrode-electrolyte boundary, and solid-state diffusion impedance. Standard end-of-line sorting methods that rely solely on direct-current resistance often miss subtle interfacial degradation, whereas AC impedance measurements across broad frequency sweeps isolate these distinct resistive mechanisms.
High-frequency measurements capture instantaneous ohmic losses driven by current collectors, contact tabs, and electrolyte ion mobility, while low-frequency sweeps track mass transport limits within active material particles. Distinguishing between contact weld flaws and chemical degradation during initial cell grading prevents defective units from entering pack production. High-frequency intercept measurements provide early screening indicators without requiring long charge or discharge cycles.

High Frequency Intercept and Ohmic Components
Current collectors, ultrasonic tab welds, and liquid electrolyte conductivity fix the real impedance zero-crossing point on the complex plane. Measured at frequencies typically between 800 Hz and 1 kHz, this real axis intercept represents pure ohmic resistance. Physical defects such as micro-cracking in ultrasonic tab welds or poor electrolyte wetting manifest directly as elevated real intercept values.
When an automated ultrasonic welding head delivers inconsistent clamping force, the contact area between copper foil and nickel tab contracts. This physical defect raises the high-frequency ohmic intercept by tens or hundreds of micro-ohms. Measuring the real impedance intercept allows quality control systems to flag contact defects within milliseconds.
The table below compares high-frequency impedance responses across standard commercial battery chemistries.
| Chemistry | Nominal 1 kHz AC Resistance (mΩ) | Ohmic Intercept Frequency Range | Primary Physical Defect Signature |
|---|---|---|---|
| NMC 811 Cylindrical 21700 | 12.5 ± 0.8 | 800 Hz – 1.2 kHz | Collector tab weld micro-cracking |
| LFP Prismatic 100 Ah | 0.45 ± 0.04 | 500 Hz – 900 Hz | Electrolyte wetting inhomogeneity |
| LTO Pouch 20 Ah | 0.28 ± 0.02 | 1.0 kHz – 2.5 kHz | Separator alignment offset |

Charge Transfer Arcs and Interface Polarization
The mid-frequency semi-circle measures charge injection resistance across the solid electrolyte interphase and active material boundary. Characterizing this arc requires sweeping excitation frequencies from roughly 100 Hz down to 0.1 Hz, where charge transfer resistance correlates directly with kinetic reaction speed at the electrode surface.
Thick solid electrolyte interphase layers restrict lithium-ion transport, widening the mid-frequency arc diameter. When binder decomposition or transition metal dissolution occurs, charge transfer resistance rises sharply even while ohmic resistance remains unchanged. Analyzing charge-transfer arc expansion identifies early chemical aging before capacity loss becomes measurable through standard C-rate discharge tests.
- Ohmic resistance intercept quantifies bulk electrolyte conductivity and mechanical tab connection integrity.
- Solid electrolyte interphase resistance measures ion transport across passivation films formed during formation cycling.
- Charge transfer resistance reflects kinetic charge exchange reaction speed at particle surfaces.
- Warburg diffusion impedance indicates solid-state lithium transport rates within active electrode particle bulk volume.
A high-frequency intercept offset exceeding 0.35 milliohms at 1000 hertz and 25 degrees Celsius indicates internal tab weld degradation before cell cycling begins.
Operating screening equipment under precise ambient conditions stabilizes impedance measurements. Low temperature testing expands charge transfer arcs, making early interfacial degradation far easier to resolve during sorting.

Peak
Differential capacity tracking converts smooth charge-discharge voltage plateaus into sharp derivative features sensitive to phase changes. Plotting dQ/dV against cell voltage transforms subtle slope variations into prominent peaks that correspond directly to thermodynamic phase transitions in cathode and anode materials. Early cell degradation alters these peak positions, peak heights, and peak areas.
Continuous monitoring of differential capacity features enables early detection of active lithium inventory loss and cathode active material degradation. Because voltage noise corrupts derivatives, high-precision cyclers combined with numerical filtering techniques are required to extract clean derivative curves during low C-rate formation or grading steps. Analyzing peak shifts identifies specific degradation mechanisms long before total cell capacity drops below specification limits.

Voltage Derivatives and Phase Transformation Signals
Calculating dQ/dV requires precise numerical differentiation of low-rate current sweeps across narrow potential increments. Standard charge-discharge curves display flat regions during two-phase intercalation reactions. Taking the derivative converts these flat voltage plateaus into distinct voltage peaks, where peak amplitude indicates the charge accepted per unit voltage change.
Peak positions move when internal cell resistance increases or when thermodynamic equilibrium shifts. An increase in internal resistance introduces polarization, shifting charge peaks to higher voltages and discharge peaks to lower voltages. Quantifying this peak separation provides a direct measure of cell polarization growth without stopping the cycle test.
Differential capacity peaks move toward higher potentials as internal charge transfer polarization squeezes the operational voltage window.

Lithium Inventory Degradation and Electrode Slip
Anodic surface film growth traps active ions, forcing cathode potential curves to shift relative to the graphite host structure. This phenomenon, known as electrode slip, reduces the usable voltage window and causes specific dQ/dV peaks to diminish or disappear completely.
Tracking the area under individual differential capacity peaks quantifies the remaining active lithium inventory. When cathode particle cracking occurs, high-voltage peaks exhibit broadening and area loss. The step-by-step procedure below outlines the mathematical workflow for processing raw cycle data into differential capacity metrics.
- Record charge and discharge voltage arrays at a constant current rate below C/10 under strict 25 degrees Celsius climate control.
- Apply a Gaussian moving-average filter to the raw voltage and capacity time-series data to smooth signal quantisation steps.
- Calculate instantaneous dQ/dV values using central finite differences across five-millivolt increments.
- Extract peak height, peak voltage position, and full-width at half-maximum for the primary intercalation peaks.
- Calculate peak separation between corresponding charge and discharge derivative peaks to quantify internal polarization resistance.
Tracking peak movement across initial formation cycles isolates structural degradation from simple manufacturing variance. The table below details diagnostic features derived from differential capacity curves.
| Feature Metric | Observed Trend | Primary Electro-Physical Cause |
|---|---|---|
| Peak Voltage Separation | Divergence exceeding 15 mV | Growth of cell polarization and internal resistance |
| Low-Voltage Peak Area | Reduction exceeding 3 percent | Loss of active lithium inventory due to SEI growth |
| High-Voltage Peak Height | Attenuation exceeding 5 percent | Loss of active cathode material from structural phase decay |
| Peak Width (FWHM) | Broadening exceeding 10 percent | Inhomogeneous current distribution across electrode area |
Whether high-precision coulometry can isolate binder degradation from active lithium loss within a five-minute screening window remains unproven across mass production lots.


Bench
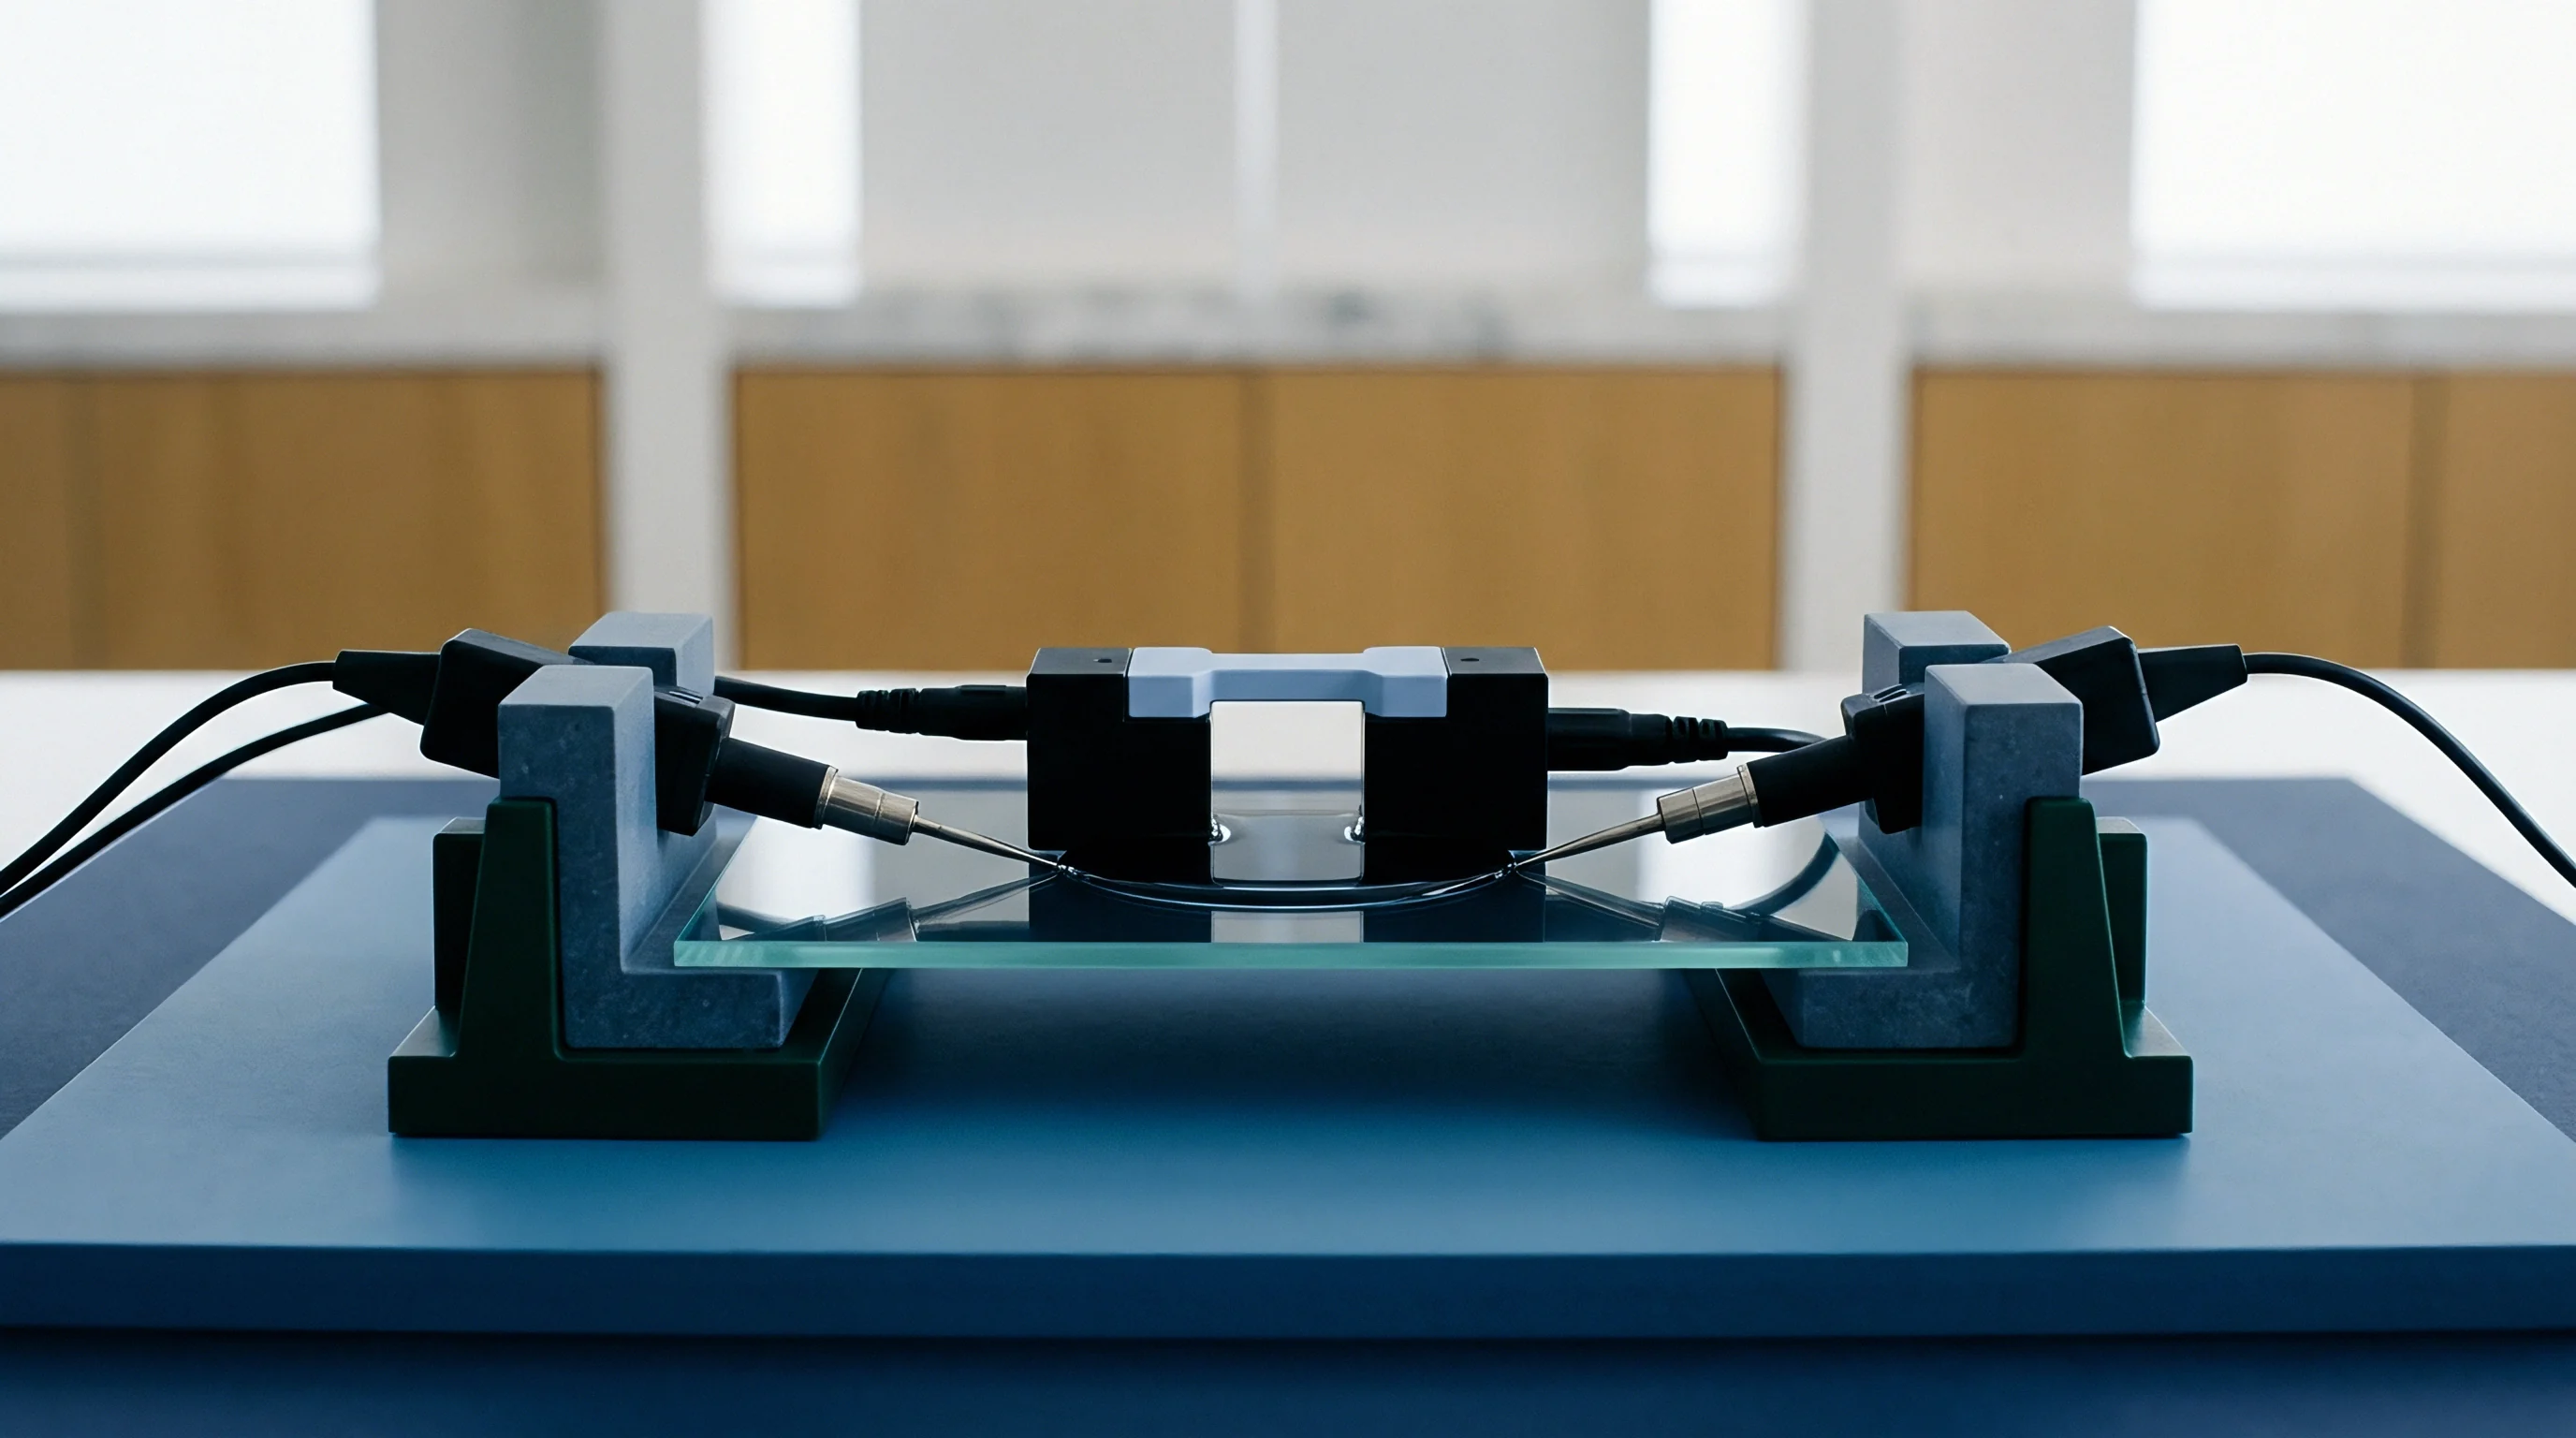
Production test channels apply millivolt-level excitation signals while isolating acoustic noise and thermal fluctuations. Fast screening on factory lines demands high signal-to-noise ratios without compromising throughput speed. Test fixtures enforce controlled mechanical pressure across cell contacts to ensure repeatable contact resistance, given that small temperature shifts alter internal impedance readings instantly.
Maintaining ambient stability within plus or minus 0.5 degrees Celsius across sorting channels prevents false rejections. Mechanical contact probes utilize gold-plated Kelvin connections to eliminate lead resistance from the measurement path. Proper hardware design allows screening lines to capture precise AC impedance and pulsed DC metrics within automated production takt times.

Can Single Frequency Impedance Replace Full Spectrum Sweeps?
A single 1 kHz AC pulse captures ohmic resistance variations within fifty milliseconds, making it standard for high-throughput battery sorting. Full spectrum electrochemical impedance sweeps take several minutes per cell, creating severe bottlenecks on fast production lines. High-speed 1 kHz meters fail to detect charge-transfer resistance growth or diffusion limitations occurring at lower frequencies.
Combining a single 1 kHz AC measurement with a multi-step direct-current pulse sequence solves the speed bottleneck. The fast AC reading captures mechanical contact flaws and tab weld defects, while a two-second DC discharge pulse measures charge transfer and interfacial polarization. Integrating hybrid pulse sequences into automated test channels provides comprehensive screening data within five seconds per cell, overcoming signal noise distortions.
Compliance with IEC 61960-3 section 7.3 forces suppliers to record AC resistance at 1 kHz within two hours of thermal equilibrium.

Excitation Signals and Thermal Clamping Requirements
Cell temperature changes of one degree Celsius alter charge-transfer impedance by roughly eight percent in commercial lithium cells. Automated sorting trays feature aluminum thermal clamping blocks to stabilize cell temperature prior to measurement.
Applying uniform pneumatic clamping force across pouch and prismatic cell surfaces eliminates gas pocket artifacts and stabilizes internal contact geometry. Excitation signal amplitudes stay below ten millivolts to maintain linear electrochemical response conditions. Exceeding ten millivolts introduces non-linear harmonic distortion, corrupting real and imaginary impedance calculations.
Ambient temperature variation during high-speed sorting typically remains within calibrated tolerance limits.


Spread
Statistical distribution of cell resistance parameters determines defect yield and pack-level thermal balance. In mass production, single-cell impedance values follow normal or log-normal statistical distributions depending on process stability. Outliers sitting in the long distribution tail represent potential field failure risks.
Sorting gates reject cells outside predefined statistical thresholds. Standard six-sigma quality control models set narrow acceptance bands around mean resistance values to prevent thermal runaway in parallel pack configurations. Setting screening limits requires balancing factory scrap rates against long-term pack reliability guarantees, as tight tolerances carry added costs.

Outlier Identification in Production Bins
Three-sigma standard deviation thresholds routinely miss non-gaussian impedance tails in newly formed manufacturing batches. Non-parametric statistical methods identify subtle resistance outliers that pass standard bell-curve filters. Screening systems track both AC resistance amplitude and imaginary reactance values simultaneously to catch anomalous electrochemical behavior.
Because severe resistance outliers can trigger thermal runaway, cells with abnormal charge-transfer resistance exhibit elevated localized heating during fast charging cycles. Filtering out cells sitting in the top two percent of the resistance distribution eliminates potential thermal hotspots prior to pack integration.

Acceptance Thresholds for Batch Screening
Upper specification limits for AC resistance set the maximum allowable polarization before a cell faces rejection. Engineering teams establish these limits using accelerated life testing correlation models. The decision checklist below highlights mandatory quality parameters for automated cell sorting systems.
- Ohmic threshold limit setting sets the baseline for contact resistance rejections across incoming lot shipments.
- Arc radius evaluation flags non-uniform SEI growth before cycle testing reveals rapid degradation.
- Differential voltage shifting identifies active material imbalance across high-capacity parallel strings.
- Temperature correction factors normalize resistance measurements taken under ambient plant variations.
Integrating multi-parameter screening algorithms reduces pack-level capacity imbalance over extended field operation while protecting downstream assembly. The table below defines typical production acceptance windows across automated cell grading lines.
| Screening Parameter | Measurement Method | Standard Acceptance Window | Action Upon Exceedance |
|---|---|---|---|
| 1 kHz AC Resistance | Four-wire Kelvin AC pulse | Mean ± 3 Standard Deviations | Automatic cell rejection to bin C |
| DC Resistance (10s Pulse) | Direct current discharge step | ≤ 1.15 × Nominal Datasheet Value | Quarantine lot for re-testing |
| dQ/dV Peak Voltage Delta | Low-rate formation cycle step | ≤ 8 mV shift from batch mode | Downgrade cell rating class |
| Imaginary Impedance (Zi) | 0.1 Hz low-frequency AC sweep | ≤ 1.20 × Nominal Datasheet Value | Scrap cell for chemical analysis |
| Screening parameters measured at 25 ± 0.5 degrees Celsius following a 4-hour thermal stabilization period. | |||
Section 4.2 of standard UN 38.3 testing specifications obligates cell suppliers to record initial impedance variations prior to environmental shock exposure.


Margin
Unscreened resistance variability increases thermal management costs and shrinks effective pack energy capacity. Cells with higher internal resistance reach lower voltage cutoffs prematurely during heavy discharge, shutting down the entire module.
Investing in early resistance screening hardware lowers long-term operational costs by reducing field failure rates. Screened cell lots allow pack engineers to downsize cooling system requirements and maximize energy density. Rigorous screening protects gross profit margins against unexpected warranty claims and recall liabilities.

Commercial Exposure from Early Cell Rejection
Scrapping a non-conforming cell during formation costs under three dollars, whereas field warranty replacement expenses exceed two hundred dollars per module. Detecting abnormal charge-transfer resistance during factory formation eliminates high-risk units before capital-intensive pack integration occurs.
Deploying combined differential capacity and impedance screening catches subtle physical defects that slip past standard open-circuit voltage checks, protecting margins. Early screening shifts quality cost burden back to cell manufacturing steps, minimizing financial liability for pack system integrators.
Field failure rates scale exponentially when sorting gates rely solely on DC resistance without screening high-frequency impedance tails.
Landed Cost Effects of Tight Screening Tolerances
Narrowing sorting gates from five percent down to two percent reduces manufacturing yield while guaranteeing uniform pack degradation. Sourcing managers balance cell yield loss costs against field service risk exposure. Sourcing pre-sorted, narrow-tolerance cell lots commands a three to five percent price premium on landed cell cost.
This landed cost premium offsets expenses associated with pack active balancing circuitry and thermal management overrides. High-throughput automated screening provides the quantitative proof required to enforce strict supplier quality agreements. Passing defective cells through initial screening leads to early thermal imbalances, pack shutdown, and catastrophic warranty liabilities.