Impedance Growth as the Early Warning a Buyer Can Measure
Early impedance growth exposes internal battery interphase degradation long before standard capacity tests reveal physical performance loss.


Drift
Freshly manufactured lithium-ion cells often mask internal degradation behind stable discharge capacity figures during their initial months of operation. A standard single-rate capacity test measures only total net ion extraction between high and low voltage cutoffs ~ a gross Ah throughput metric that obscures localized kinetic bottlenecks, passive film growth, and loss of active cyclable lithium. For industrial applications, evaluating cells solely on early discharge capacity risks premature field failures, because internal resistance usually rises substantially before gross capacity retention breaches contract specifications.
Cell degradation follows distinct electrochemical pathways based on ambient conditions, charge rate, and depth of discharge. Early in cycle life, secondary interfacial reactions consume cyclable lithium while thickening the solid electrolyte interphase on graphite anodes. This increases electrical and ionic transport resistance across the anode interphase well before cathode host sites actually break down.
Measuring total energy release therefore masks an accelerating rise in internal impedance. Tracking early impedance changes gives procurement teams a far more sensitive metric for long-term reliability.

Capacity Masking in Early Aging
Standard incoming inspection subjects new inventory to slow 0.2C or 0.5C constant-current discharge cycles at room temperature. At these low current densities, internal voltage drops stay minimal across cell tabs and electrolyte volume, allowing the cell to deliver its full rated ampere-hour capacity even if charge-transfer resistance has expanded by 30 to 50 percent. Standard acceptance testing thus hands buyers a false picture of cell health.
When deployed into high-power applications like commercial EV traction or grid peak-shaving, operating currents hit 2C to 5C continuously. Under those heavy loads, internal resistance creates pronounced voltage drops. These ohmic losses pull down the operational discharge curve, tripping BMS low-voltage cutoffs long before the thermodynamic chemical capacity is exhausted.
The pack fails to deliver its rated energy in the field despite clean low-rate lab checks. Tracking baseline cell parameters gives the early diagnostic signal capacity testing misses.
At 25°C ambient temperature, a cell exhibiting 40 percent internal resistance growth loses 12 percent of functional power output at 3C discharge while retaining 98 percent of nominal C/2 capacity.
Tracking internal impedance isolates specific degradation mechanisms. Resistance jumps when electrolyte solvents decompose, passivating surface layers thicken, or current collectors suffer micro-cracking. Spotting this early lets engineers catch suspect lots before pack integration.
Manufacturers sometimes dump baseline inventory that uses inferior binder formulations or unstable additives ~ cells that hit initial discharge targets but show steep impedance growth after brief storage or low-cycle conditioning.

Ohmic Shift versus Polarisation Escalation
Total cell impedance blends physical mechanisms operating across different time scales. The fast response, seen within milliseconds of a current step, reflects pure ohmic resistance across metallic tabs, collectors, foil interfaces, and liquid electrolyte. The slower response, spanning milliseconds to seconds, comes from charge-transfer kinetics at electrode interfaces and mass transport diffusion through porous particles.
Separating ohmic shifts from polarization growth lets engineers distinguish structural build defects from chemical decay.
Rising ohmic resistance points to mechanical issues inside the enclosure: ultrasonic tab weld degradation, delamination between active coatings and aluminum or copper foils, or collector foil corrosion. Polarisation growth signals chemical shifts in active components ~ electrolyte salt depletion, binder swelling, and cathode particle cracking all raise charge-transfer and mass-transport resistance at particle surfaces.
| Chemistry Type | Nominal Ah Capacity | Capacity Retention (%) | 1 kHz AC IR Growth (%) | 10s DCR Growth (%) | Dominant Resistance Driver |
|---|---|---|---|---|---|
| NMC 811 / Graphite | 5.0 Ah | 96.2% | +18.4% | +42.1% | Cathode Particle Micro-cracking & SEI Thickening |
| LFP / Graphite | 3.2 Ah | 98.5% | +8.1% | +24.7% | Anode Interphase Growth & Iron Dissolution |
| NMC 622 / LTO | 2.3 Ah | 99.1% | +3.2% | +7.9% | Electrolyte Oxidation at High Voltage |
| High-Silicon Anode / NMC | 4.5 Ah | 91.0% | +35.6% | +88.3% | Severe Anode Swelling & Contact Loss |
Evaluating impedance dynamics requires specific pulse test profiles to isolate kinetic phenomena. Short-duration DC resistance measurements highlight immediate ohmic drops, while longer pulses capture solid-state diffusion. Sourcing specifications that specify only 1 kHz AC resistance miss deeper interphase polarization, because 1 kHz tests bypass charge-transfer processes to measure mostly bulk electrolyte and contact resistance.
Effective verification protocols combine DC pulse testing across multiple states of charge.
Temperature shifts easily distort receiving data. A cell measured at 18°C shows noticeably higher DC resistance than at 25°C simply because electrolyte ionic mobility drops with temperature. Standardized acceptance testing requires strict thermal stabilization before taking baselines.
Uncontrolled ambient conditions lead directly to false lot rejections or the approval of degraded inventory.
High-temperature storage speeds up chemical degradation while showing almost no capacity loss during early calendar aging. Holding fully charged cells at 45°C drives rapid electrolyte breakdown, building high internal impedance without immediate active mass loss. When a buyer receives cells stored in unconditioned warehouses, basic capacity checks still return nominal ratings; direct current resistance measurements expose that thermal history and reveal internal degradation before packs are built.
Will the long-term rate of impedance growth accelerate non-linearly once interphase resistance reaches twice its baseline value?


Spectra
Electrochemical impedance spectroscopy offers a non-destructive way to isolate internal aging kinetics across frequency domains. By applying small sinusoidal current or voltage perturbations over a broad frequency range, test systems capture distinct chemical, ionic, and electrical responses from individual cell components. A single spectrum separates bulk solution resistance, interphase transport, charge-transfer kinetics, and solid-state diffusion, allowing sourcing teams to diagnose failure mechanisms without tearing cells apart.
Frequency sweeps plotted in Nyquist coordinates show distinct geometric features. The high-frequency real-axis intercept marks bulk ohmic resistance. High-to-mid frequency semicircles reflect ionic transport through surface films and charge-transfer resistance across electrode interfaces, while the low-frequency tail represents Warburg solid-state diffusion inside active particles.
Tracking shifts in these features quantifies degradation with high precision.

Frequency Response of Interphase Barriers
Aging alters specific spectral regions. Solid electrolyte interphase growth expands the high-frequency semicircle, signaling higher barrier resistance to lithium insertion at graphite anodes. Cathode degradation and surface phase transitions widen the mid-frequency semicircle as charge transfer slows down.
Meanwhile, low-frequency diffusion shifts point to structural lattice compaction or isolated active material.
Spectroscopy catches subtle variations between production lots that share identical datasheets ~ often the result of different assembly lines or minor slurry mix changes. A shifting charge-transfer semicircle across lots signals inconsistent coating densities, irregular solvent drying rates, or fluctuating humidity in dry rooms. Catching this spectral drift early keeps mismatched cells out of series strings.
Interphase degradation accelerates at elevated voltages or high states of charge. Holding cells at full charge increases transition metal leaching from nickel-rich cathodes; those metals migrate to the anode and break down passivating layers. This drives up charge-transfer resistance long before capacity drops noticeably.
Tracking mid-frequency impedance growth isolates these side reactions well ahead of failure.
Electrochemical interphase stability determines long-term cycle life. Several structural factors directly govern how internal resistance grows over time:
- Anode Interphase Microstructure determines ionic conductivity across particle surfaces and governs passivating film growth under thermal stress.
- Cathode Crystal Integrity prevents transition metal leaching into the electrolyte and maintains steady charge-transfer rates during high-voltage operation.
- Electrolyte Salt Concentration ensures stable ionic transport within porous separators and mitigates localized salt depletion during high-rate pulses.
- Current Collector Coating Adhesion maintains continuous electrical contact with active material layers and prevents delamination under mechanical vibration.
Test fixture interference easily corrupts high-frequency impedance data. Cable inductance, oxidized contact points, and electromagnetic noise alter real-axis intercepts. Reliable measurements demand four-wire Kelvin connections, shielded cabling, and temperature-controlled chambers, along with baseline calibration against certified reference cells before evaluating incoming lots.

Temperature Dependencies in High-C Discharges
Temperature fluctuations shift impedance spectra by altering reaction kinetics and electrolyte ion transport. Cold conditions raise charge-transfer resistance, causing steep voltage drops under high discharge rates. Sub-zero operation can push anode potentials below zero volts against a lithium reference, triggering metallic lithium plating ~ which raises impedance further and introduces severe risks like micro-dendrite growth and internal shorts.
High temperatures lower immediate charge-transfer resistance but accelerate side reactions that drive long-term resistance growth. Sustained operation at 50°C speeds up solvent decomposition, gassing, and solid interphase thickening. Over cycling, this causes permanent impedance growth that pushes the medium-frequency semicircle outward.
Tracking this across temperature windows helps engineers size thermal management systems correctly.
Electrochemical interphase stability relies on uniform current distribution; localized resistance variations across large-format pouch cells induce thermal hot spots during high-rate discharge.
DC resistance testing offers a practical alternative to full frequency sweeps for fast screening. Full sweeps take minutes per cell, but single or dual DC pulse tests run in seconds. By applying high current steps and dividing instantaneous voltage drop by applied current, pulse checks give an aggregate resistance figure that correlates closely with spectral charge-transfer changes.
Sourcing protocols routinely pair 1 kHz AC screening with 10-second DC pulse checks to balance throughput with diagnostic depth.
Impedance growth scales inversely with cell surface area and tab design. Large-format prismatic and pouch cells feature low bulk ohmic resistance, often below 0.5 milliohms. Measuring small shifts on low-impedance cells requires micro-ohm precision and consistent contact pressure; standard clips or spring pins introduce contact variations larger than the cell’s total internal impedance.
High-volume test fixtures rely on pneumatic clamps with copper-beryllium contacts to get repeatable readings.
Cell design inherently trades initial capacity against impedance stability. High-energy cells use thick electrode coatings and dense calendering to pack in active material, which lengthens diffusion paths and accelerates resistance growth during cycling. High-power designs use thinner coatings, porous separators, and multi-tab connections to keep resistance low under heavy current demands.
Sourcing engineers must match design mechanics to expected duty cycles to prevent early impedance-driven failure.
A simple operational guideline governs baseline resistance checks: accept no cell lot whose baseline direct current resistance exceeds three standard deviations above the running production mean, regardless of rated Ah capacity.

Probe
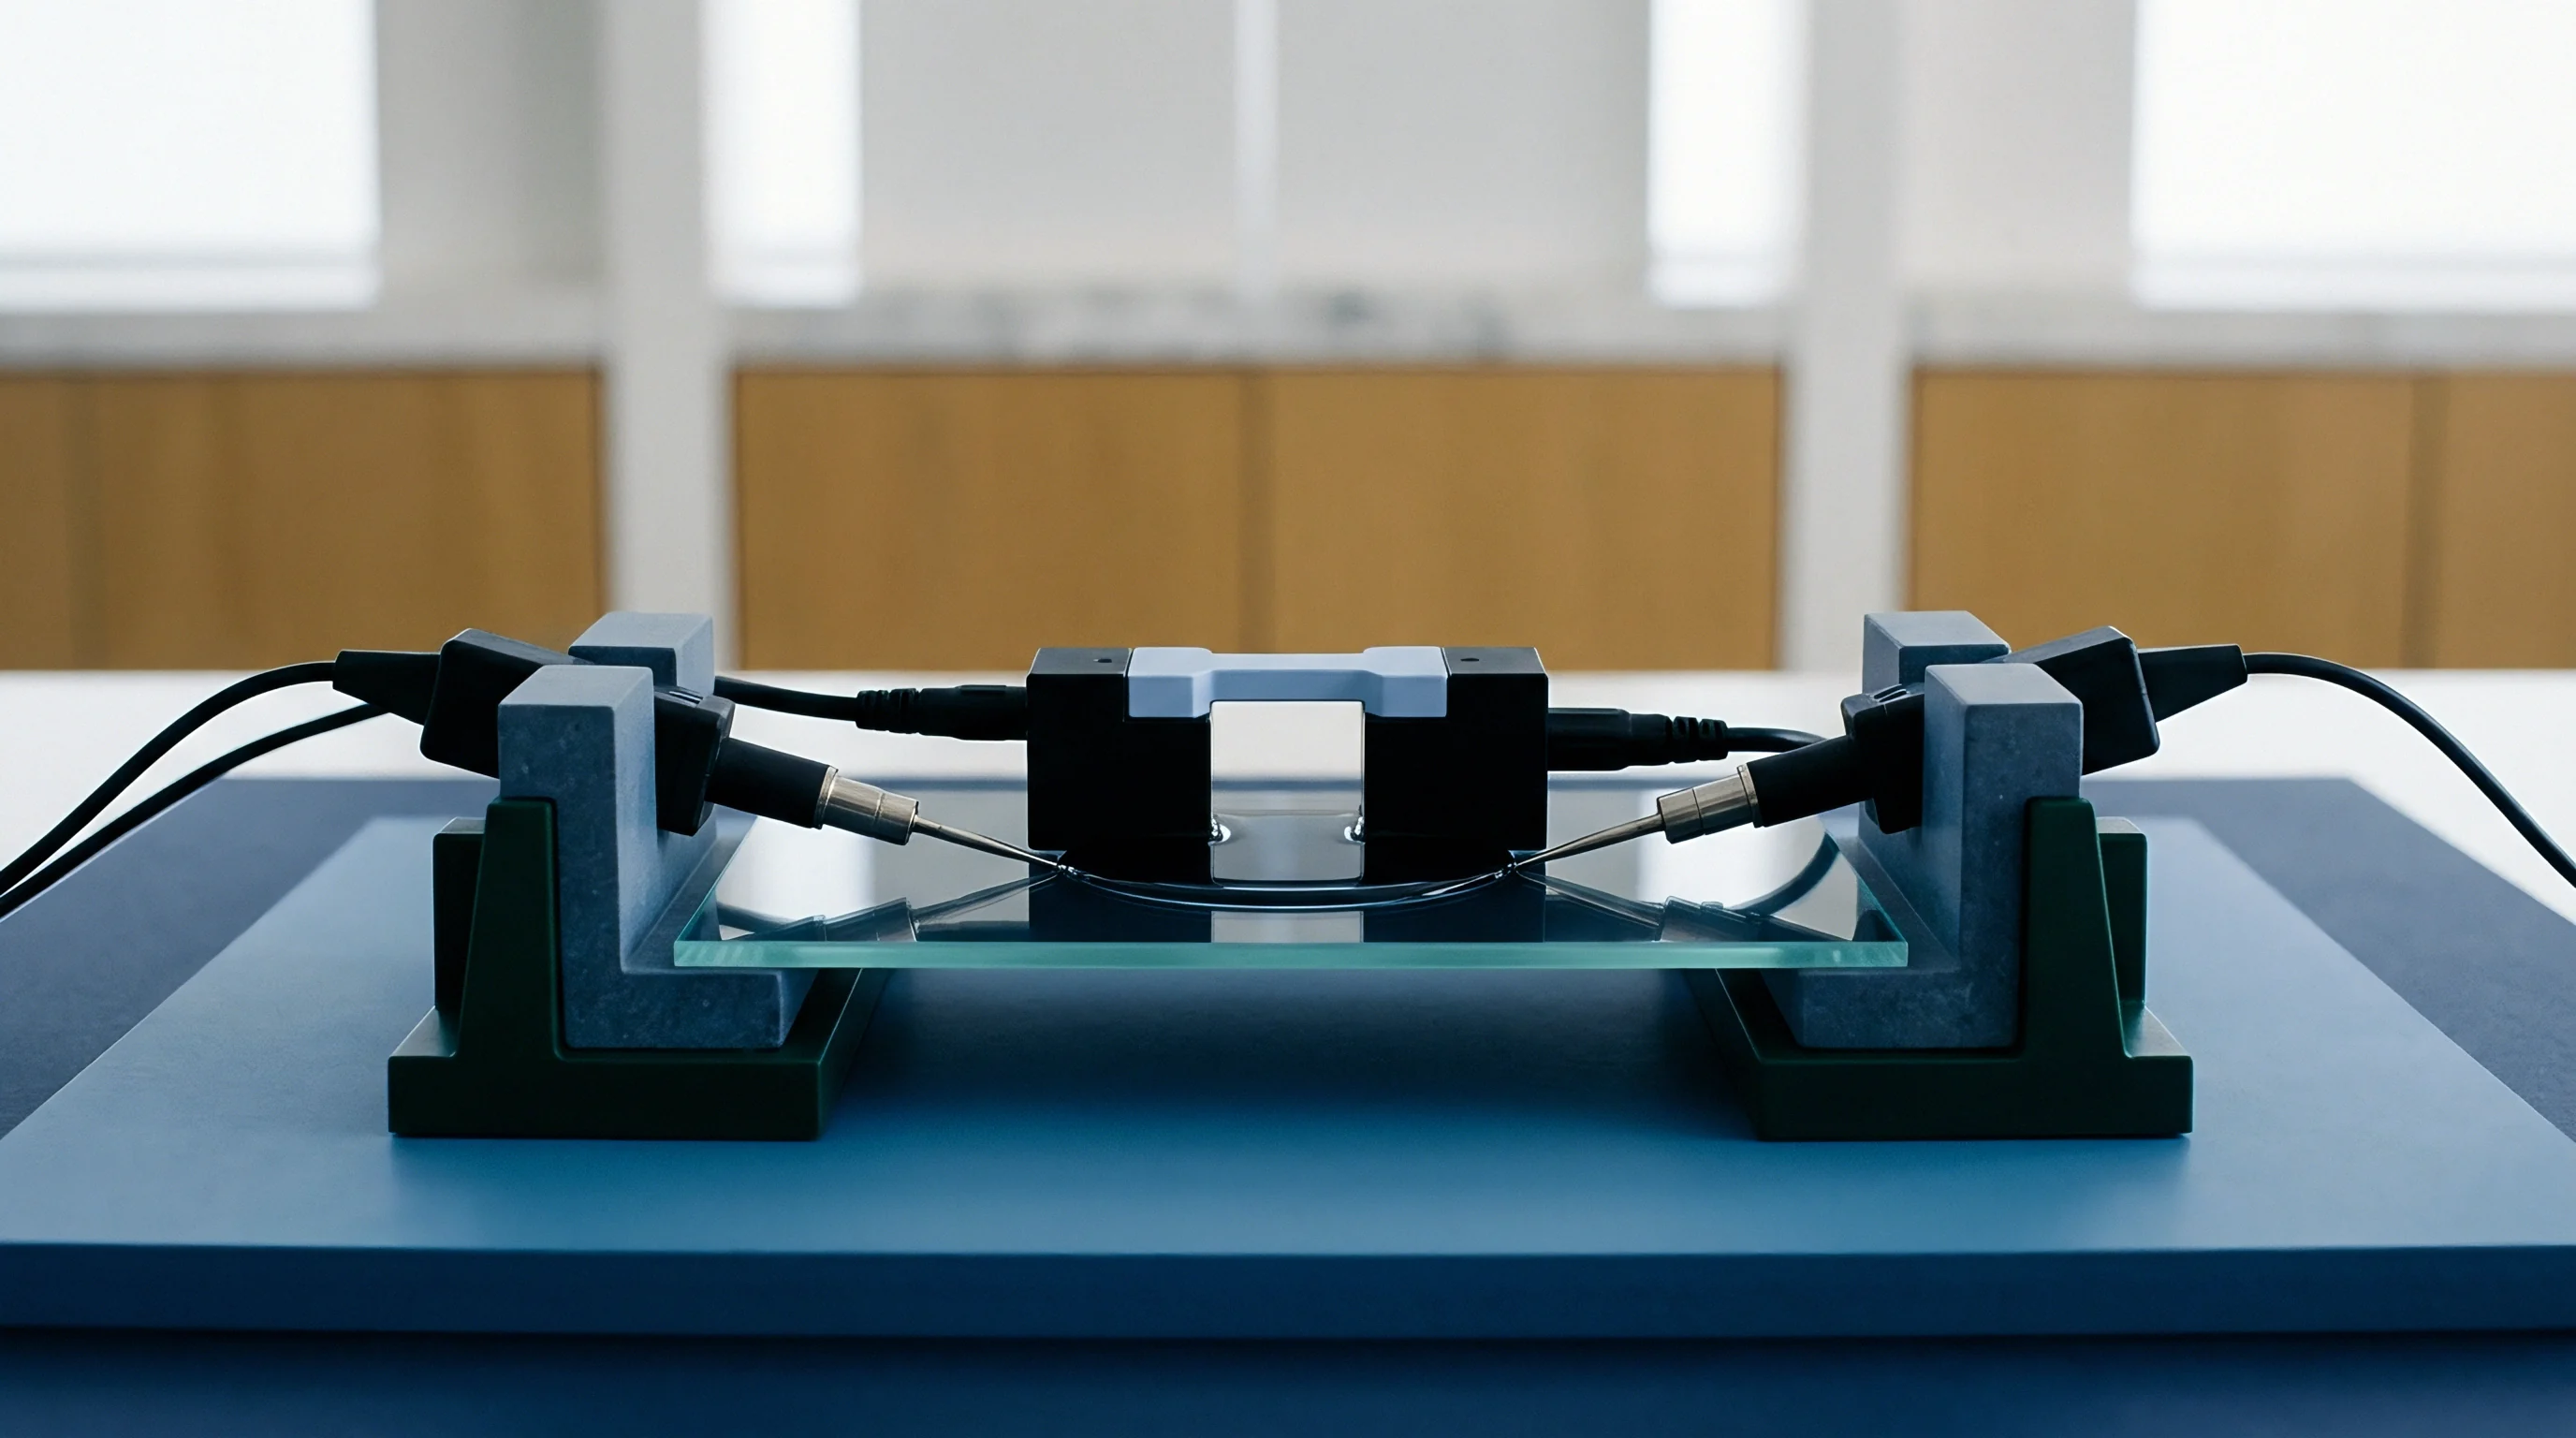
Direct physical verification requires robust hardware and standardized procedures. Relying on supplier datasheets without independent lab validation exposes procurement to batch variance and undocumented process changes. Datasheet values usually reference 1 kHz AC measurements at 50 percent state of charge under ideal 25°C lab conditions ~ numbers that say little about real-world duty-cycle stress.
Evaluating incoming lots demands standardized fixtures that minimize measurement error. Contact resistance, thermal gradients, and probe oxidation spoil accuracy. DC pulse testing requires high-speed voltage sampling capable of capturing sub-millisecond voltage drop curves, which is why sourcing teams build internal bench capacity to verify performance baselines before accepting shipments.
Why Does Direct Current Resistance Overshoot Alternating Current Resistance?
DC resistance captures total internal voltage drop under load, combining pure ohmic resistance, charge-transfer kinetics, and concentration polarization over time. By contrast, 1 kHz AC tests measure only high-frequency ionic and electrical transport, bypassing charge-transfer barriers and diffusion delays. As a result, DC resistance values run 30 to 200 percent higher than 1 kHz AC figures, depending on chemistry, temperature, and state of charge.
A DC pulse triggers a multi-stage electrochemical response. The initial voltage jump represents pure ohmic drop across terminals, collectors, and liquid electrolyte. Over the next few milliseconds, charge-transfer resistance causes further drop as double-layer capacitors charge up at electrode interfaces.
Over several seconds, concentration gradients build in the electrolyte and active particles, driving mass-transport polarization. Longer pulses capture deeper concentration polarization, yielding higher calculated resistance numbers.
| Measurement Method | Test Duration per Cell | Frequency / Signal Profile | Physical Mechanisms Isolated | Equipment Complexity | False-Pass Risk for Early Aging |
|---|---|---|---|---|---|
| 1 kHz AC Resistance | < 0.5 seconds | 1 kHz Sinusoidal AC | Ohmic resistance, electrolyte conductivity | Low (Handheld meter) | High (Misses interphase growth) |
| 1-Second DC Pulse | 1.0 second | 1C to 3C DC Discharge | Ohmic + initial charge-transfer | Medium (Load bank + fast ADC) | Moderate (Misses diffusion shifts) |
| 10-Second DC Pulse | 10.0 seconds | 1C to 5C DC Discharge | Ohmic + charge-transfer + partial diffusion | Medium (Standard automated bench) | Low (Captures operational drop) |
| Full EIS Sweep | 3 to 15 minutes | 10 kHz to 10 mHz AC Sweep | Full component resolution (SEI, Rct, Warburg) | High (Potentiostat / FRA) | Very Low (Complete diagnostic) |
Standardizing state of charge is essential for repeatable DC testing. Cell resistance varies non-linearly across SOC, usually hitting a minimum between 40 and 60 percent state of charge and rising sharply near fully charged or discharged states. Comparing resistance at 30 percent SOC against supplier baseline data taken at 50 percent leads to wrong conclusions.
Receiving protocols must condition sample cells to precise SOC setpoints before pulse testing.
Fixture design directly affects data reliability. Spring-loaded pogo pins in cheap automated sorters accumulate surface oxidation and contamination over thousands of cycles, driving contact resistance up and falsely flagging good cells as degraded. Pneumatic four-point Kelvin fixtures with automated tip cleaning ensure stable micro-ohm contact repeatability over long operational runs.

Discrepancies between Datasheet Pulses and Bench Fixtures
Supplier datasheets often list resistance calculated from brief 100-millisecond discharge pulses ~ long enough to catch the initial ohmic drop, but too short to capture charge-transfer and diffusion polarization. When an application subjects cells to 10-second acceleration or peak-shaving pulses, real voltage drop easily exceeds datasheet claims. Sourcing specifications should mandate pulse durations that reflect actual field profiles.
Direct current resistance can jump 38 percent before discharge capacity drops by even 2 percent during accelerated aging trials. That early surge alerts engineering to severe interphase degradation weeks before conventional capacity tests flag a problem. Sourcing protocols reject lots showing abnormal initial resistance curves.
Rigorous incoming sample verification follows a structured sequential protocol to guarantee data integrity across incoming cell batches:
- Thermal Stabilization Phase places sample cells inside a temperature-controlled chamber at 25°C ± 0.5°C for a minimum of four hours to eliminate internal thermal gradients.
- State-of-Charge Conditioning subjects cells to a complete C/2 discharge and charge cycle, settling the lot at exactly 50.0 percent state of charge based on Coulomb counting.
- Open-Circuit Voltage Verification records stable open-circuit voltage after a two-hour rest period to detect micro-shorts or self-discharge anomalies prior to pulse testing.
- Multi-Current Pulse Application applies sequential 1C, 3C, and 5C discharge pulses for 10 seconds each, separated by five-minute rest intervals to prevent cell self-heating.
- Voltage Recovery Analysis measures open-circuit voltage rebound for 30 seconds post-pulse to calculate kinetic charge relaxation and double-layer capacitance.
- Data Normalization and Logging corrects calculated resistance values for minor temperature deviations using pre-calibrated Arrhenius slope factors before writing to the lot dossier.
Thermal management during high-rate pulse testing prevents self-heating artifacts. Heavy current during prolonged pulses generates Joule heating, raising core temperatures and temporarily lowering electrolyte resistance. This thermal softening effect can mask structural degradation by artificially pulling down measured resistance.
Automated benches use surface thermocouples and active airflow to keep temperatures steady throughout testing.
DC pulse testing demands high-precision voltage sensing. Low-resolution analog-to-digital converters smooth out rapid transient dips, missing the peak ohmic drop. Data acquisition needs at least 16-bit resolution at 10 kHz sampling frequencies to capture accurate voltage responses under steep current steps.
Investing in high-grade acquisition hardware pays off by keeping substandard lots off the line.
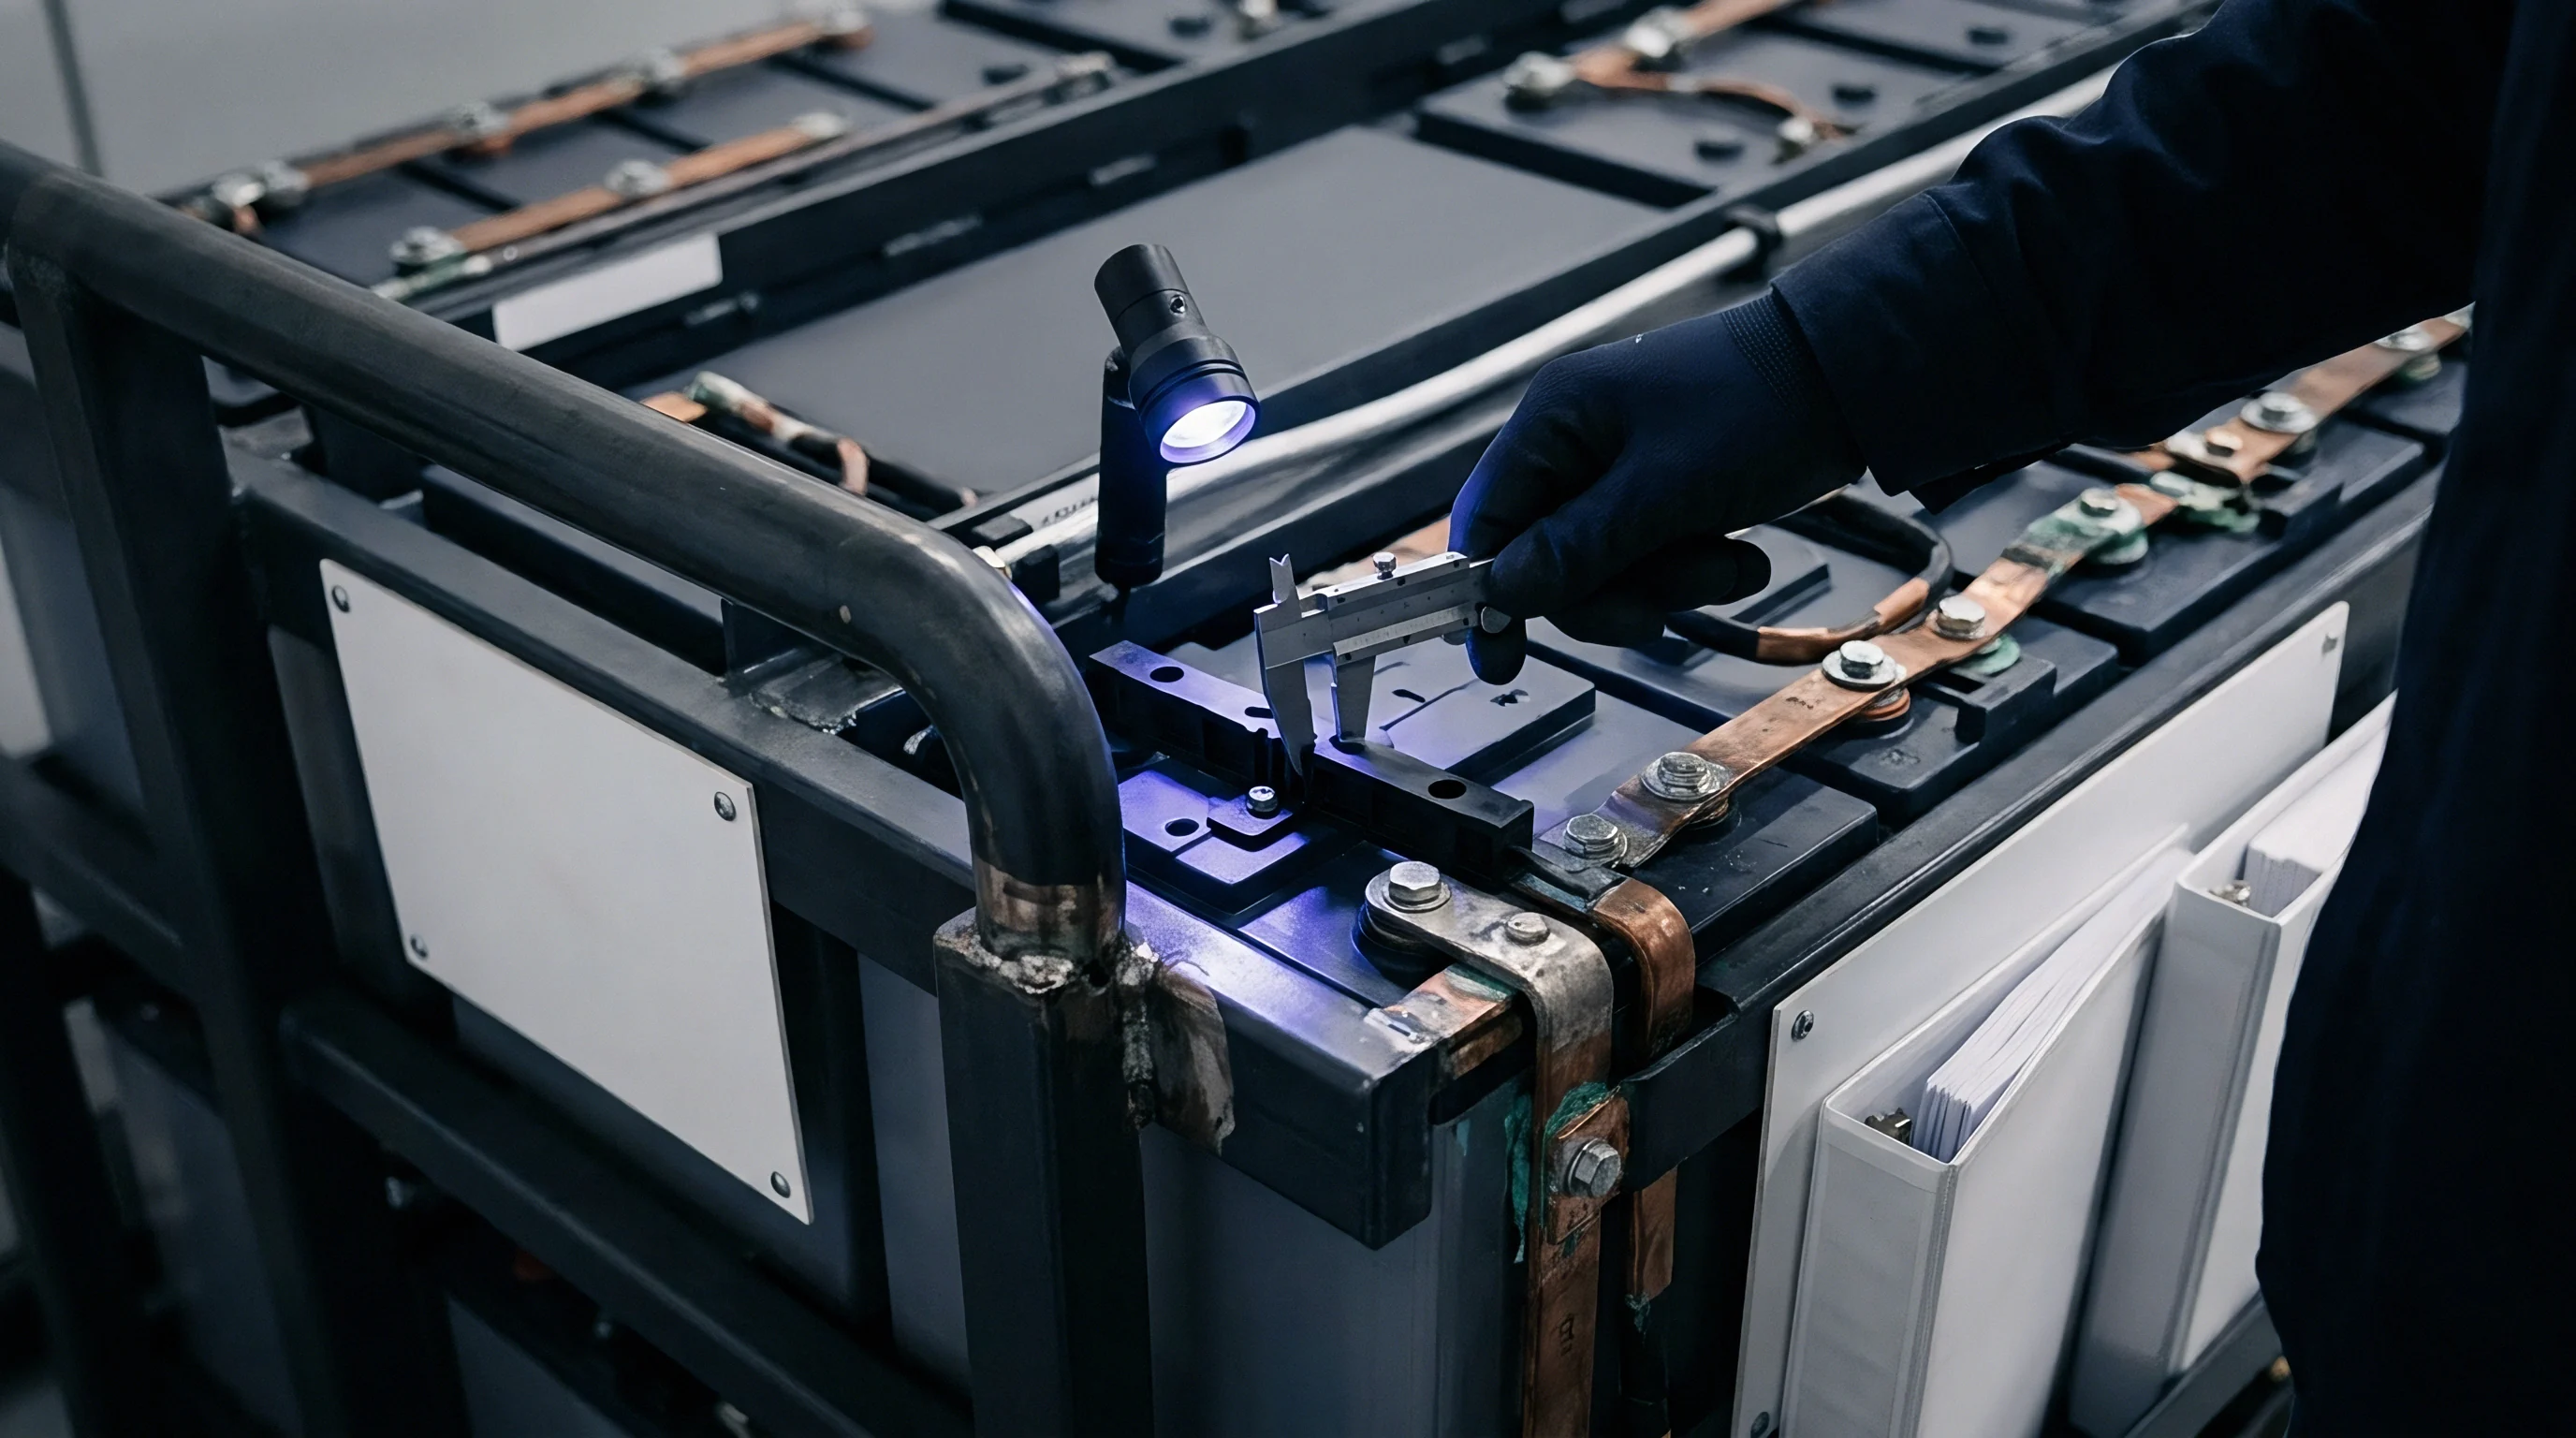
Integrating automated testing into receiving operations lowers verification costs while widening coverage. Manual probing introduces human error, variable clamping force, and inconsistent soak times. Automated tray-handling systems process full pallets, applying standardized clamping pressure and running pre-programmed sequences while logging digital dossiers for every incoming lot.
Absorbing the cost of replacing 200 damaged test pins every quarter is far cheaper than accepting a single bad production lot of degraded cells.

Lot
Incoming acceptance gates protect assembly lines from variable cell quality. Manufacturers routinely grade output based on initial capacity and AC resistance measurements. Lower-grade cells rejected by tier-one automotive buyers often find their way back to market through brokers or secondary distributors; strict receiving verification stops these re-graded cells before they reach pack production.
Statistical process control sets clear acceptance limits based on baseline impedance profiles. Evaluating average resistance across a sample batch gives insufficient visibility ~ outliers drive premature pack failure because series-connected module current is constrained by the highest-impedance cell in the string. Quality protocols must enforce strict maximum resistance thresholds alongside tight variance limits.

Incoming Acceptance Gates for Cell Batches
Acceptance protocols define pass/fail criteria based on statistical distribution metrics, establishing both maximum mean resistance and maximum standard deviation across sample trays. A lot with low mean resistance but high standard deviation presents serious operational risk: outlier cells heat faster and age quicker, destabilizing string balance during field operation.
Sampling plans should adhere to established frameworks like ISO 2859-1 or ANSI/ASQ Z1.4. Pulling a fixed five cells per shipment offers zero statistical confidence when receiving multi-thousand cell pallets. Sourcing specifications should scale sample sizes to lot volume, using tightened inspection levels for new suppliers or unverified factory locations.
Standard quality specifications mandate that incoming cell lots exhibit an impedance standard deviation under 2.5 percent of the lot mean to guarantee balanced thermal performance in series strings.
Irregular distribution curves in resistance data usually signal mixed batches or regraded inventory. A standard single-factory run shows a narrow Gaussian bell curve for internal resistance. A bimodal distribution, with two distinct resistance peaks, means the supplier blended cells from different lines, production dates, or slurry batches into one shipment.
Such lots require immediate rejection to maintain module uniformity.

Statistical Outlier Detection across Trays
Catching individual high-resistance outliers prevents field pack failures. Automated screening evaluates incoming data using interquartile range or z-score algorithms, flagging cells more than three standard deviations above the lot mean for removal ~ even if their absolute resistance sits within datasheet specs. Removing outliers preserves string balance and extends pack operating life.
Cells stored for extended periods before shipping often show transient surface film growth. This passivation effect artificially inflates initial resistance readings. Sourcing protocols should establish specific re-conditioning steps before issuing final lot rejections: running samples through two gentle C/5 charge and discharge cycles breaks down temporary passivation films to reveal true baseline resistance.
Executing an incoming lot verification protocol requires disciplined step-by-step execution across receiving teams:
- Verify shipment date codes, batch serial numbers, and factory origin documentation against the issued purchase order dossier.
- Uncrate pallets in a climate-controlled receiving area maintained at 22°C to 25°C, allowing 12 hours for thermal stabilization.
- Draw a statistically representative sample set using ANSI/ASQ Z1.4 Normal Level II single sampling tables based on total received cell count.
- Inspect sample cells visually for terminal oxidation, pouch swelling, sleeve scratches, and leak residue.
- Mount sample cells into pneumatic 4-wire Kelvin test fixtures calibrated against micro-ohm reference standards.
- Execute 1 kHz AC IR and 10-second DC pulse resistance tests at 50% state of charge.
- Calculate mean, standard deviation, and z-score distributions across collected sample data points.
- Compare calculated metrics against contractual specification limits and write the final lot acceptance report.
Traceability links test data directly to individual cell serial numbers. Barcode scanning during receiving registers each cell’s initial resistance into a central database. If a cell fails during module assembly or field operation, engineers can trace its history back to initial test data, making warranty enforcement straightforward when batch defects surface.
Factory audits confirm supplier grading capabilities and calibration standards. Visiting supplier plants frequently uncovers uncalibrated meters, worn contact pins, or manual data entry. Sourcing teams enforce strict calibration requirements at vendor facilities to align factory grading with receiving lab metrics, minimizing shipping disputes.
Increased initial internal resistance can fall within expected storage passivation limits, self-correcting after fifty operational cycles.


Warranty
Integrating explicit impedance growth metrics into supply contracts replaces vague performance guarantees with verifiable terms. Traditional battery agreements guarantee only nominal capacity retention over a fixed timeframe or cycle count ~ typically 80 percent Ah capacity over three years or 3,000 cycles. These basic capacity clauses leave buyers unprotected against resistance growth that degrades usable power long before capacity limits are hit.
Drafting enforceable technical specifications requires defining precise test conditions in the contract. Terms must spell out pulse parameters, state of charge, operating temperature, and allowable delta-resistance thresholds over time. Clear methodology clauses eliminate disputes when filing warranty claims for premature aging.

Contractual Clauses for Internal Resistance Thresholds
Effective procurement contracts state explicit maximum allowable resistance limits at key operational milestones. A standard clause defines maximum initial DC resistance at delivery, maximum growth percentages at 1,000-cycle intervals, and absolute end-of-life resistance caps. Setting clear delta-impedance ceilings ensures cells maintain required power delivery throughout their service life.
Commercial contracts should link payment milestones directly to incoming quality acceptance. Structuring terms with a 15 to 20 percent retainage fee paid only after sample testing verifies impedance specifications protects buyer capital and incentivizes vendors to maintain strict factory sorting prior to shipment.
| Operational Parameter | Baseline Cell Performance | 15% DCR Growth (Nominal) | 50% DCR Growth (Uncontrolled) |
|---|---|---|---|
| System DC-to-DC Efficiency | 95.2% | 93.8% | 88.1% |
| HVAC Cooling Demand (kW) | 12 kW | 18 kW | 45 kW |
| Usable Discharge Power (3C Peak) | 1000 kW | 940 kW | 710 kW |
| Annual Revenue Loss (PJM Reg) | Baseline reference | -$14,500 / year | -$68,000 / year |
| Projected Pack Replacement Year | Year 10 (Target) | Year 8.5 | Year 4.2 |
Establishing clear dispute procedures within purchase contracts prevents extended standoffs when lot rejections occur. Contracts should designate accredited third-party labs and standardized reference procedures to re-test disputed lots. Defining binding arbitration terms accelerates resolution and minimizes line delays.

Commercial Exposure of Accelerated Degradation
Ignoring early impedance growth exposes asset owners to compounding financial losses. In utility-scale grid projects, rising cell resistance cuts round-trip energy efficiency, raises auxiliary HVAC cooling power demands, and triggers premature BMS capacity throttling. The cumulative financial impact of unmonitored impedance growth often exceeds the original module purchase cost.
Thermal management operating costs scale directly with resistance growth. Joule heating inside a cell increases quadratically with current ~ heat generation equals current squared times resistance. Doubling internal resistance doubles heat output at a given current load, forcing HVAC chillers to draw significantly more auxiliary power to maintain safe pack temperatures, eroding net system efficiency and operating margins.
Excessive internal resistance growth increases cell thermal output exponentially, forcing auxiliary HVAC systems to draw additional parasitic power and reducing net system round-trip efficiency.
System integrators usually bear long-term warranty liabilities for packs installed in the field. If a supplier delivers cells prone to rapid interphase degradation, the integrator absorbs field repair, module replacement, and labor costs. Rigorous qualification and incoming screening insulate integrators from catastrophic warranty claims.
Second-sourcing strategies reduce procurement risk but require standardized cross-chemistry resistance specifications. Integrating cells from multiple suppliers into one product line demands matched impedance characteristics for uniform thermal performance and BMS compatibility. Establishing tight master specification parameters enables seamless multi-vendor sourcing without redesigning thermal hardware.
Section 8.3 of the Master Supply Agreement specifies that any incoming cell lot exhibiting a 10-second direct current resistance mean exceeding 1.15 milliohmic units at 25°C and 50 percent state of charge shall be rejected at the supplier’s sole expense.

Clash
Reconciling chemistry performance trade-offs against landed cost structures dominates battery procurement. Low internal resistance and long cycle life require premium active materials, specialized electrolyte additives, and precision manufacturing controls ~ all of which raise upfront cell costs. Sourcing engineers must balance front-end pricing against lifetime cost per delivered kilowatt-hour to maximize project margins.
Cheaper cell options often carry heavy hidden downstream costs. Bargain-tier cells from unverified vendors frequently suffer rapid impedance growth, requiring early module replacements, higher warranty reserves, and expanded thermal management hardware. Thorough landed-cost models incorporate projected impedance aging curves to calculate true lifetime returns.

Financial Trade-Offs in Field Replacements
Field maintenance for remote energy storage scale dramatically when cells suffer rapid impedance growth. Replacing degraded modules in remote locations involves freight, technician labor, safety permits, and lost operational revenue during downtime. Buying higher-grade cells with verified interphase stability dramatically lowers long-term maintenance liabilities.
Cell degradation destabilizes string voltage balance in high-voltage packs. When individual cells develop elevated internal resistance, their voltage drops rapidly on discharge and spikes during charge, triggering premature BMS safety cuts. Balancing systems then burn off excess energy as heat to keep strings aligned, wasting energy and accelerating thermal aging across adjacent cells.
Specifying tight baseline resistance tolerances minimizes these balancing losses and extends pack service life.
Quantifying total cost of ownership requires evaluating cell performance across the full operational lifespan. The following financial trade-offs illustrate the economic impact of selecting high-stability cell designs over bargain alternatives:
- Initial Cell Purchase Price reflects raw material purity and manufacturing precision, establishing the baseline capital expenditure for the battery asset.
- Parasitic HVAC Energy Consumption scales upward over time as cell resistance growth increases internal thermal dissipation during high-power cycles.
- BMS Throttling Operational Losses reduce total usable system capacity when high internal resistance triggers premature low-voltage cutoffs.
- Field Module Replacement Expenses encompass freight, site labor, and system downtime costs incurred when replacing prematurely degraded battery strings.
Salvage value for retired packs depends directly on remaining internal resistance. Spent cells targeted for second-life applications ~ such as stationary storage repurposed from electric vehicles ~ are graded primarily on residual impedance and remaining capacity. Cells that retain low resistance command higher secondary market prices, improving end-of-life capital recovery for asset owners.

Landed Cost Impact of Early Cell Screening
Implementing rigorous incoming screening adds minor upfront testing costs while preventing massive downstream production losses. The expense of automated Kelvin test channels, climate-controlled receiving labs, and sample pulse testing is a tiny fraction of total manufacturing overhead. Early screening protects assembly lines from building packs around defective cells that would fail end-of-line quality checks.
Calculating the landed cost of cell inventory requires accounting for tariffs, dangerous goods compliance, scrap rates, and warranty risk allowances. A low factory-gate price quickly turns expensive if lot rejection rates run high or supplier warranty claims get denied. Sourcing teams rely on total landed-cost frameworks to compare international vendors on equal financial footing.
Procurement practices rely on continuous feedback loops between incoming inspection labs and vendor engineering teams. Sharing impedance distribution data with suppliers drives manufacturing improvements at the factory level. Suppliers quickly learn that buyers with advanced measurement capabilities will not accept secondary or off-spec inventory, ensuring priority access to top-tier production runs.
Mastering early impedance measurement equips buyers with the diagnostic capability needed to protect capital investments in battery systems. Tracking internal resistance growth gives clear operational visibility into cell health long before conventional capacity measurements flag performance loss. Implementing disciplined testing procedures, tight statistical acceptance gates, and clear contractual limits secures reliable long-term battery performance across demanding commercial applications.
Integrating incoming impedance verification into standard procurement workflows changes supplier dynamics permanently, forcing vendors to deliver verified quality rather than flat datasheet promises.