Electrochemical Storage Degradation Mechanisms in Prismatic Lithium Iron Phosphate Cells
Prismatic LFP degradation stems primarily from loss of active lithium to anode SEI growth, accelerated by high state-of-charge storage and stack pressure.
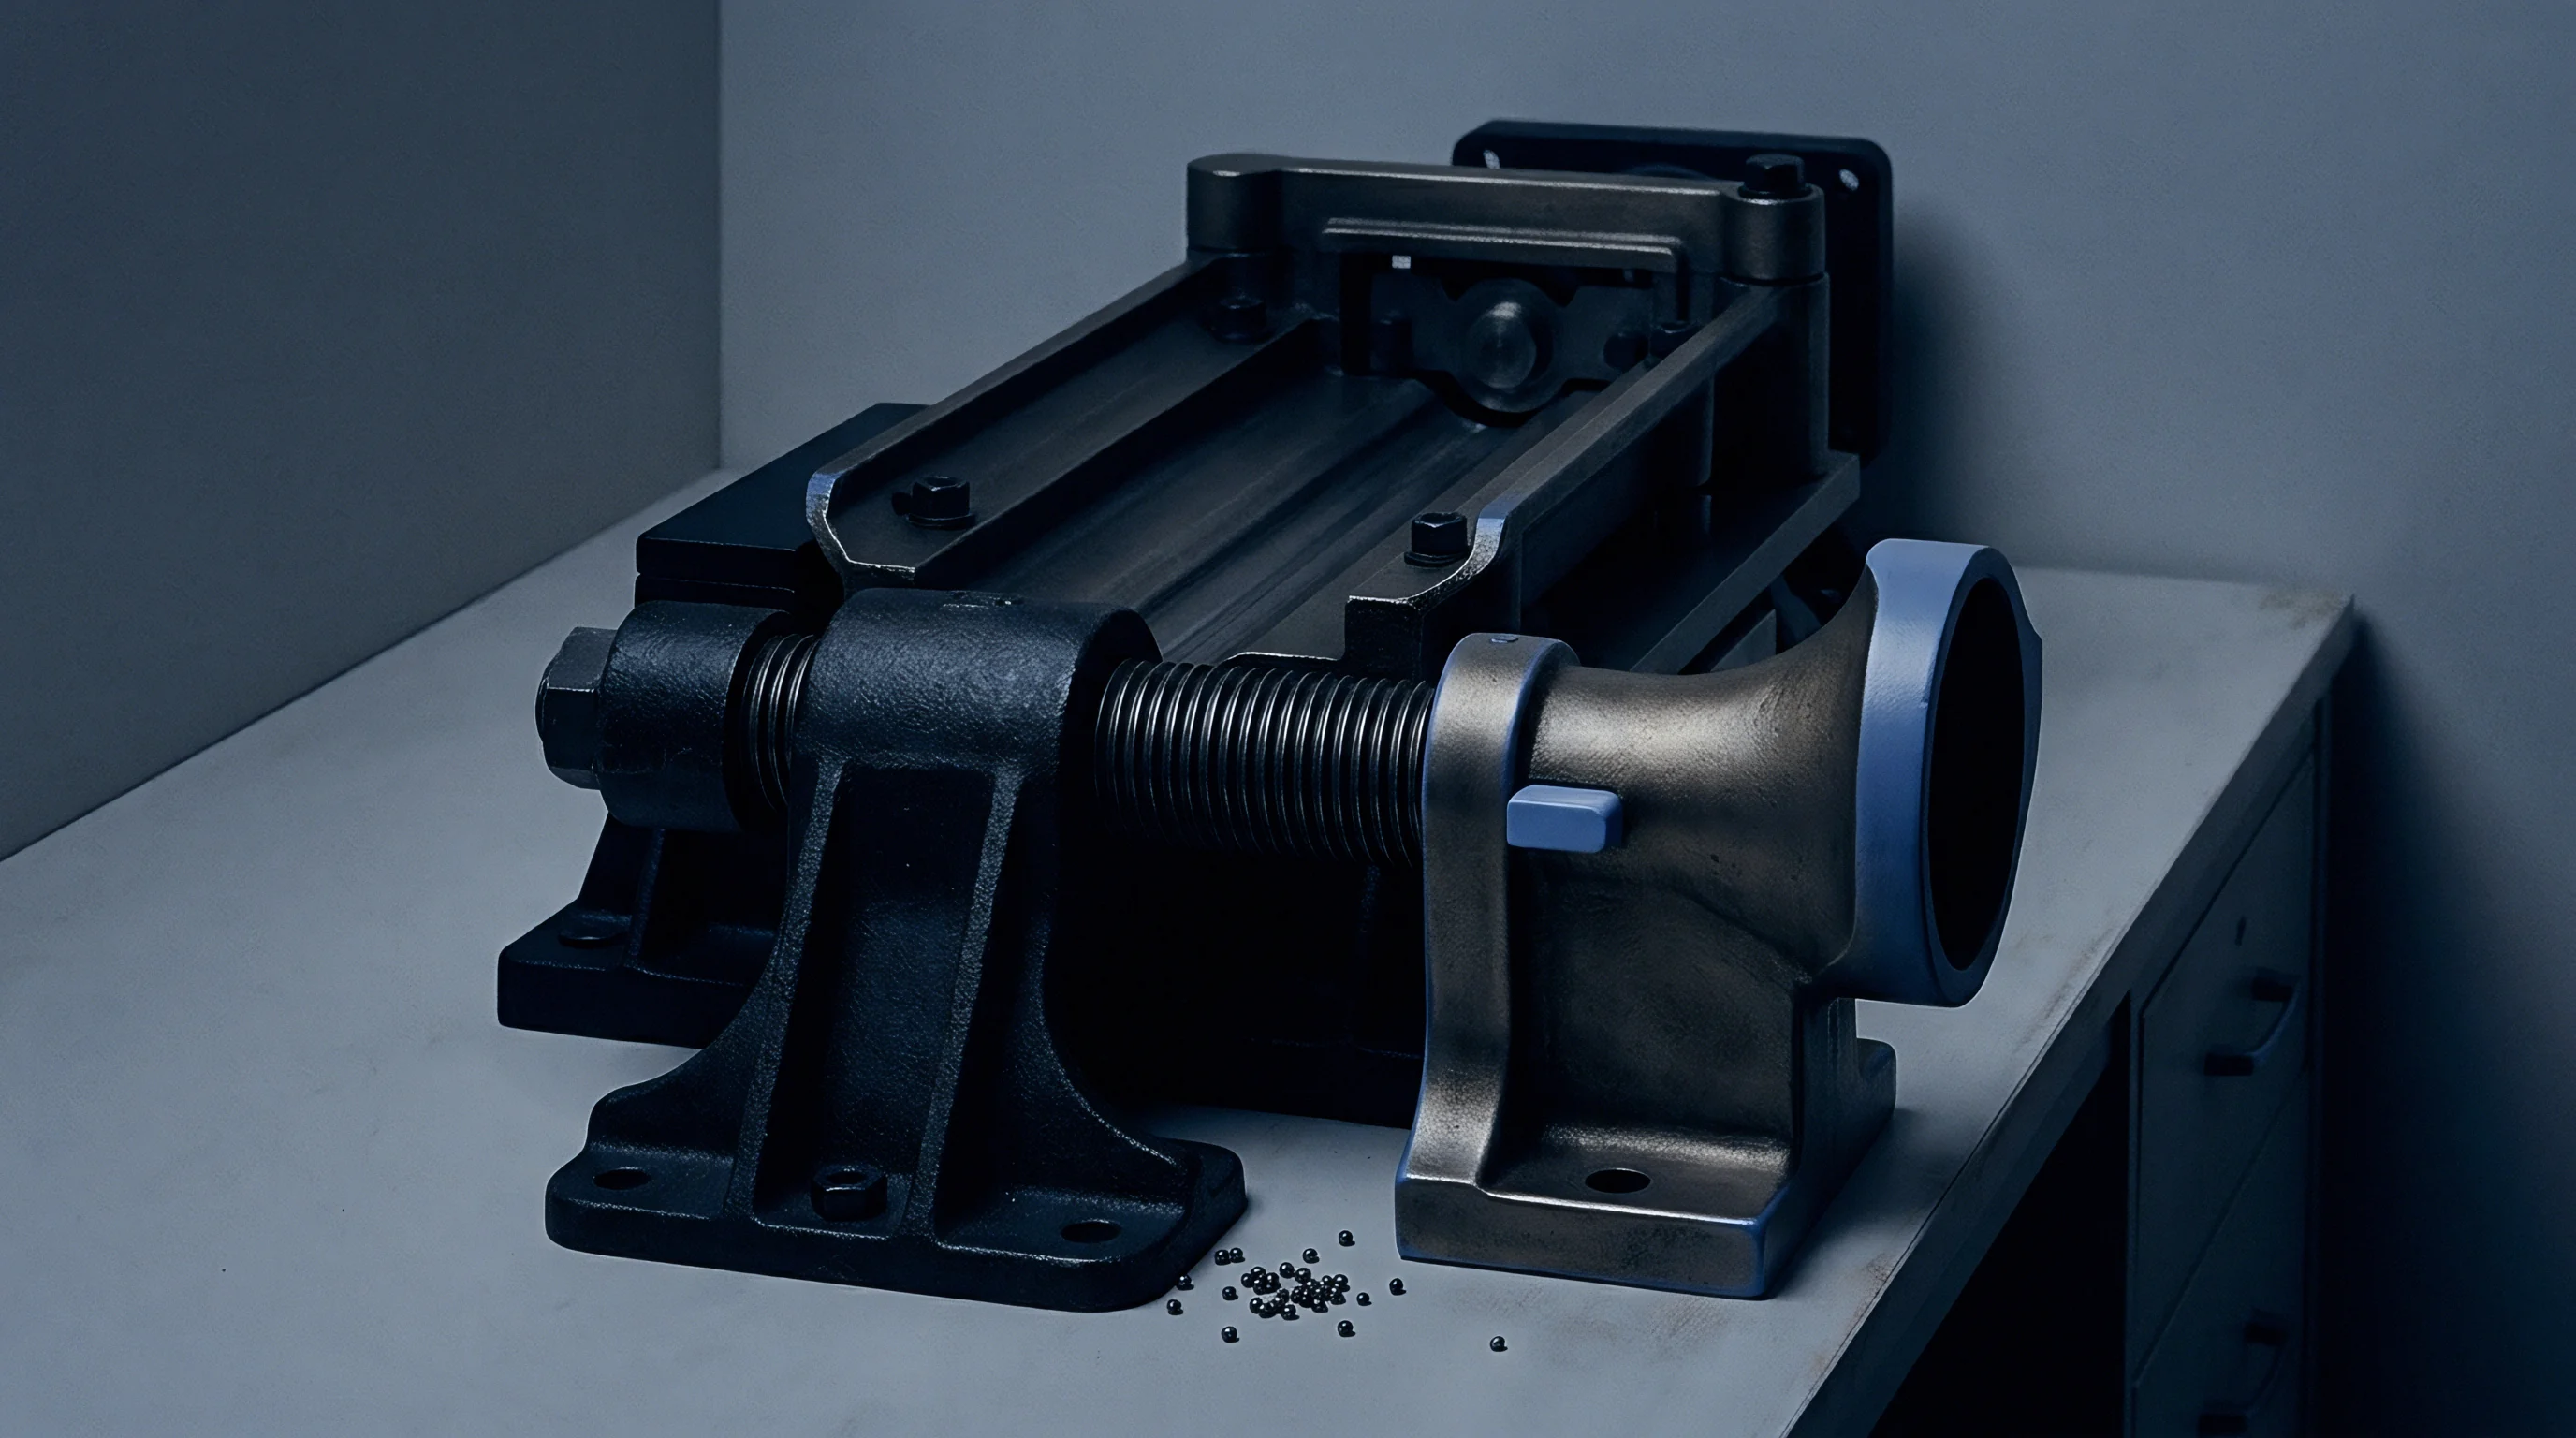

Layer
In prismatic lithium iron phosphate cells, electrochemical degradation stems from ongoing reactions between the graphitic carbon anode and the organic carbonate electrolyte. While the LFP cathode provides strong thermal stability and structural integrity, overall cell lifespan depends on parasitic side reactions at the negative electrode. During initial formation, solvent reduction creates a solid electrolyte interphase.
This passivating film shields the graphite from continuous electrolyte breakdown, though forming it draws active lithium ions directly from the cathode matrix.
Available lithium inventory ultimately sets the boundary for total cell lifetime.
Under normal operating conditions, steady growth of the solid electrolyte interphase drives most capacity fade. Mechanical stress from lithium intercalation during cycling creates micro-cracks in this passivating layer. The exposed graphitic carbon immediately reacts with surrounding electrolyte, trapping additional lithium ions in insoluble species such as lithium carbonate, lithium alkyl carbonates, and lithium fluoride.
This permanently consumes cyclable charge carriers while thickening the film and increasing internal resistance.

Kinetic Drivers of Solid Electrolyte Interphase Growth
Passivation film growth at the graphite-electrolyte interface drains active charge carriers during both initial formation and ongoing cycling. During static storage, growth follows square-root-of-time diffusion kinetics as solvent molecules move through the established film. Higher temperatures accelerate this diffusion, driving faster parasitic electron transfer across the interface.
Solvent breakdown produces gas along with solid degradation products. As ethylene carbonate and dimethyl carbonate decompose, they release ethylene, carbon monoxide, and carbon dioxide. In sealed prismatic cases, this gas buildup raises internal pressure, altering stack tension and disrupting interphase uniformity across the active electrode surface.
Meanwhile, electrolyte depletion reduces ionic conductivity within the porous separator, steepening local polarization gradients.
Distinguishing Lithium Loss from Material Isolation
Pinpointing the causes of capacity fade requires distinguishing between separate thermodynamic failure modes. Loss of lithium inventory occurs without structural damage to the active crystal lattice ~ it reflects charge carriers bound up in passivation byproducts. Loss of active material at the negative electrode happens when graphite particles lose electrical contact with the current collector, isolated by micro-cracking or thick, non-conductive deposits.
Active material loss at the positive electrode follows a different path. Iron dissolution and micro-strain inside the olivine crystal structure drive localized phase separation. When active material isolation dominates, the cell displays steep voltage drops near the end of discharge.
By contrast, lost lithium inventory appears as a uniform narrowing of the voltage plateau across full charge and discharge cycles.
Chemical passivation film growth at the negative electrode consumes cyclable lithium ions continuously throughout calendar aging.
Transition Metal Dissolution and Cathodic Parasitics
Iron leaching from the olivine lattice triggers a self-accelerating breakdown chain at the negative electrode. Trace moisture in the organic carbonate electrolyte reacts with lithium hexafluorophosphate salt to form hydrofluoric acid, which attacks the olivine structure and dissolves divalent iron ions into the liquid electrolyte.
Dissolved iron ions then migrate through the separator pores.
Upon reaching the graphite anode, dissolved iron species reduce into metallic iron nanoparticles on the surface. These deposits break up the protective film and create catalytic sites that accelerate solvent decomposition and localized lithium plating. Even though the olivine cathode maintains structural integrity far better than layered oxide chemistries, migrating trace iron causes severe secondary damage at the graphite interface.
| Storage Temperature | Loss of Lithium Inventory (%) | Loss of Active Material Anode (%) | Loss of Active Material Cathode (%) | Impedance Growth (mΩ) |
|---|---|---|---|---|
| 25 °C | 4.2 | 0.8 | 0.3 | 0.12 |
| 45 °C | 9.6 | 1.9 | 0.7 | 0.35 |
| 60 °C | 18.4 | 4.1 | 1.5 | 0.88 |
Electrolyte stabilization additives and capacity recovery after full rest periods are often cited to demonstrate baseline chemistry stability despite accelerated capacity loss during high-temperature storage.
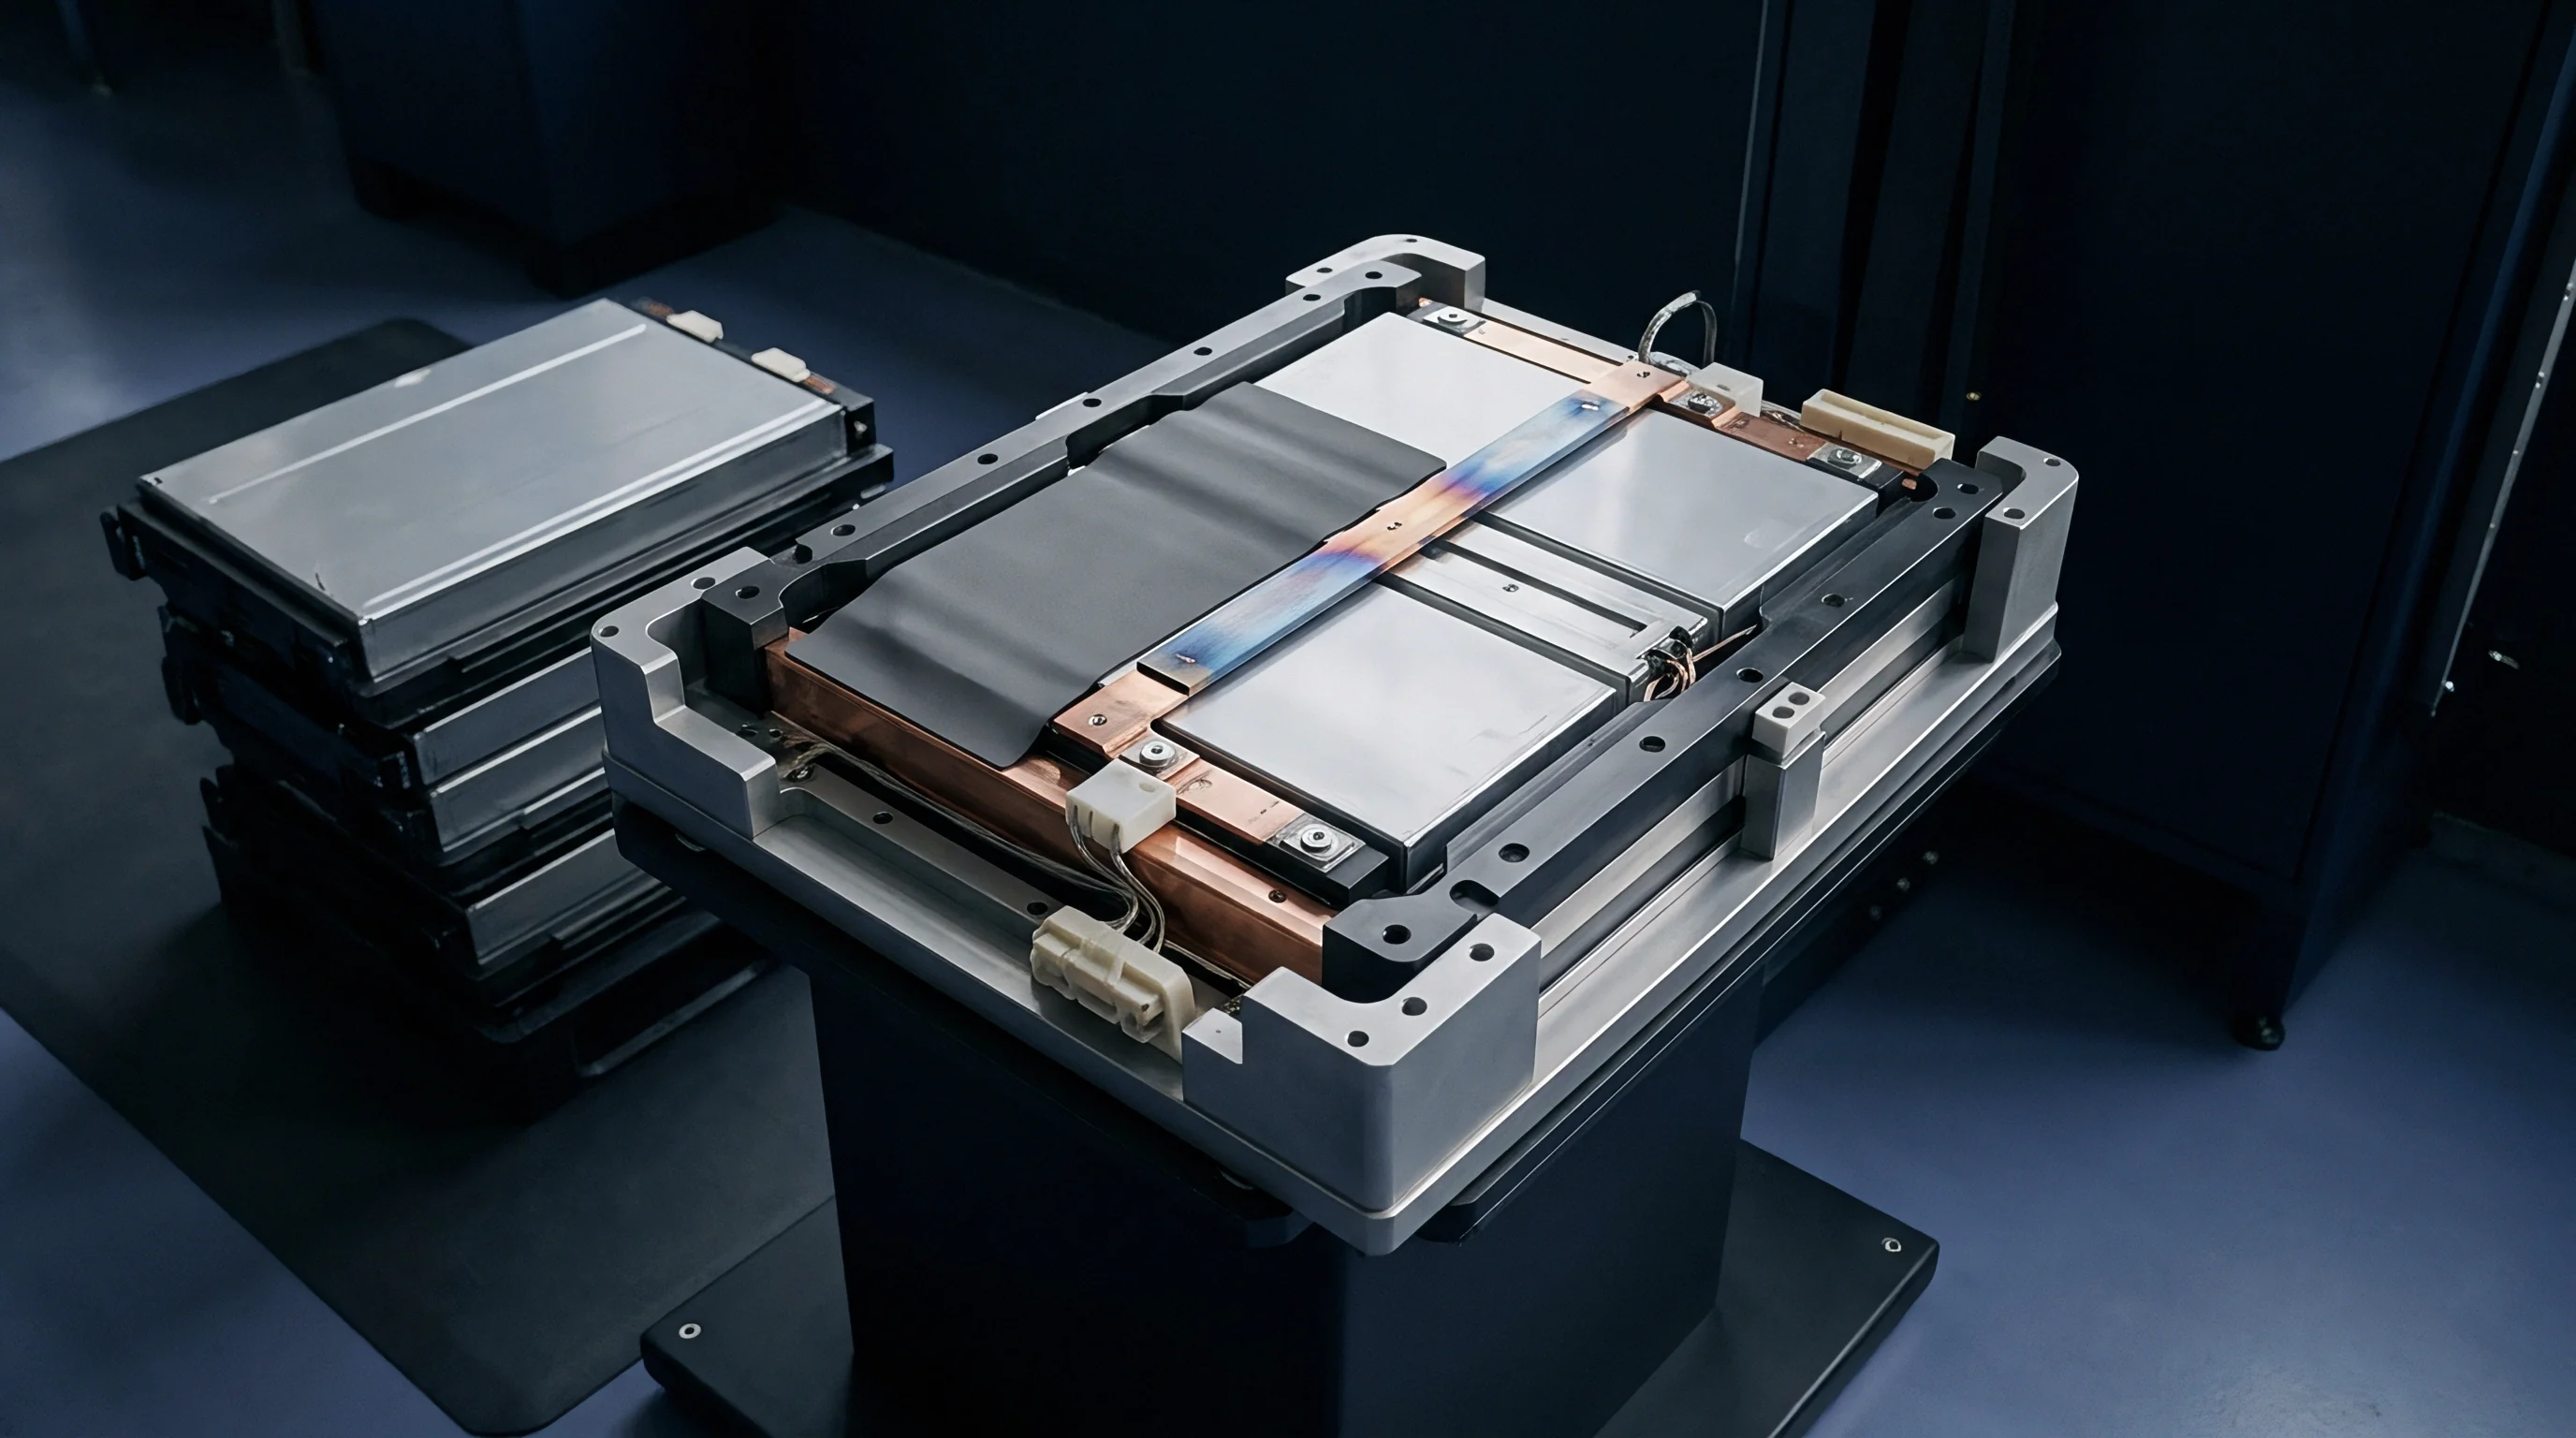

Swell
Physical volume changes during lithium insertion and extraction create mechanical stress inside prismatic cell cases. Graphitic carbon expands by roughly ten percent at full lithiation. In wide-format prismatic cells with tightly packed electrode stacks or jellyrolls, this cumulative expansion exerts significant force against the outer housing.
Internal stack pressure directly alters interphase stability.
Unconstrained expansion results in uneven electrode contact, localized spikes in current density, and electrolyte displacement from the center of the stack. Conversely, excessive external clamping crushes the porous separator, reducing electrolyte retention and inducing micro-shorts along edge folds. Managing these forces across thousands of cycles requires precise control over external mechanical pressure.

Stack Expansion and Internal Mechanical Pressure
Graphite anodes expand by roughly ten percent at full lithiation, forcing dimensional shifts across the stacked electrode sheets. In prismatic cells, this expansion acts perpendicular to the electrode face, compressing separators and driving internal stack pressure past several megapascals. Over time, repeated cycles of compression and relaxation delaminate active material from the copper current collectors.
Dynamic mechanical loads cause fatigue in the cell tabs.
Internal pressure is rarely uniform across large prismatic cells. The center of the stack experiences the highest confinement stress, restricting electrolyte replenishment during fast charging. Where separator pores collapse under heavy local compression, dry spots form, shifting ionic current density toward the cell edges and accelerating degradation there.
Prismatic cells operating under a constant mechanical restraint of 300 kilopascals maintain double the cycle life compared to unrestrained cells operating at 45 degrees Celsius.
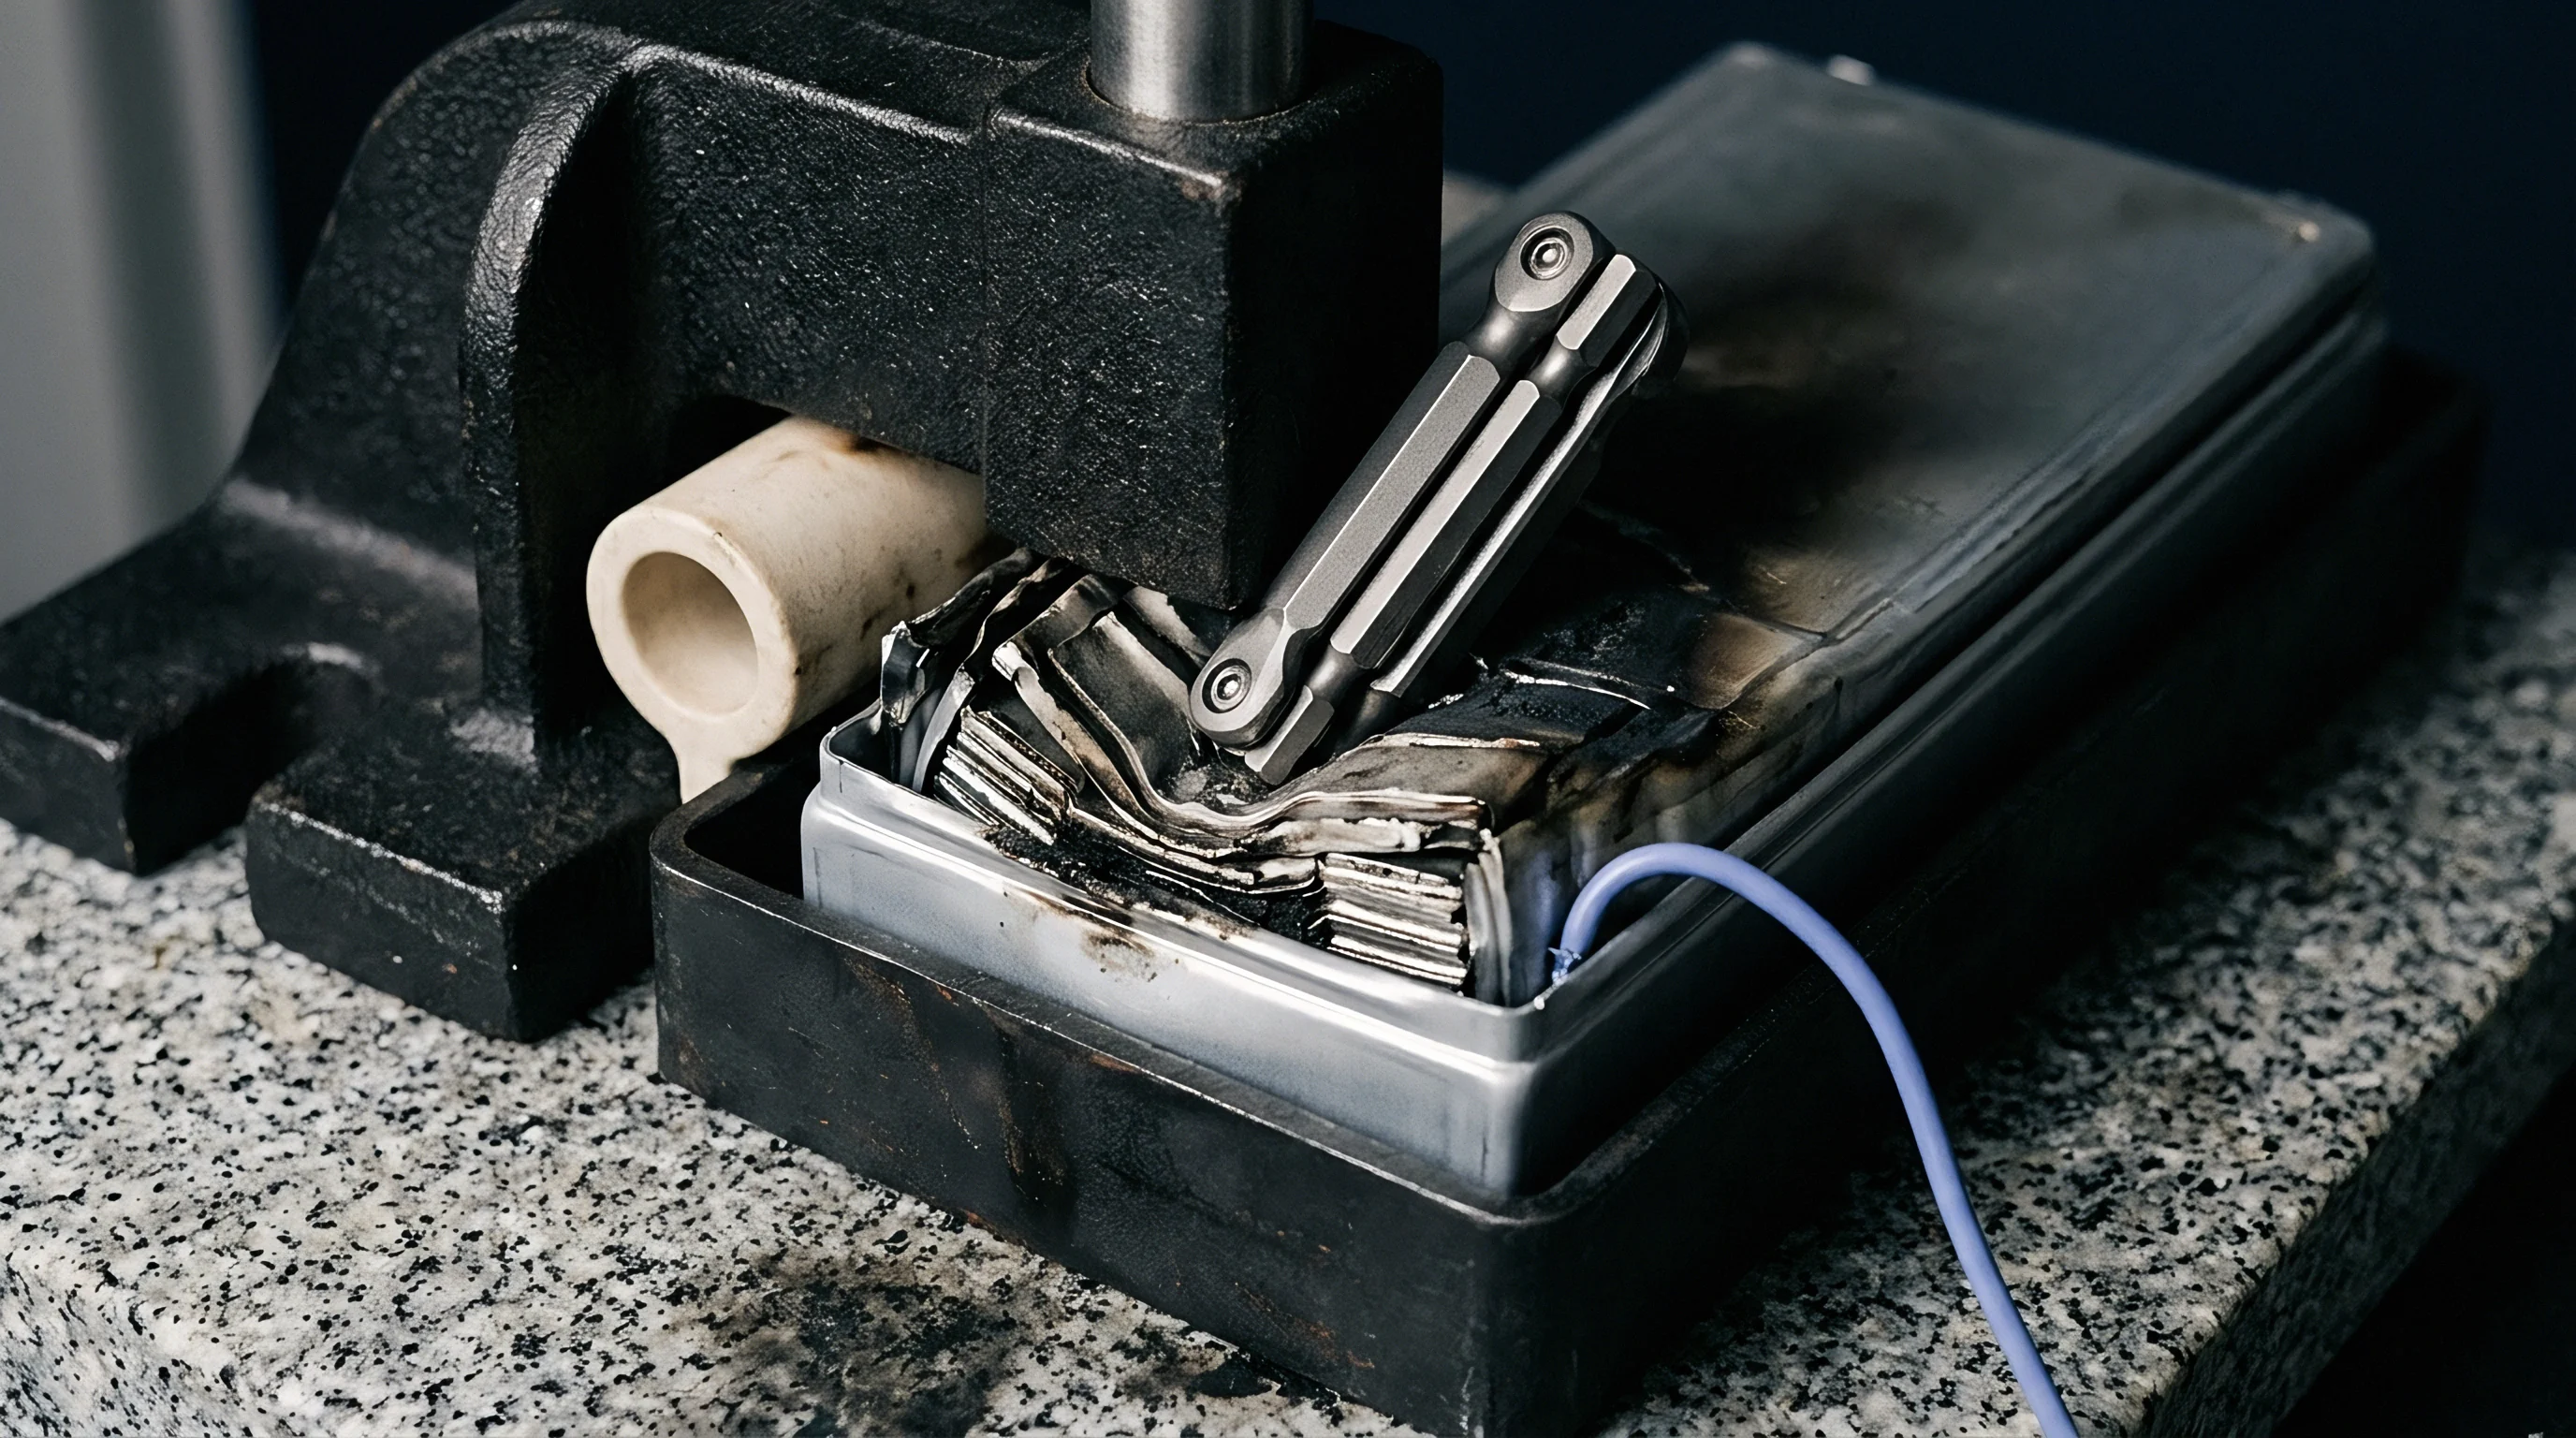
Structural Failure Modes in Hard Case Prismatic Enclosures
Rigid aluminum outer cases absorb the cumulative forces generated as the internal jellyroll expands during extended cycling. Over time, continuous cycling breaks down internal components, altering geometric tolerances and creating physical defects inside the enclosure.
Deformation of the casing alters internal electrolyte distribution.
- Housing Dome Bulging occurs when internal gas pressure and stack expansion exceed the yield strength of the aluminum case, pushing the side walls beyond nominal dimensions.
- Separator Pore Closure results from extreme local stack pressure, which restricts lithium ion diffusion and increases charge transfer resistance across central electrode zones.
- Tab Weld Fatigue stems from micro-movement of the internal jellyroll relative to terminal post connections, creating local resistance spikes or complete disconnects.
- Electrolyte Squeeze-Out occurs when high stack compression forces liquid electrolyte out of porous active layers into outer housing voids, accelerating cell dry-out.
Maintaining external mechanical restraint at fixed compression limits micro-delamination while preserving electrolyte wetting across internal electrode layers.

Drift
Control algorithms in energy storage systems dictate how rapidly chemical degradation accumulates over calendar time. Operating state of charge, ambient temperature, charge and discharge rates, and depth of discharge determine capacity retention. Stepping outside nominal operating windows accelerates degradation kinetics, shifting aging from slow passivation growth to destructive active material loss.
Calendar aging continues throughout transit and storage.
Prismatic LFP cells exhibit very little open-circuit voltage variation between twenty and eighty percent state of charge. This flat voltage profile complicates accurate state-of-charge estimation, increasing the risk of holding cells at extreme voltage limits unnoticed. Sustained high voltage accelerates parasitic side reactions, while deep discharge leads to copper current collector dissolution.

State of Charge Operating Window Impact
Prolonged operation at full state of charge elevates the chemical potential difference between the electrodes and the liquid electrolyte. At high states of charge, the graphite anode drops to its lowest potential relative to metallic lithium, increasing the thermodynamic drive to reduce solvent molecules and consume cyclable lithium.
Operating at high states of charge accelerates interphase growth.
Capping the upper state of charge at ninety percent cuts calendar fade rates by more than half under ambient storage. Operating within narrower state-of-charge bands also minimizes lattice strain in cathode particles, preserving crystal stability over extended lifespans.

Why Does High SOC Storage Accelerate LFP Capacity Fade beyond Kinetic Predictions?
Accelerated aging at high potential stems from cathode structural stress combined with elevated electrolyte oxidation. Even though lithium iron phosphate is structurally robust, sustained high potential accelerates trace impurity oxidation at the positive electrode interface. These oxidation products diffuse across the separator to the anode, disrupting the protective solid electrolyte interphase and consuming additional lithium to re-establish passivation equilibrium.

Low Temperature Plating Dynamics and Rate Sensitivity
Charging below room temperature alters reaction kinetics by slowing lithium ion transport in the liquid electrolyte. As temperatures drop, lithium diffusion through separator pores slows sharply, while charge transfer resistance at the graphite interface rises exponentially.
Retained capacity drops sharply under severe operating stress.
If the overpotential required for lithium insertion into graphite exceeds the reduction potential of metallic lithium, lithium metal deposits directly onto the anode surface. Plating consumes active charge carriers and creates severe safety risks, as metallic dendrites can pierce polyolefin separators and trigger localized thermal runaway.
- Continuous High SOC Storage accelerates calendar aging by holding the maximum electrochemical potential difference between electrodes during long idle periods.
- Sub-Zero Fast Charging forces metallic lithium deposition on graphite surfaces because of severe charge-transfer polarization.
- Deep Discharging Below One Volt causes copper current collector oxidation and dissolution, forming conductive metallic bridges upon recharge.
- Thermal Gradient Exposure causes uneven current density distribution across large prismatic plates, concentrating degradation in high-temperature regions.
Operating prismatic cells within twenty to eighty percent state of charge limits extends operational cycle life by up to three hundred percent compared to full depth of discharge cycling.
| SOC Operating Range (%) | Charge/Discharge C-Rate | Capacity Retention (%) | DC Internal Resistance Increase (%) | Dominant Degradation Mode |
|---|---|---|---|---|
| 0 to 100 | 1.0C / 1.0C | 78.5 | 42.1 | LLI + Anode Delamination |
| 10 to 90 | 0.5C / 0.5C | 88.2 | 18.6 | Linear LLI |
| 20 to 80 | 0.25C / 0.5C | 94.1 | 9.4 | Slow Passivation Growth |
| 0 to 100 | 2.0C / 2.0C | 69.4 | 78.3 | Lithium Plating + Separator Stress |
Whether micro-cracking within primary polycrystalline LFP particles is the main driver of long-term impedance growth under high C-rate cycling remains actively debated across industrial labs.


Scan
Non-destructive electroanalytical diagnostics make it possible to identify dominant aging mechanisms without opening manufactured prismatic cells. By analyzing precise voltage, current, and temperature data, analytical models separate thermodynamic capacity loss from kinetic impedance growth. Advanced characterization isolates internal failure pathways long before macro-scale thermal or capacity loss becomes visible.
Differential capacity curves highlight active lithium loss.
Evaluating differential capacity peaks separates active lithium loss from active material isolation. Tracking peak shifts over time provides clear visibility into state-of-health trajectories without destructive teardowns. Combining differential capacity analysis with electrochemical impedance spectroscopy gives a complete diagnostic profile suitable for quality control and warranty verification.

Differential Capacity Analysis and Peak Tracking
Converting standard charge-discharge curves into differential capacity profiles makes discrete phase transitions clearly visible. Plotting the derivative of capacity with respect to voltage turns subtle voltage plateaus into distinct differential capacity peaks. Each peak corresponds to a specific thermodynamic phase equilibrium state within the graphite anode and lithium iron phosphate cathode.
A reduction in peak area directly measures active lithium loss.
As lithium inventory drops from ongoing solid electrolyte interphase growth, differential capacity peaks shift along the voltage axis and drop in height. A horizontal shift of anode phase transitions relative to cathode peaks indicates loss of lithium inventory, whereas a reduction in peak height without a voltage shift signals loss of active electrode material. Tracking these peaks quantitatively allows engineers to determine whether capacity fade is driven by chemical degradation or physical electrode isolation.
Impedance Spectroscopy Decomposition Mechanics
Frequency-domain impedance measurements break down internal resistance contributions into distinct physical mechanisms. By applying a small sinusoidal AC voltage perturbation across a broad frequency spectrum, electrochemical impedance spectroscopy separates total internal resistance into pure ohmic resistance, passivation film resistance, charge transfer resistance, and solid-state diffusion impedance.
Charge transfer resistance dominates high-rate capacity fade.
The high-frequency intercept on the real axis measures ohmic resistance, reflecting electrolyte conductivity, current collector foil resistance, and tab weld integrity. The first semi-circle at high-to-mid frequencies captures solid electrolyte interphase resistance, while the second semi-circle at mid-to-low frequencies measures charge transfer resistance at the electrode-electrolyte interface. The low-frequency linear tail represents Warburg diffusion impedance of lithium ions within host crystal lattices.
Under UN 38.3 test summary requirements, cell manufacturers provide signed documentation verifying that mass loss does not exceed 0.1 percent following thermal abuse cycling.
- Connect the fully rested prismatic cell to a high-precision battery test system calibrated to temperature tolerances within 0.1 degrees Celsius.
- Perform a full discharge to the minimum voltage cutoff at a constant current rate of 0.05C to obtain quasi-equilibrium thermodynamic voltage curves.
- Execute an electrochemical impedance spectroscopy sweep from 10 kilohertz to 10 millihertz at fifty percent state of charge under open-circuit equilibrium conditions.
- Calculate differential capacity derivatives using low-pass Savitzky-Golay filtering to suppress electrical measurement noise.
Stored at high state of charge, secondary market prismatic cells exhibit around a 14 percent shift in charge-transfer resistance.
Incomplete electrochemical impedance data can mask early-stage lithium plating, leading to unexpected laboratory re-testing costs.

Claim
Translating electrochemical degradation data into enforceable supply contracts defines financial exposure for system integrators. Cycle life claims on vendor datasheets routinely rely on best-case laboratory conditions that rarely reflect field operations. Commercial procurement agreements bridge this gap by establishing clear performance baselines, explicit test protocols, and defined warranty remedies.
Contractual bounds enforce realistic battery life targets.
Effective procurement agreements bind capacity retention warranties directly to operating temperature logs and duty cycle records. Warranties based solely on cycle counts without environmental limits leave buyers fully exposed to thermal and calendar aging risks. Objective compliance standards protect capital investments across large storage deployments.

Mandatory Safety Certification Limits versus Warranty Lifespans
Standardized type testing protocols evaluate catastrophic failure thresholds rather than progressive capacity retention. Compliance certifications verify safety under extreme abuse, offering no guarantee of long-term electrochemical durability or warranty performance.
Improper clamping voids factory warranty coverage.
UN 38.3 transport testing subjects cells to altitude simulation, thermal shock, vibration, impact, external short circuit, and forced discharge. While UN 38.3 certification is legally required for international shipping, passing it confirms only that the cell will not burst, catch fire, or leak during transit. Likewise, safety standards like IEC 62619 and UL 1973 evaluate mechanical and electrical abuse resistance without guaranteeing that a cell will maintain its rated capacity over its target lifespan.

End of Life Thresholds and Contractual Liability
Commercial contracts typically define cell end of life as the point where usable capacity falls to eighty percent of nominal rating. In stationary storage applications, internal resistance growth often forces system replacement long before total capacity drops below eighty percent. Higher internal resistance drives up local heat generation, lowers round-trip energy efficiency, and forces HVAC systems to draw excess cooling energy.
Landed cost calculations account for warranty risks.
Supply contracts specify precise degradation testing protocols, including C-rates, ambient test temperatures, rest periods, and allowable state-of-charge windows. When performance disputes arise, accredited third-party laboratory testing determines whether capacity loss stems from manufacturing defects or operator abuse outside contractual limits.
| Standard / Agreement | Primary Evaluation Scope | Pass / Fail Metric | Commercial Allocation Risk |
|---|---|---|---|
| UN 38.3 (T.1 – T.8) | Transport Safety & Structural Integrity | No Fire, Rupture, Leakage, or Mass Loss | Regulatory Border Seizure Risk Only |
| IEC 62619 | Industrial Stationary Safety | Propagation Resistance under Abuse | System Safety Liability Baseline |
| UL 1973 | North American Stationary Certification | Electrical, Mechanical & Environmental Safety | Jurisdictional Deployment Authorization |
| Commercial Warranty Annex | Capacity Retention & Resistance Growth | Defined SOH Retention over Time/Cycles | Direct Landed Asset Depreciation Risk |
Inserting Clause 14.2 into cell purchase agreements shifts financial liability for capacity fade exceeding two percent annually back to the vendor, provided operating logs confirm compliance with agreed thermal limits.