Differential Voltage Analysis Methods for Sub Zero Lithium Plating Detection
Differential voltage analysis detects sub-zero lithium plating by identifying the distinct phase-transition stripping peak during relaxation or early discharge.


Inflection
Sub-zero lithium deposition on graphitic anodes shows up as distinct electrochemical phase transitions during relaxation and early discharge. Standard constant-current charge profiles tend to mask this metallic plating behind mixed charge-transfer overpotentials. When a graphite negative electrode operates below 0 degrees Celsius, it encounters severe solid-state diffusion starvation.
Intercalation kinetics stall once the desolvation energy barrier climbs past 60 kilojoules per mole. As local graphite composite potential falls below 0 volts versus the Li/Li+ reference couple, thermodynamic forces favor reducing solvated lithium ions directly into metallic lithium adatoms. Differential voltage analysis separates these ambiguous voltage curves into explicit phase transition signatures, isolating the metallic lithium stripping plateau from normal staging deintercalation regimes.
Detection relies on tracking the derivative of terminal cell voltage against stripped discharge capacity or elapsed relaxation time. During charging at minus 20 degrees Celsius, metallic lithium accumulates unevenly across the anode face, gathering heavily near the separator where ionic flux peaks. Once the current cuts out, this deposit behaves along competing paths.
Part of it reacts spontaneously with organic carbonates to form secondary solid electrolyte interphase products. The rest either strips reversibly upon discharge or self-intercalates into under-lithiated graphite during rest. Differential voltage curves capture these dynamics by plotting dV/dQ against discharge capacity or dV/dt against rest time, where the transition between metallic lithium dissolution and stage-one graphite deintercalation forms a sharp inflection point.
Locating this inflection point shows whether an incoming cell lot survived cold-weather qualification without permanent capacity loss. Relying on basic cycle testing without differential analysis risks accepting cells that harbor dendrites capable of causing internal shorts. Standard battery cyclers log data at intervals far too coarse to catch millivolt-scale transitions between coexisting phases.
Catching the differential peak shifts that signal dead lithium buildup requires continuous 24-bit analog-to-digital sampling.
Integrators and cell manufacturers frequently clash over acceptable sub-zero charging currents. Factory spec sheets often list optimistic charging envelopes ~ claiming 0.2C rates down to minus 10 degrees Celsius ~ without detailing the real margin against plating. Differential voltage verification shows that local electrode geometry, cathode-to-anode capacity ratios, and electrolyte wetting tolerances ultimately decide where intercalation stops and metallic plating begins.
Plating onset occurs when graphite overpotential forces local potential below zero volts versus lithium reference, triggering concurrent metallic nucleation and parasitic solvent consumption.
Deploying energy storage containers in sub-arctic environments creates serious liability if cold-charging limits rely purely on pack-level temperature telemetry. In a single 280Ah prismatic cell, thermal gradients between the core and terminal posts can hit 5 Kelvin during forced thermal conditioning. The colder electrode margins dip into negative potentials long before external pack sensors detect the imbalance.
Differential voltage analysis serves as the ground-truth method to map non-plating charge envelopes across operating temperatures.
The shift from uniform thin-film deposition to mossy dendrite morphology becomes evident when the stripping plateau disappears from differential curves during extended cold soaks. When stripping peaks vanish while discharge capacity drops, the deposited metal has lost electrical contact with the graphite matrix. This dead lithium represents permanent inventory loss, accompanied by continuous gas evolution and climbing cell impedance.

Kinetics
Low-temperature charge acceptance runs into three sequential bottlenecks: bulk electrolyte transport, desolvation at the solid electrolyte interphase, and solid-state diffusion inside the graphite lattice. Dropping from 25 degrees Celsius to minus 20 degrees Celsius cuts liquid electrolyte conductivity by more than an order of magnitude, falling from roughly 10 milliSiemens per centimeter to under 1 milliSiemens per centimeter in standard ethylene carbonate formulations. Desolvation activation energy dominates overall cell impedance below freezing; lithium ions shed their coordinating solvent shells slowly, driving charge-transfer resistance up by a factor of twenty.

Electrolyte Transport and Desolvation Limits
Cyclic carbonate ratios produce rigid coordination shells that tightly bind lithium ions below zero degrees Celsius. Formulations containing 30 percent ethylene carbonate by volume thicken considerably, degrading transport numbers. Additives like fluoroethylene carbonate, ethyl methyl carbonate, and low-viscosity carboxylate esters help lower the ion transfer barrier.
Still, in commercial cells optimized solely for high-temperature cycle life, low-temperature desolvation resistance quickly eats away the remaining overpotential margin against metallic reduction.
Coating thickness and tortuosity govern where this kinetic bottleneck hits hardest. High-energy automotive cells with mass loadings exceeding 3.5 milliampere-hours per square centimeter develop steep concentration gradients through the electrode layer. Under cold charging, lithium ions deplete their gradient across the first ten micrometers of anode coating facing the separator.
While deeper graphite particles sit largely underutilized, the surface saturates, forcing remaining ionic flux to plate directly as metal on the outermost graphite faces.
Graphite Intercalation Dynamics
Solid-state diffusion through the graphite host represents the final serial resistance. The chemical diffusion coefficient of lithium in graphite drops from 10 to the negative 10th power square centimeters per second at room temperature to under 10 to the negative 12th power at minus 20 degrees Celsius. Intercalation moves through discrete staging steps ~ stage 4, stage 3, stage 2, and stage 1 ~ spanning stoichiometries from LiC24 to LiC6.
Under equilibrium, the transition between stage 2 (LiC12) and stage 1 (LiC6) exhibits an open-circuit potential near 85 millivolts versus Li/Li+.
Away from equilibrium at sub-zero temperatures, the combined overpotentials from ohmic drop, charge transfer, and solid diffusion easily pass 100 millivolts at charging rates as low as 0.05C. Once negative electrode potential drops below 0 millivolts versus Li/Li+, metallic nucleation proceeds alongside graphite intercalation, splitting total charge current according to competing exchange current densities.
Evaluating these kinetic limits requires accounting for cell architecture and cathode pairing. Pouch, cylindrical, and prismatic form factors apply different mechanical constraints to the jelly roll or stack, which alters inter-particle contact resistance and electrolyte path tortuosity.
| Temperature (Degrees C) | Ionic Conductivity (mS/cm) | Charge Transfer Resistance (Ohm cm2) | Solid Diffusion Coefficient (cm2/s) | Critical Plating Threshold (C-Rate) |
|---|---|---|---|---|
| 25 | 10.5 | 12 | 1.2e-10 | 1.50C |
| 10 | 7.2 | 28 | 6.4e-11 | 0.80C |
| 0 | 4.1 | 65 | 2.1e-11 | 0.30C |
| -10 | 2.0 | 180 | 5.5e-12 | 0.10C |
| -20 | 0.8 | 490 | 8.2e-13 | 0.02C |
| -30 | 0.2 | 1450 | 9.1e-14 | 0.005C |
| Values represent averages from symmetrical cell impedance spectroscopy and three-electrode flooded cell measurements using 1.0M LiPF6 in EC/EMC (3:7 by weight). | ||||
At minus 20 degrees Celsius, the critical plating current falls an order of magnitude below nominal datasheet ratings. Exceeding 0.02C at this temperature triggers immediate co-deposition alongside intercalation. System integrators using static BMS charge tables without dynamic temperature derating often produce heavy plating after just a few cold fast-charge cycles.
Internal resistive heating during cold charging elevates core temperatures, but laboratory verification shows that thermal lag leaves cell surfaces and perimeter tabs cold. Metallic plating establishes itself across peripheral electrode zones well before internal temperatures rise enough to accelerate desolvation kinetics.
Morphology
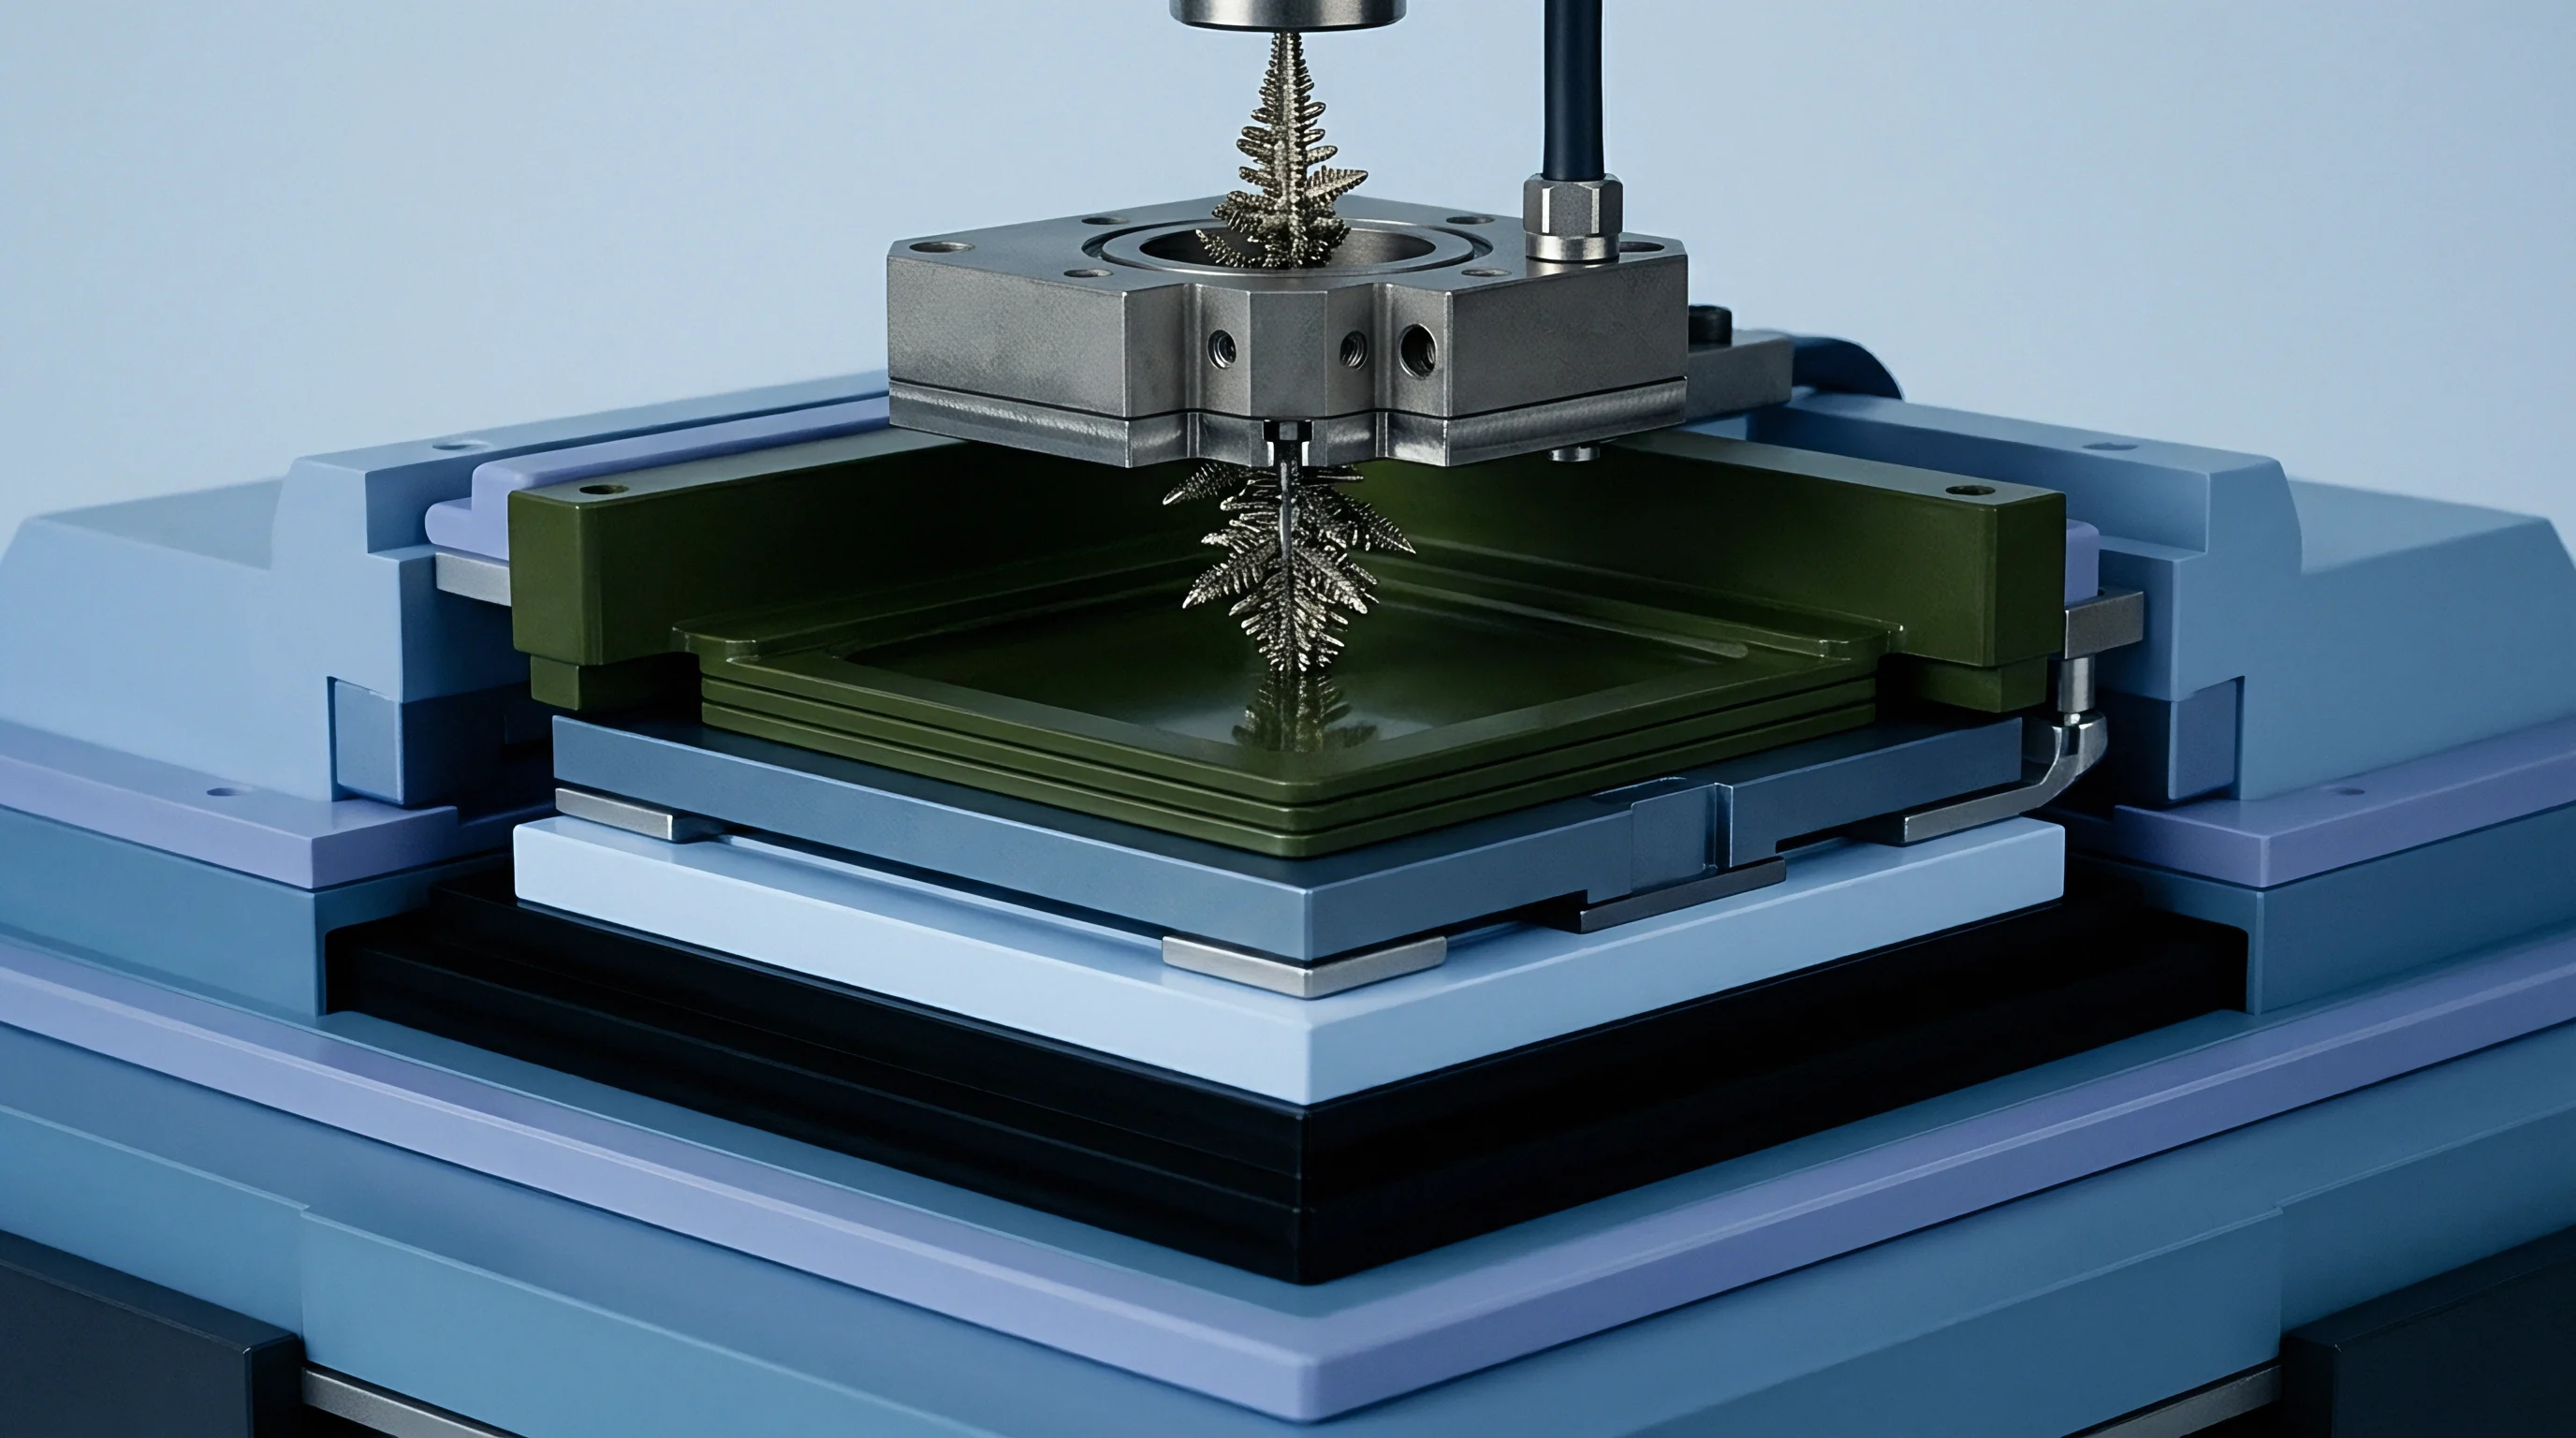
Deposited lithium assumes different morphologies depending on current density, temperature, and stack pressure. At room temperature, excessive overpotentials generally yield fine, branching dendrites with high specific surface areas. Below freezing, the balance between adatom surface diffusion and nucleation density alters this growth.
Reduced thermal energy limits the migration of newly reduced lithium adatoms across the substrate, producing clusters of isolated nuclei that merge into mossy or nodular films.
These sub-zero nodular layers coat the graphite facets, physically blocking intercalation pathways into basal planes. This layer introduces a secondary impedance barrier that starves underlying graphite particles of lithium and further inflates the overpotential driving deposition. With repeated cycling, volumetric expansion fractures the passivating solid electrolyte interphase, exposing fresh lithium metal to solvent reduction.
Deposit morphology directly governs how much lithium can be recovered versus what is permanently lost. Dense nodular lithium stays electrically tied to the carbon matrix much better than thin dendrites. On discharge, stripping dissolves the nodular base cleanly, recovering the metal into active ionic inventory.
Dendritic structures instead suffer from necking, where dissolution concentrates at narrow junction points. When a dendrite neck dissolves through, the tip loses electrical continuity, leaving dead lithium trapped in the separator pores.
Mechanical constraint changes these degradation dynamics. Prismatic cells clamped inside rigid pack enclosures experience localized swelling pressures reaching 0.3 megapascals during charge. Pouch cells held under spring-loaded compression maintain denser deposits with lower specific surface areas, mitigating electrolyte consumption.
Cylindrical cells rely entirely on winding tension within the can; as this tension slackens over thermal cycling, loose, mossy deposits expand along the outer wraps.
Tracking these morphological states electrochemically relies on phase stability during stripping. Because metallic lithium dissolves around 0 volts versus Li/Li+, it generates a flat, low-voltage discharge plateau distinct from the stepped potentials of graphite deintercalation. The duration, height, and sharpness of this stripping signature in differential voltage curves quantify both the volume and reversibility of the deposit.
Spring-loaded mechanical compression preserves metallic electrical connectivity, converting fragile dendritic growths into planar deposits that yield clean stripping signatures on discharge differential curves.
Missing these transitions early allows metallic deposits to stress separator membranes. Low-puncture-resistance polyolefin films eventually yield under sustained dendrite growth, producing soft internal micro-shorts that bleed capacity during rest. Ceramic-coated separators resist mechanical puncture more effectively, but dead lithium accumulation still clogs separator pores, driving up cell DC internal resistance.

Differentiation
Differential voltage analysis translates standard voltage curves into distinct peak signatures representing thermodynamic phase equilibria. On raw discharge curves, phase transitions appear only as subtle slope adjustments that make phase boundaries difficult to pinpoint. Taking the derivative of cell voltage with respect to discharge capacity, dV/dQ, isolates these transitions as clear peaks and troughs.
The derivative removes baseline polarization, exposing phase coexistence across lithium-graphite stages alongside metallic stripping reactions.
Mathematical Framework and Raw Signal Treatment
Meaningful differential analysis demands measurement resolution beyond standard factory cyclers. Raw data logging requires 24-bit ADC resolution and voltage accuracy within 50 microvolts; otherwise, quantization noise swamps the derivative. Simple point-to-point numerical differentiation amplifies high-frequency noise, creating spurious spikes that obscure chemical features.
Data conditioning relies on smoothing routines prior to differentiation. A second- or third-order Savitzky-Golay filter across a tuned window width protects sharp transition boundaries without introducing artificial phase shifts. Spline fits and kernel density smoothing across capacity intervals offer workable alternatives.
Differentiating the conditioned series produces the differential voltage curve:
dV/dQ = (V_k – V_{k-1}) / (Q_k – Q_{k-1})
For post-charge rest periods, differentiating terminal voltage against time produces dV/dt curves. In this domain, the self-intercalation of metallic lithium into partially lithiated graphite creates a distinct plateau that registers as a transient peak or shoulder during the initial hundreds of seconds of open-circuit relaxation.

Peak Identification and Stripping Signatures
A fresh graphite electrode discharging near equilibrium produces three primary dV/dQ peaks reflecting distinct stage transitions: LiC6 to LiC12 (stage 1 to stage 2), LiC12 to LiC18 (stage 2 to stage 3), and higher-order dilute stages down to unlithiated graphite. In an unplated cell at low currents, these peaks occur at consistent capacity points set by the positive-to-negative electrode balance.
When cold charging causes metallic deposition, a new peak surfaces at the very beginning of the discharge dV/dQ curve, well ahead of the stage 1 transition. This peak reflects electrochemical stripping of metallic lithium from the anode surface. Because stripping occurs below the stage 1 graphite potential, it forms an early differential voltage valley followed by a characteristic inflection peak.
The area and profile of this peak reflect both the severity and reversibility of plating. Integrating capacity under the stripping peak up to the inflection boundary yields reversible lithium capacity (Q_strip). Dividing this value by the total capacity delivered during the cold charge step defines the stripping efficiency, indicating what portion of the deposit returned to active inventory.
| Potential vs Li/Li+ (V) | Graphite Stoichiometry | Phase Transition Regime | dV/dQ Feature Characteristic |
|---|---|---|---|
| 0.00 to 0.05 | Li (metal) | Metallic Stripping Phase | Sharp initial trough followed by inflection peak |
| 0.08 to 0.09 | LiC6 to LiC12 | Stage 1 to Stage 2 Intercalation | Broad major peak defining primary high-SOC boundary |
| 0.12 to 0.14 | LiC12 to LiC18 | Stage 2 to Stage 3 Intercalation | Intermediate amplitude peak at mid-range SOC |
| 0.20 to 0.22 | LiC18 to LiC36 | Stage 3 to Stage 4 Intercalation | Narrow low-amplitude peak preceding dilute phases |
A related signature appears during open-circuit relaxation. Plated metallic lithium and adjacent under-lithiated graphite particles form a local galvanic couple. Driven by chemical potential differences, the metallic layer oxidizes while lithium ions insert into neighboring graphite lattices.
This self-intercalation pins open-circuit voltage 10 to 50 millivolts lower than standard relaxation profiles, producing a visible shoulder on the dV/dt curve.
Execution
Applying differential voltage verification in procurement requires translating these curves into concrete factory test procedures. Buyers qualifying cells for automotive or stationary battery packs must test incoming samples to audit vendor cold-charging claims. A standard acceptance batch plan follows ISO 2859-1 Level II normal inspection, sampling representative cells from incoming production lots.

Test Bench Setup and Environmental Controls
Thermal stability across the test rack governs signal consistency. Environmental chambers must hold setpoint temperatures within plus or minus 0.5 degrees Celsius over 48 hours. Cells require a minimum soak period of twelve hours at the target sub-zero temperature before applying current, with surface-mounted thermocouples on both positive and negative terminals confirming core thermal equilibrium.
Test channels require four-wire Kelvin connections landed directly on gold-plated or nickel-machined terminal clamps to rule out lead impedance. Shunts and power supplies must be calibrated to within 0.02 percent of full-scale output to prevent current ripple from distorting derivative calculations.
Sequential Protocol for Plating Detection
The test sequence isolates plating overpotentials through low-temperature charging followed by low-rate diagnostic discharge cycles. Quality inspection protocols follow this sequence:
- Preconditioning Cycle at 25 degrees Celsius using a 0.2C constant-current constant-voltage charge to 4.2V and a 0.2C discharge to 2.8V establishes baseline capacity and peak alignments.
- Thermal Soak at the target temperature ~ typically minus 10 or minus 20 degrees Celsius ~ for twelve continuous hours under open circuit ensures core equilibrium.
- Sub-Zero Stress Charge runs at the rated low-temperature current up to charge cutoff voltage, logging voltage, current, and terminal temperature every 100 milliseconds.
- Extended Open-Circuit Relaxation runs for at least four hours immediately post-charge to monitor self-intercalation plateaus via dV/dt analysis.
- Quasi-Equilibrium Diagnostic Discharge applies a low 0.05C rate at the soak temperature, stripping active deposits to resolve dV/dQ peaks without excessive IR distortion.
- Thermal Re-equilibration brings the cell back to 25 degrees Celsius for a 0.2C diagnostic cycle to measure net irreversible capacity loss.
Some labs skip the sub-zero diagnostic discharge, warming the cell directly to 25 degrees Celsius after charging to assess stripping at room temperature. While this shortens chamber occupancy, warming accelerates chemical self-intercalation, reabsorbing a portion of the plated metal and undercounting the defect. Stripping at cold temperatures preserves the deposit state as formed.
Procurement agreements that fail to define channel ADC bit depth, smoothing filter criteria, and diagnostic discharge rates leave buyers with disputed warranty claims once cold-climate capacity loss appears in the field.
Quantification
Turning differential voltage plots into engineering decisions requires integrating capacity across the stripping boundary. Sourcing teams look for clear numerical metrics: total plated mass, stripping reversibility, and the threshold current where deposition begins. These values form the technical basis for lot acceptance or rejection.
Working Calculation of Stripped Lithium Mass
Consider a nominal 100Ah prismatic lithium nickel manganese cobalt oxide (NMC 811) cell charged at 0.33C (33.0 amperes) following a thermal soak at minus 15 degrees Celsius. After four hours of rest, the cell discharges at 0.05C (5.0 amperes) while logging voltage at 10-millisecond intervals. A 50-point Savitzky-Golay polynomial filter smoothes the voltage data before calculating dV/dQ.
The differential curve exhibits an initial stripping trough followed by an inflection peak where the derivative tops out before falling toward the stage 1 boundary. This inflection occurs at 4.25 ampere-hours of discharge. Unplated baseline runs at the same temperature mark the start of stage 1 deintercalation at 0.65 ampere-hours due to initial capacitive effects.
Subtracting this baseline offset yields the net reversible stripping capacity:
Q_strip = 4.25 Ah – 0.65 Ah = 3.60 Ah
Using Faraday’s law of electrolysis, this capacity converts into physical mass of metallic lithium:
m_Li = (Q_strip M_Li) / F
With lithium molar mass M_Li at 6.941 grams per mole and Faraday’s constant F at 96,485 coulombs per mole (26.801 ampere-hours per mole), the stripped mass calculates directly:
m_Li = (3.60 Ah 6.941 g/mol) / 26.801 Ah/mol = 0.932 grams of metallic lithium
This value covers only the reversible fraction that stayed electrically connected through discharge. Total plated metal includes reversible lithium, parasitic SEI reactions, and isolated dead lithium:
Q_plated_total = Q_strip + Q_SEI_parasitic + Q_dead
Total plating is calculated by comparing low-temperature charge capacity against the subsequent discharge capacity after returning to 25 degrees Celsius. If the cell takes in 100.0 Ah during cold charge but delivers only 94.8 Ah on room-temperature discharge, 5.20 Ah of cyclable inventory was consumed. With 3.60 Ah recovered through stripping, the remaining 1.60 Ah represents permanently stranded lithium ~ 0.414 grams of active material lost in a single cycle.

Reversibility Ratios and Degradation Metrics
Stripping efficiency gauges interfacial reversibility and the extent of dead lithium formation:
eta_strip = Q_strip / (Q_strip + Q_irreversible_loss)
In this worked scenario, stripping efficiency evaluates to:
eta_strip = 3.60 Ah / (3.60 Ah + 1.60 Ah) = 0.692 (69.2 percent)
Efficiencies below 70 percent reflect heavy dendrite formation with high rates of electrical isolation or active electrolyte breakdown. Well-matched graphite anodes with engineered carbon coatings and fluoro-ester electrolyte blends typically maintain stripping efficiencies above 88 percent under identical minus 15 degrees Celsius test conditions.
| Charge Current Rate | Total Charged (Ah) | Stripping Capacity Q_strip (Ah) | Net Capacity Loss (Ah) | Stripped Mass (g) | Stripping Efficiency (%) |
|---|---|---|---|---|---|
| 0.05C (5A) | 100.0 | 0.00 | 0.05 | 0.000 | 100.0 |
| 0.10C (10A) | 99.4 | 0.45 | 0.18 | 0.117 | 71.4 |
| 0.20C (20A) | 97.8 | 1.85 | 0.82 | 0.479 | 69.3 |
| 0.33C (33A) | 94.8 | 3.60 | 1.60 | 0.932 | 69.2 |
| 0.50C (50A) | 88.2 | 5.40 | 3.85 | 1.398 | 58.4 |
Comparing currents reveals a clear transition threshold. At 0.05C, the cell shows no stripping peak, confirming pure intercalation. Increasing the rate to 0.10C initiates plating, producing 0.45 Ah of stripped lithium.
At 0.50C, severe overpotentials collapse stripping efficiency to 58.4 percent as dead lithium generation accelerates.
Incoming inspection audits must review raw dV/dQ integration bounds directly. Widening smoothing windows or shifting the integration cutoff higher along the voltage axis can roll unstripped dead lithium losses into general polarization categories, making out-of-spec lots appear compliant.
Qualification
Protecting capital investments requires incorporating differential voltage criteria directly into procurement agreements. When stationary storage facilities or fleet commercial EVs show premature capacity loss following their first winter, disputes routinely stall over whether the drop stems from standard calendar fade or unmonitored cold plating. Adding quantitative differential voltage limits to supply contracts establishes clear criteria for batch acceptance.

Purchase Specification Language
Supply agreements need to replace vague temperature ratings with enforceable test parameters. Datasheet claims that a cell can charge down to minus 20 degrees Celsius offer little commercial protection without defined plating limits. Clear covenants tie performance directly to measurable stripping thresholds:
The buyer’s legal team should insert explicit conditions: The supplier warrants that Cell lots subjected to continuous charging at 0.10C at minus 10 degrees Celsius shall exhibit zero detectable stripping peaks within the discharge dV/dQ profile between 0.00V and 0.08V versus Li/Li+, corresponding to Q_strip values below 0.05 percent of nominal rated capacity. The presence of a verified stripping peak exceeding this limit constitutes a Major Defect under incoming inspection terms, granting the buyer immediate right of lot rejection at the supplier’s sole expense.
Contracts should define test parameters explicitly, covering soak times, sampling intervals, filtering algorithms, and designated third-party testing labs. Without fixed rules for processing dV/dQ curves, vendors can smooth away stripping peaks using aggressive polynomial filtering.

Economic Consequences of Unchecked Sub-Zero Plating
Unchecked plating translates directly into warranty claims and premature replacement cycles. In a 50 megawatt-hour energy storage installation using 100Ah cells priced at 85 dollars per kilowatt-hour, raw cell value totals 4.25 million dollars. Aggressive winter charging schedules that induce unmonitored plating drive capacity losses around 6 percent per winter season, far outstripping the projected 1.5 percent baseline calendar fade.
Under these conditions, systems reach their 80 percent end-of-life threshold by year three ~ four years ahead of financial model projections. Early pack augmentation or cell replacement doubles planned capital outlays, eroding project returns. Rejection logistics further compound these losses through hazardous materials transport surcharges, marine insurance revisions, and customs reclassification costs.
Incorporating differential voltage stripping limits into purchase contracts shifts warranty burdens to the manufacturer before defective lots clear customs.
Production line audits show that low-temperature plating margins can swing widely between successive manufacturing lots. Variations in electrode calendering density change local pore tortuosity, while slight deficits in electrolyte fill leave upper jelly-roll edges dry and vulnerable to localized current crowding in sub-zero conditions. Screening incoming lots with differential voltage diagnostics catches these manufacturing defects before packs reach field installation.
Settlement
Resolving cold-weather degradation claims requires proving whether failure stems from cell manufacturing defects or operating errors by the integrator. During warranty investigations, cell manufacturers often argue that field integrators violated operating guidelines by charging below permissible temperatures or tampering with BMS derating schedules. Differential voltage analysis provides the core forensic evidence needed to resolve these claims.
Forensic engineers evaluate the progression of dV/dQ stripping peaks on returned field cells to establish whether plating occurred during isolated, high-current events or accumulated gradually over months of normal operation. Sudden overcurrent plating leaves sharp, narrow stripping signatures accompanied by physical deformation on separator surfaces. Long-term sub-zero plating generates broad, suppressed peaks alongside thick SEI layers, rising cell impedance, and uniform capacity loss across entire strings.
Arbitration settlements require pairing differential voltage logs with physical teardown analysis. Opening anodes inside an argon-atmosphere glove box provides direct optical and chemical confirmation of the deposits detected via dV/dQ. Scanning electron microscopy combined with inductively coupled plasma mass spectrometry confirms the exact mass of immobilized dead lithium calculated from electrochemical stripping integrals.
Disputes frequently center on whether factory datasheets provided genuine safety margins against plating. Many manufacturers calculate allowable charge envelopes using lumped-mass thermal assumptions that overlook internal concentration gradients. When differential voltage analysis proves that a cell plates metal during charging routines explicitly permitted by the manufacturer’s user manual, operational liability falls squarely on the cell supplier.
A unresolved question the industry leaves open is the exact thermodynamic threshold at which low-temperature plating transitions from a benign, fully reversible surface phase to an irreversible safety hazard under fluctuating real-world automotive drive cycles.