Sub-Zero Fast Charging Mechanics and Anode Overpotential Limits
Sub-zero fast charging accelerates graphite anode overpotential past 0 V vs Li/Li+, triggering metallic lithium plating that demands active pre-heating.

Thermodynamics
Fast charging a lithium-ion cell at sub-zero temperatures forces the negative electrode past its stable electrochemical window. Near room temperature (+25 °C), commercial graphite anodes intercalate lithium at potentials just above the thermodynamic reduction potential of metallic lithium (0.00 V versus Li/Li⁺). Fully lithiated graphite (LiC₆, Stage 1 intercalation) has an equilibrium potential between +0.06 V and +0.08 V versus Li/Li⁺.
That narrow window offers enough of a buffer against metallic lithium deposition at modest charge rates, but once ambient temperatures fall below 0 °C, charging currents quickly consume the remaining voltage margin.
During charging, the anode’s operating potential (Eanode) equals its thermodynamic equilibrium potential (Eeq, anode) minus the total anode overpotential (ηa). As current flows into the negative electrode, it drives a negative polarization shift:
E_{anode} = E_{eq, anode} – |eta_a|
Three distinct components make up this total overpotential. First is the ohmic drop (ηΩ) across the solid electrolyte interphase (SEI) film and the pore electrolyte. Second is the charge-transfer overpotential (ηct), tied to lithium ion desolvation and transfer across the electrode-electrolyte interface.
Third is the concentration overpotential (ηdiff), driven by solid-state transport resistance inside the graphite particles alongside ionic gradients within the porous matrix. Whenever local anode potential dips below zero, lithium deposition starts instantly.
The exchange current density (i0) of the graphite electrode dictates the charge-transfer overpotential via Butler-Volmer kinetics. Its temperature dependence follows an Arrhenius relationship, where Ea is the activation energy for charge transfer (typically 50 to 70 kJ/mol for graphite in standard carbonate electrolytes):
i_0(T) = A cdot expleft(-frac{E_a}{R cdot T}right)
Dropping the temperature from +25 °C to -20 °C cuts exchange current density by more than an order of magnitude. To sustain a constant charging current (I), the system forces a higher driving voltage (ηct), which pushes the local anode potential well below 0.00 V versus Li/Li⁺. Below 0.00 V relative to Li/Li⁺, metallic lithium plating (Li⁺ + e⁻ → Li0) becomes thermodynamically favored over intercalation into the graphite host (Li⁺ + e⁻ + C6 → LiC6).
Anode polarization exceeds 120 mV below zero degrees Celsius at 1.5C charge rates, driving local graphite potential to negative 45 mV versus lithium reference.
Plated lithium on the graphite surface sets off destructive side reactions. It reacts exothermically with carbonate solvents to form porous secondary SEI layers, stripping cyclable lithium and electrolyte from the cell. Below 0 °C, deposited lithium tends to grow as high-surface-area mossy or dendritic structures rather than smooth planar films.
These dendrites can pierce micro-porous polyolefin separators, creating localized micro-shorts. In high-energy pouch or cylindrical cells, the resulting hot spots can ignite volatile electrolyte vapors and trigger thermal runaway.
| Temperature (°C) | Equilibrium Potential (V vs Li/Li⁺) | Ohmic Overpotential (mV) | Charge Transfer Overpotential (mV) | Diffusion Overpotential (mV) | Net Anode Potential (V vs Li/Li⁺) | Plating Risk Profile |
|---|---|---|---|---|---|---|
| +25 | +0.085 | 12 | 28 | 18 | +0.027 | Negligible |
| 0 | +0.088 | 35 | 72 | 45 | -0.064 | Moderate Plating Onset |
| -10 | +0.092 | 68 | 145 | 92 | -0.213 | Severe Plating Regime |
| -20 | +0.096 | 125 | 290 | 180 | -0.499 | Critical Dendritic Growth |
| -30 | +0.101 | 230 | 580 | 340 | -1.049 | Immediate Shorting Hazard |
Uneven current distribution across the electrode thickness further compounds thermodynamic overpotentials. High-energy electrodes use thick coatings with high areal capacities (exceeding 3.5 mAh/cm²). At sub-zero temperatures, solvent viscosity climbs and ion mobility drops, driving up liquid-phase electrolyte resistance within the pores.
For standard 1.2 M LiPF₆ in EC/EMC (3:7 by weight), ionic conductivity (κ) plummets from 10.5 mS/cm at +25 °C to under 2.1 mS/cm at -20 °C. Charging current then bunches near the front surface of the anode facing the separator, spiking local overpotentials while the deeper graphite near the current collector stays largely underutilized.
The operational envelope of fast charging comes down to the race between intercalation kinetics and plating thermodynamics. Intercalation requires lithium ions to desolvate, move across the SEI, and diffuse into the graphite crystal matrix. Plating skips the solid-state diffusion barrier completely ~ it needs only desolvation and electron transfer at the surface.
When low temperatures stall solid-state diffusion, surface plating turns into the dominant charge-acceptance path. Evaluating low-temperature fast charging requires looking past total cell voltage to local anode overpotentials.
Low Temperature Desolvation Barriers
In liquid electrolyte, solvent molecules form a sheath around lithium ions that must be stripped away before insertion into the host lattice. This desolvation step is the single largest contributor to charge-transfer resistance at sub-zero temperatures. Carbonates like ethylene carbonate (EC) coordinate tightly with lithium ions because of their high dielectric constants and strong dipole moments.
Room-temperature thermal energy easily breaks these bonds, but at sub-zero temperatures, available thermal energy falls below activation thresholds, leaving desolvation impedance to dominate overall cell polarization. Electrochemical impedance spectroscopy shows charge-transfer resistance rising from under 5 Ω·cm2 at room temperature to over 350 Ω·cm2 at -20 °C.
Electrolyte additives such as fluoroethylene carbonate (FEC) or vinylidene carbonate (VC) shift the inorganic-to-organic balance of the SEI. An SEI rich in lithium fluoride (LiF) lowers the interfacial activation energy for lithium ion transport, helping suppress charge-transfer overpotentials in the cold. Even so, optimized SEI formulations cannot completely overcome desolvation barriers once temperatures drop below -15 °C under multi-C charge rates.
Phase Transformations and Intercalation Thermodynamics
Lithium intercalates into graphite through discrete phase transitions, passing from Stage 4 (LiC₇₂) through Stage 3 (LiC₃₆) and Stage 2 (LiC₁₂) to Stage 1 (LiC₆). Each step marks a specific plateau on the open-circuit potential curve. Dropping the temperature shifts these plateaus slightly due to entropic factors (dEeq/dT), but the more critical change is how kinetic barriers between transitions scale non-linearly in the cold.
The transition from Stage 2 to Stage 1 takes place below +0.10 V versus Li/Li⁺ and represents half of graphite’s total storage capacity. Because this occurs so close to 0.00 V, even a mild overpotential during Stage 1 formation pushes the local anode potential below zero. Managing sub-zero charging therefore requires careful control over the state-of-charge window where Stage 1 dominates to limit the thermodynamic push toward plating.
Whether modern high-nickel cathodes paired with silicon-graphite anodes can keep local anode potentials above 0.00 V versus Li/Li⁺ without active heating during a 15-minute 4C charge at negative 10 degrees Celsius remains an open question.

Node
Measuring negative electrode potential directly during fast sub-zero charging requires a reference electrode built into the cell structure. Two-terminal measurements give only total cell potential (Vcell = Ecathode – Eanode), hiding individual electrode polarizations. A cell showing an acceptable terminal voltage of 4.10 V might conceal an anode polarized to -0.15 V versus Li/Li⁺ alongside a cathode at +3.95 V versus Li/Li⁺.
Without an internal reference electrode, pack-level management systems cannot detect destructive lithium plating until capacity drops sharply or the cell fails.
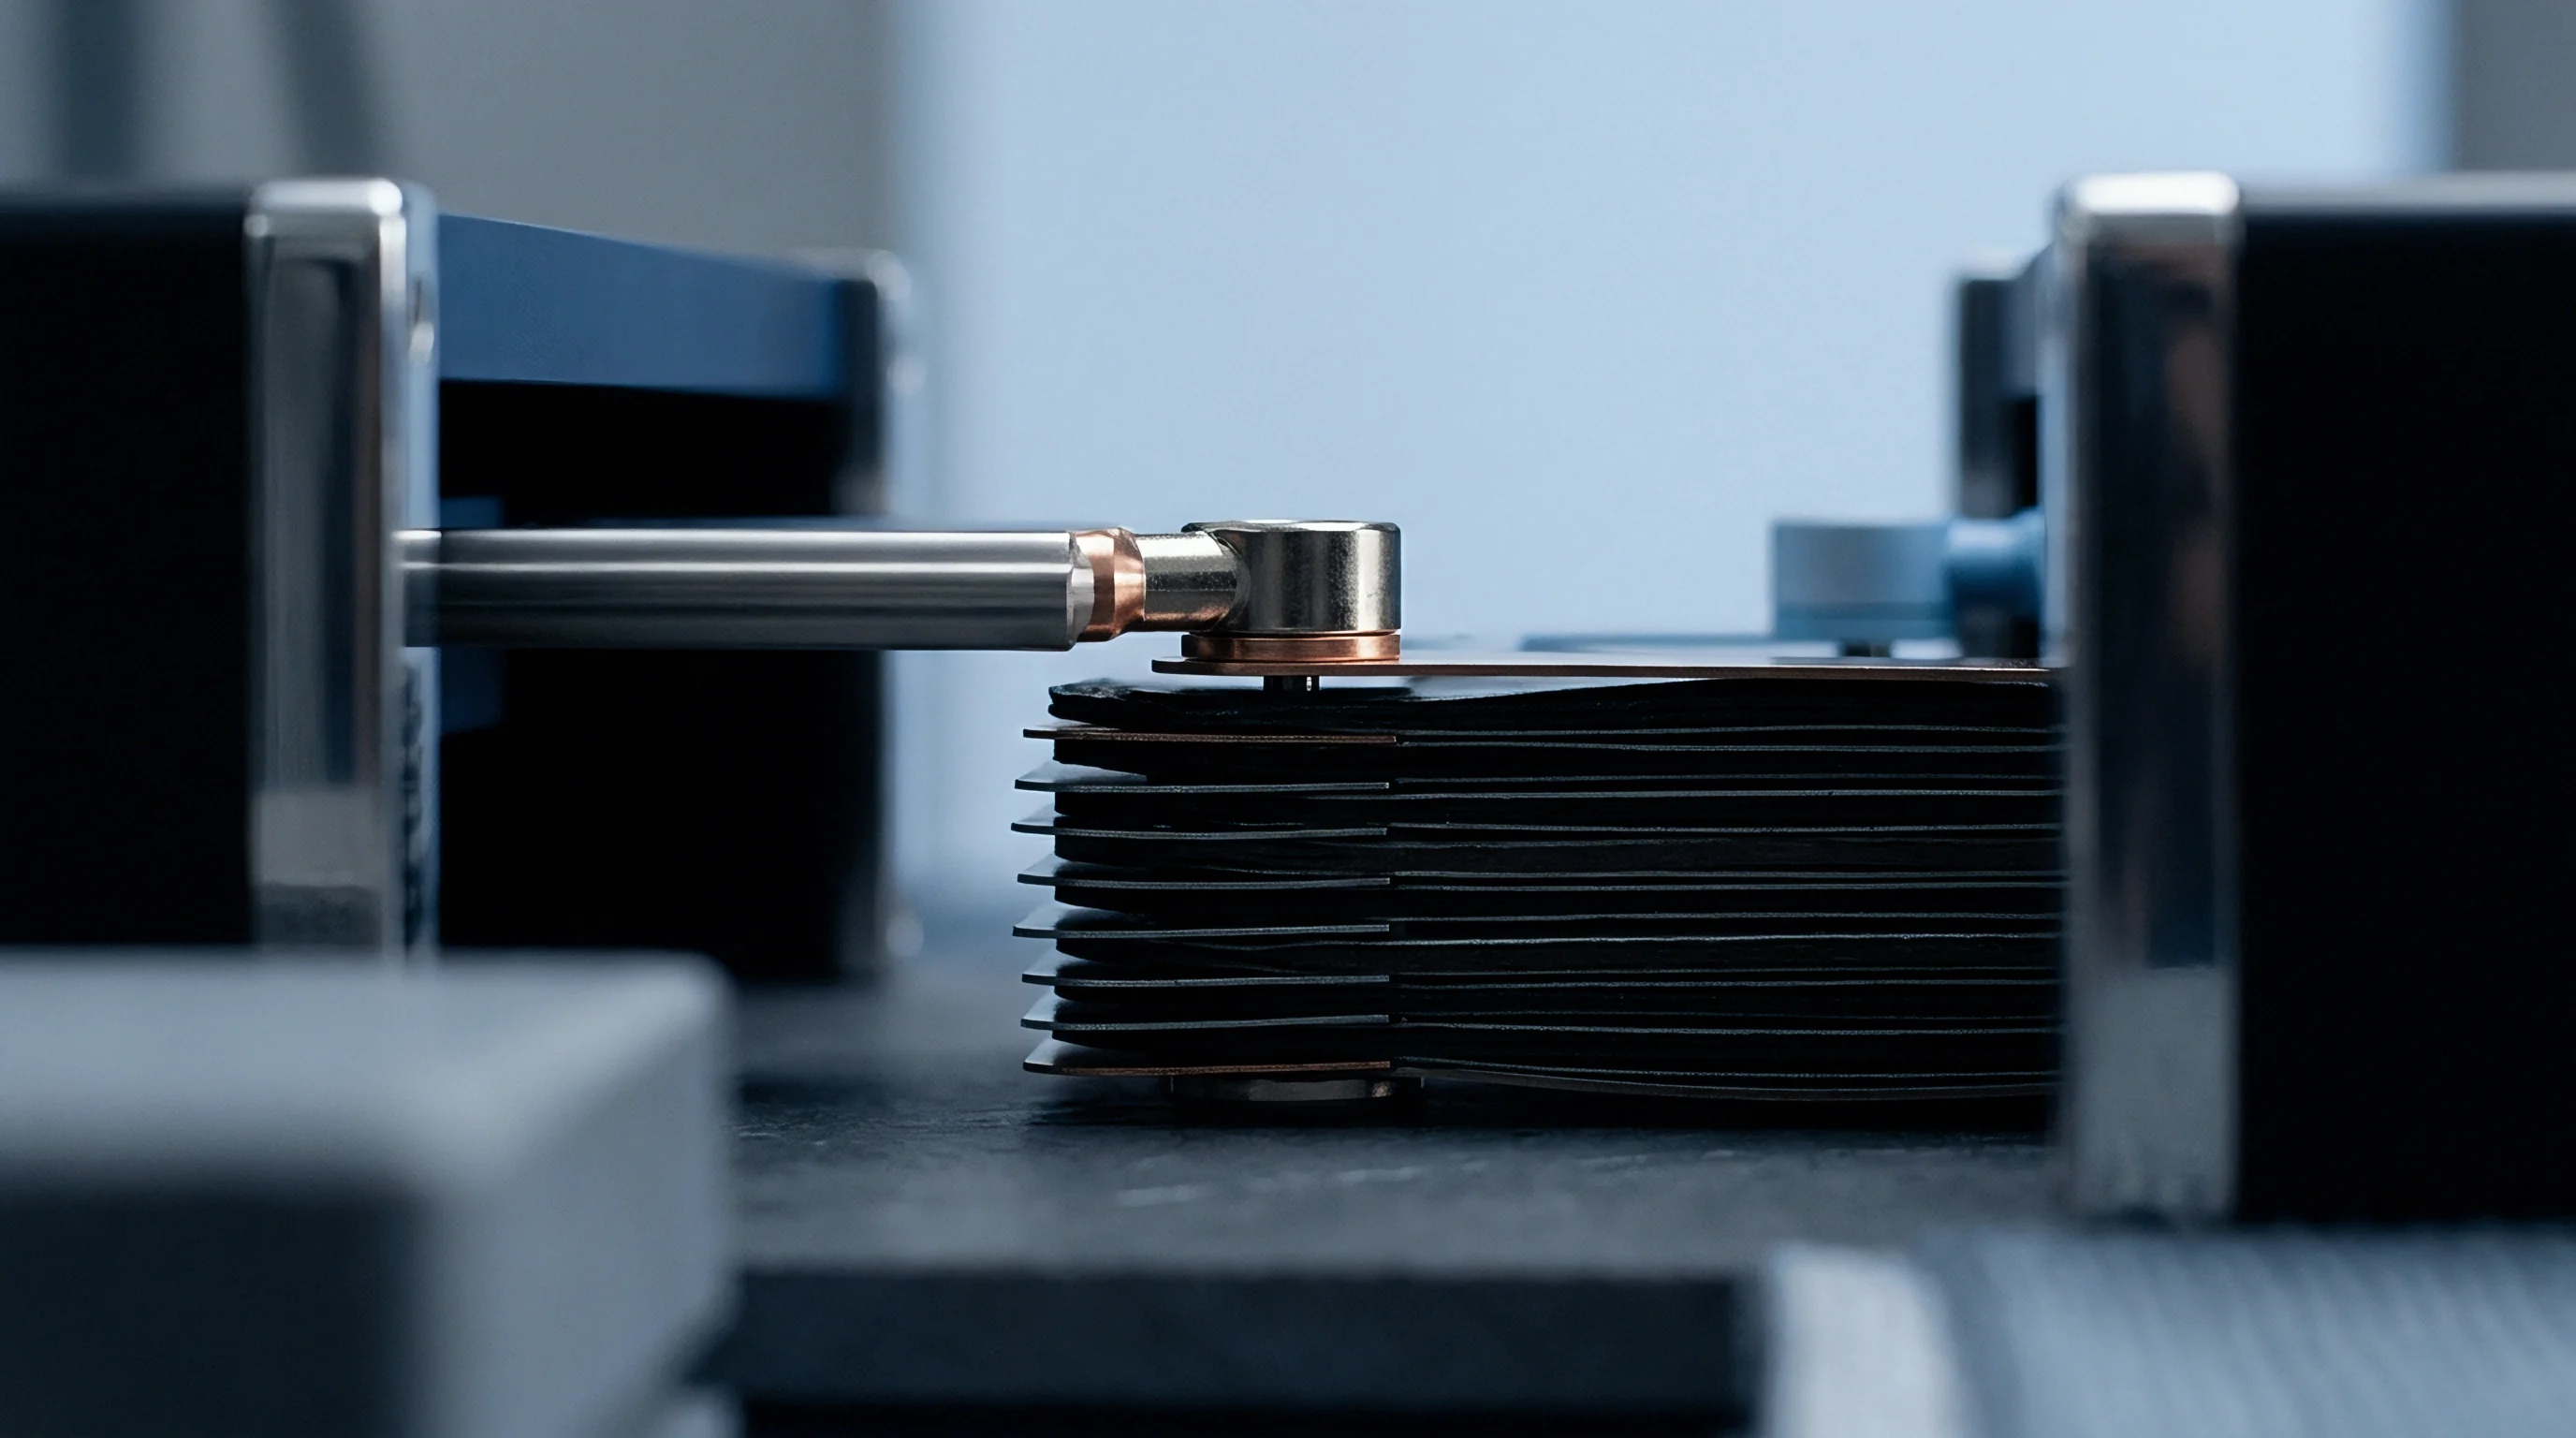
Micro-reference electrodes (MREs) track local potential inside commercial cylindrical, pouch, and prismatic cells in real time. Placing an MRE requires inserting a stable reference material into the jellyroll or stack without altering ionic flow or creating mechanical shorts. Typical sensor materials include lithium-coated copper wires, gold-coated micro-wires, and lithium titanate (Li₄Ti₅O₁₂, LTO) coated filaments.
Lithium titanate offers high thermodynamic stability (+1.55 V vs Li/Li⁺) and minimal drift under tiny measuring currents, outperforming raw metallic lithium wires that quickly oxidize in the presence of trace moisture.
Placing the reference tip accurately depends on understanding localized current distributions. Regions near the current tabs carry higher current density because electronic resistance along the collectors is low. During sub-zero charging, these tab-adjacent zones cross negative overpotential thresholds well before distant regions.
A sensor placed in the middle of the cell stack will underreport peak local overpotentials, giving control algorithms a false impression of safety.
- Micro wire displacement shifts the reference sensing tip relative to active material planes, altering measured electrolyte potential drops and skewing overpotential calculations.
- Solvent corrosion dissolves metallic reference coatings over extended cycling, producing baseline potential drift that invalidates absolute 0 V reference thresholds.
- Interfacial delamination creates localized void spaces around embedded sensing filaments, distorting local current density and inducing artificial plating hotspots.
- Parasitic current draw from internal measurement channels polarizes the reference electrode itself, driving reference potential drift away from thermodynamic equilibrium values.
Local measurements show spatial polarization gradients growing sharply as ambient temperatures fall. In a 21700 cylindrical cell charged at -10 °C, potential differences between the inner core and outer shell can exceed 80 mV. Cold electrolyte slows ionic transport so much that the outer layers of the roll carry most of the current, pushing local overpotential past the plating threshold while the core sits under-utilized.
Capturing this behavior requires multiple micro-reference nodes positioned along both radial and axial directions.
Sensing micro-wires capture localized shifts long before terminal voltage shows signs of damage. Yet incorporating three-electrode sensing into mass manufacturing remains difficult: micro-wires compromise pouch seal integrity and add mechanical stress points inside wound jellyrolls. As a result, manufacturers rely on high-fidelity electrochemical digital twins ~ validated using laboratory three-electrode cells ~ to estimate internal overpotentials in production packs.

Micro Reference Fabrication and Placement Mechanics
Building a stable micro-reference electrode for low-temperature testing involves placing a thin insulated titanium or gold wire (typically 25 to 50 μ$m in diameter) inside the cell matrix. Before winding, the tip is plated in-situ with mηllic lithium or coated with a single-phase LTO slurry. Gold wires form a gold-lithium alloy (LiAu) during initial lithiation that settles at a stable +0.33 V versus Li/Li⁺, giving consistent reference readings across hundreds of test hours at sub-zero temperatures.
Sensor tip placement inside the separator gap dictates measurement accuracy. The tip μst rest right in the mid-plane of the separator. Touching the graφte anode surface measures solid-phase electronic potential instead of liquid-phase electrolyte potential, invalidating the interfacial overpotential calculation.
On the other hand, close proξmity to the cathode adds large uncompensated ohmic drop ($I · Runcompensated) errors into the measured anode potential.

Uncompensated Resistance Correction in Cold Cell Testing
Calculating interfacial overpotential requires subtracting the uncompensated ohmic drop between the reference location and the graphite surface. At room temperature, high electrolyte conductivity makes this resistance negligible. At -20 °C, electrolyte resistivity jumps tenfold, turning a minor 10 μ$m placement offset into a 30 to 50 mV error under 2C charging.
Test engineers isolate uncompensated resistance ($Ru) through current-interrupt or high-frequency AC impedance measurements.
The true interfacial anode overpotential (ηinterfacial) is computed dynamically according to the following correction equation:
eta_{interfacial} = E_{measured} – E_{eq} – I cdot R_u
Failing to subtract dynamic I · Ru at sub-zero temperatures leads to premature charge cut-offs or undetected lithium plating. Applying static room-temperature Ru values to sub-zero datasets can skew calculated plating onset thresholds by up to 120 mV.
A reference electrode placed within two millimeter separator margins of electrode edges reliably tracks overpotential bounds across sub-zero temperature sweeps.

Diffusion
Solid-state lithium transport through the graphite host lattice governs the rate capability of energy-dense anodes. Intercalation depends on solid-state diffusion across a 3D network of interstitial sites between graphene sheets, following Fick’s laws of mass transport. At room temperature, the intrinsic diffusion coefficient (DLi) for synthetic graphite ranges from 10-10 cm2/s to 10-9 cm2/s.
At -20 °C, DLi drops by two to three orders of magnitude, falling into the 10-13 cm2/s to 10-12 cm2/s range.
Slow solid-state diffusion creates steep lithium concentration gradients inside individual graphite particles. During charging, lithium enters the particle surface faster than it can move into the core. Surface concentration (Cs, surface) climbs toward the maximum theoretical limit (Cs, max, representing fully lithiated LiC6).
Once the particle surface saturates (Cs, surface → Cs, max), it cannot take in more intercalating ions. Sustained charging current then forces incoming lithium to accumulate on the surface as metallic plating, even if the particle interior is far from full.
Diffusion slows drastically at sub-zero temperatures. Modeling spherical graphite particles under solid-state diffusion limits shows that surface concentration overpotential (ηdiff, s) scales directly with particle radius (Rp) and inversely with the diffusion coefficient (DLi):
eta_{diff, s} = frac{R cdot T}{F} cdot lnleft( frac{C_{s, max} – C_{s, surface}}{C_{s, max} – C_{s, bulk}} right)
Using smaller graphite particles shortens the characteristic diffusion distance (x ≈ sqrtDLi · t), which helps prevent early surface saturation. Cell manufacturers often use fine micro-grained synthetic graphite (mean particle diameter d50 between 6 μ$m and 10 $μ$m) to improve low-temperature charge acceptance. Smaller particles expand the total active surface area, lowering specific surface current density (A/m²) for a given total current.
That lower current density reduces charge-transfer overpotential and delays surface saturation.
Graφte structures resist quick insertion, and reducing particle size brings commercial trade-offs. Finer graφte powders have higher specific surface areas (BET surface area exceeding 3.5 m²/g), which drives up SEI formation during initial formation cycles. Extra SEI consumes active lithium, permanently lowering initial coulombic efficiency (ICE) and cell energy density.
Cell designers manage this balance by coating fine graφte cores with uniform amorphous carbon.
Adding silicon to anodes worsens low-temperature diffusion bottlenecks. While silicon offers a high theoretical capacity of ~3579 mAh/g when lithiated to $Li15Si4, solid-state lithium diffusivity in amorphous silicon (a-Si) is even lower than in graphite at sub-zero temperatures. Silicon also expands by roughly 300% when fully lithiated.
At low temperatures, slow diffusion concentrates mechanical stress near the outer edges of the silicon particles, causing severe cracking and isolating active material.
Standard cell purchase agreements exclude warranty coverage for degradation resulting from charging below zero degrees Celsius without verified pre-heating telemetry.
Why Does Anode Tortuosity Accelerate Sub-Zero Plating?
Electrode tortuosity (τ) reflects how convoluted the ionic path is through liquid electrolyte inside the porous electrode structure. High-density electrodes designed for high volumetric energy density are calendared to low porosity (ε < 20%) and elevated tortuosity (τ > 4.5). That high tortuosity (τ > 4.5) tightly restricts liquid-phase diffusion, as effective electrolyte diffusion (Deff) scales inversely with tortuosity:
D_{eff} = D_{bulk} cdot frac{epsilon}{tau}
At -20 °C, higher electrolyte viscosity and slower liquid diffusion (Dbulk) combine with high tortuosity to starve the deeper electrode layers of lithium ions. Under sustained high-rate charging, salt concentration in the pores near the current collector drops toward zero, driving extreme concentration polarization. This depletion forces current through the front face of the electrode stack facing the separator.
That front layer suffers severe overpotential spikes that push surface graphite into metallic plating while internal particles remain uncharged.
- Cryogenic electrolyte crystallization increases ionic resistance within pore networks, triggering localized salt depletion and triggering surface lithium deposition.
- Particle size polydispersity segregates current flows into fine grain clusters, driving localized overpotential spikes past thermodynamic stability limits.
- Anisotropic crystalline orientation restricts lithium entry channels in unaligned graphite flakes, concentrating interfacial current density at basal planes.
- Binder phase swelling restricts open pore channels within dense electrode matrices, increasing tortuosity factors beyond critical liquid diffusion thresholds.
Intercalation kinetics also depend on crystallographic orientation. Graphite is highly anisotropic, taking in lithium ions only through its edge planes (a-b axis channels); basal planes (c-axis surfaces) are electrochemically inactive for intercalation. Unaligned graphite flakes tend to orient parallel to the foil during coating and calendering, placing inactive basal planes right across the path of incoming ions.
Lithium must take circuitous routes to reach active edge planes, raising micro-scale tortuosity. To fix this, manufacturers apply magnetic fields during wet coating to align flakes vertically, exposing edge planes directly to incoming ions and improving sub-zero charge acceptance.
Together, solid-state particle diffusion and liquid-phase pore transport set the critical fast-charging current ceiling (Icrit). Charging above Icrit at a given temperature inevitably leads to lithium plating. While Icrit for a high-energy cell might exceed 3C at +25 °C, it drops below 0.2C at -10 °C unless active heating is applied.
Exceeding calculated sub-zero Icrit thresholds leads directly to irreversible lithium accumulation, rapid capacity loss, and voided vendor warranties.
Heater
Sub-zero thermal management requires active heat injection before fast charging starts. Relying on internal resistive heating (I2 · R) from DC charging current to warm a cold cell is dangerous: high charging currents induce metallic lithium plating immediately, long before Joule heating can warm the cell core to safe temperatures. Pre-conditioning must raise core temperatures above zero (typically to +10 °C or higher) before high charging currents are applied.
External warming uses liquid heating loops, positive temperature coefficient (PTC) blankets, or resistive films placed between modules. However, surface heating works slowly through thick cell assemblies due to anisotropic thermal conductivity. Heat flows readily along axial directions parallel to current collectors (20 to 30 W/(m·K)), but radial conductivity across film layers is under 1.0 W/(m·K).
Surface heating thus creates steep thermal gradients ~ the outer electrode layers warm up while the core stays frozen, causing plating in the center during fast charging.
Internal heating avoids conduction delays by generating heat directly inside the electrode stack. Self-heating designs embed thin nickel foils connected to an auxiliary terminal, warming the cell core at rates over 60 °C per minute. When sub-zero fast charging is requested, an internal switch routes current through the foil.
Joule heating warms the active materials uniformly from within without driving the graphite surface into plating potential.
| Heating Architecture | Warm-Up Rate (°C/min) | Temperature Uniformity (Δ Tcore-surface) | Energy Source | Added Cell/Pack Mass (%) | BMS Control Complexity |
|---|---|---|---|---|---|
| External Liquid Cold Plate Heating | 0.5 to 1.5 | High (> 12 °C) | External / Pack Battery | Baseline (0%) | Low |
| Surface Resistive PTC Film | 1.0 to 3.0 | Moderate (6 to 10 °C) | External Grid / Pack | + 2.5% | Low |
| Internal Embedded Nickel Foil | 30.0 to 60.0 | Excellent ( | Pack Battery Internal | + 1.2% | Moderate (Relay Required) |
| High-Frequency AC Pulse Excitation | 5.0 to 12.0 | Good ( | Charger / Inverter AC | + 0.1% (Inverter Firmware) | High (DSP / Power Electronics) |
High-frequency alternating current (AC) excitation warms cells internally without structural modifications. Passing high-frequency AC current (typically 1 kHz to 10 kHz) generates internal heat through ohmic resistance (Irms2 · RΩ) in the electrolyte and active materials. Because the AC cycle is much faster than charge-transfer and diffusion relaxation times, lithium ions simply oscillate at the interface without net intercalation or plating, keeping state of charge constant throughout warming.
Pre-heating uses meaningful energy, reducing net driving range or charging efficiency. Warming a 100 kWh battery pack from -20 °C to +15 °C takes roughly 3.5 to 4.5 kWh of energy at typical pack heat capacities (Cp ≈ 950 J/(kg·K)). System design determines whether this energy comes from the grid charger or is drawn from the onboard battery before plugging in.
- BMS reads ambient temperature, internal impedance, and initial state of charge.
- System verifies the sub-zero fast-charge request and holds main DC contactors open to block direct high-rate charging into cold electrodes.
- BMS engages the AC heating circuit or closes the relay for embedded self-heating foils.
- Thermal management tracks core temperature in real time using AC impedance shifts or embedded thermistors.
- Heating current is modulated to keep thermal ramp rates below 10 °C per minute and prevent mechanical stress.
- Heating disengages once core temperature reaches +10 °C.
- BMS closes main DC contactors and starts standard fast-charging profiles.
Incomplete thermal pre-conditioning leads to severe degradation. Tier-1 cell suppliers often reject low-temperature warranty claims by attributing capacity fade to improper pre-heating execution.
Surface thermal blankets fail to raise core winding temperatures above zero degrees before high-rate DC current injection is initiated.

Validation
Detecting metallic lithium deposition non-destructively requires tracking voltage relaxation after charging stops. During charge, terminal voltage includes both thermodynamic potential and dynamic polarization. When current halts, polarization decays and voltage relaxes toward open-circuit equilibrium.
If sub-zero charging has plated metallic lithium, that surface lithium chemically re-intercalates into adjacent graphite (Li0 + C6 → LiC6), altering the relaxation curve.
This chemical re-intercalation produces a distinct plateau on the open-circuit relaxation curve (Vcell versus time). While metallic lithium stays on the graphite surface, anode potential remains pinned near 0.00 V versus Li/Li⁺ by the Li0/Li⁺ redox equilibrium. Once that plated lithium either finishes re-intercalating or reacts with electrolyte to form dead lithium, potential steps up to the equilibrium voltage of intercalated graphite (+0.08 V to +0.20 V depending on SOC).
Taking the time derivative of cell voltage (dV/dt) turns this voltage plateau into a sharp, quantifiable peak.
Voltage relaxation derivative analysis provides a sensitive metric for qualification testing. The area under the dV/dt relaxation peak correlates directly with the mass of active plated lithium. Comparing baseline relaxation curves at +25 °C against sub-zero profiles allows engineers to detect capacity loss from plating as low as 0.5% long before physical teardown.
High-precision coulometry (HPC) complements relaxation spectroscopy by measuring coulombic efficiency (CE) to within 0.0001 precision (exceeding 99.99%). In normal operation without plating, efficiency reaches near-unity after formation. When sub-zero charging causes lithium plating, some of that lithium becomes electronically isolated as dead lithium.
Dead lithium cannot participate in discharge, causing a prompt drop in coulombic efficiency (CE = Qdischarge / Qcharge).
Differential capacity ($dQ/dV) analysis during subsequent slow discharges tracks structural damage from cold charging. Plating and dead lithium formation consume active lithium, shifting dQ/dV peaks corresponding to graphite phase transitions. Lower peak intensities at Stage 2 and Stage 1 intercalation points signal permanent loss of cyclable lithium and active material degradation.
Interpreting validation metrics requires accounting for lab test setup boundaries. Running continuous sub-zero fast-charge cycles without allowing thermal equilibration between charge and discharge yields misleadingly optimistic cycle life predictions. Heat generated during discharge can warm the cell core before the next charge leg, masking lithium plating that would happen during actual cold-soak field operation.
Commercial supply agreements set strict low-temperature operating boundaries. Purchase contracts include clear telemetry logging criteria to guard against premature field failures. Systems must log estimated core temperature, peak charge rate, and voltage relaxation derivatives for every fast charge executed below +5 °C.
The contract specification requires automatic current derating to less than 0.05C whenever measured cell temperature drops below negative 15 degrees Celsius.
Post-charge open-circuit voltage relaxation plateaus provide immediate, non-destructive evidence of mηllic lithium re-intercalation prior to destructive teardown.
Integrating non-destructive plating detection into BMS firmware is a key focus for electric vehicles. Onboard BMS units run automated voltage relaxation derivative checks during post-charge sleep states. Detecting a $dV/dt relaxation peak automatically adjusts future cold-weather charging profiles, derating current limits to protect the anode from further damage.
This adaptive control balances fast cold-weather charging against battery longevity.