Correlation between Sub Micron Seal Defects and Long Term Electrolyte Solvent Evaporation Kinetics
Sub-micron seal defects drive long-term carbonate solvent effusion via Knudsen diffusion, elevating cell impedance and risking transport safety compliance.

Pore
Microscopic channels through lithium-ion cell containment alter mass transport from continuum fluid flow to molecular effusion. In sealed pouch cells and cylindrical cans, defect channels between 0.1 and 1.0 micrometers in equivalent diameter create persistent vapor escape routes while preventing liquid electrolyte leakage during initial manufacturing inspection. Surface tension across the liquid-gas interface holds liquid carbonate solvents inside the casing under standard atmospheric conditions.
Vapor-phase molecules continuously cross this capillary barrier, driven into the environment by internal partial pressure gradients.
Transport regimes through sub-micron channels depend on the ratio of the molecular mean free path to defect diameter ~ the Knudsen number. When channel diameters drop below 0.5 micrometers, the Knudsen number exceeds unity for common organic carbonate vapors such as dimethyl carbonate and ethyl methyl carbonate at normal operating temperatures. Knudsen diffusion then dominates mass transport.
Because gas molecules collide with the channel walls far more often than with each other, macroscopic fluid equations like Poiseuille flow cannot accurately predict leak rates.
Physical Mechanics of Boundary Channel Microdefects
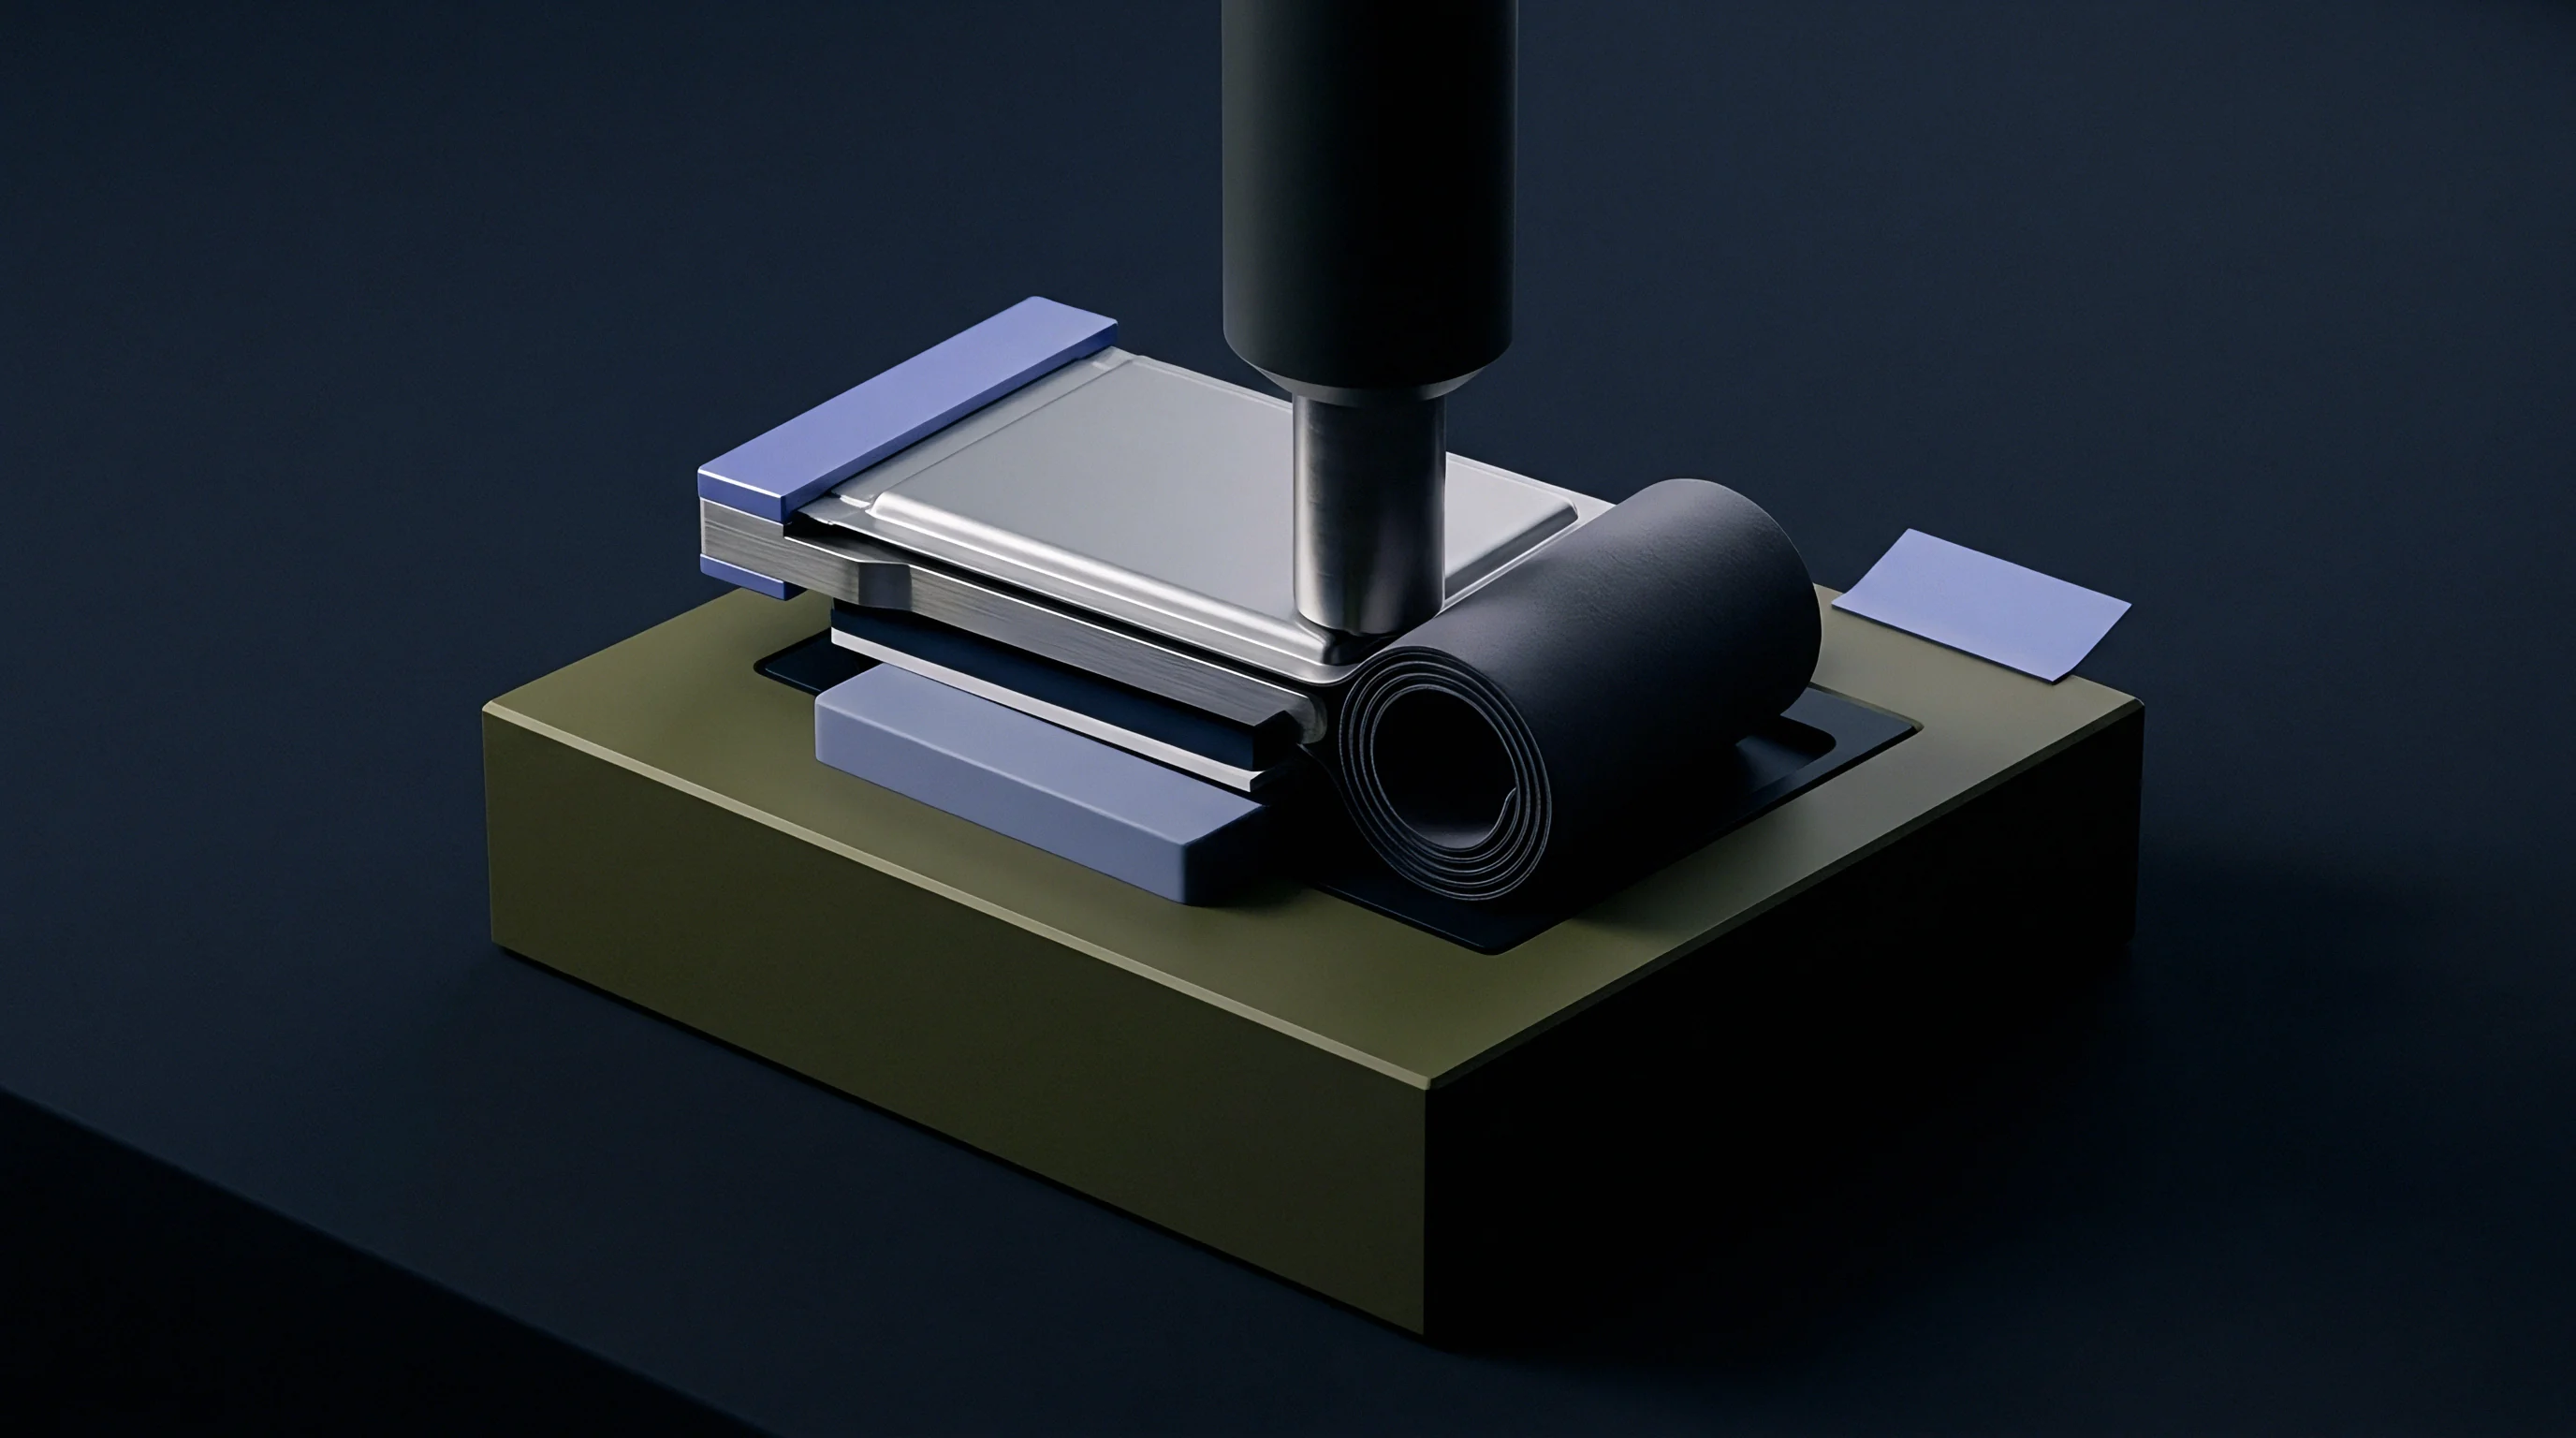
Sub-micron leak paths originate from specific thermo-mechanical stresses during cell assembly. Pouch cells suffer from localized crimping anomalies, polyolefin layer thinning, and aluminum foil micro-cracking during heat sealing. Cylindrical formats develop micro-fissures in the rubber grommet or around laser seam welds on the current collector header assembly.
These pathways remain structurally stable under mechanical vibration and routine pressure fluctuations.
Internal cell pressure stays near atmospheric levels during normal storage, but the vapor pressure of low-boiling solvents creates a positive partial pressure differential toward the outside environment. The effective mass transfer rate through a cylindrical microchannel scales linearly with cross-sectional area and inversely with tortuous channel length. Tiny pinholes create significant long-term loss pathways because molecular flux continues uninterrupted over multi-year operating lifespans.
Transition Boundaries in Molecular Effusion
Accurate leak rate modeling depends on locating the transition between viscous continuum flow and Knudsen diffusion. At sub-micron scales, choked flow equations overstate gas escape velocity, whereas molecular diffusion models give accurate mass transfer predictions. Physical parameters across defect size ranges are summarized below.
| Defect Diameter | Knudsen Number | Dominant Transport Mechanism | Helium Equivalent Leak Rate Range | Solvent Mass Loss Rate Profile |
|---|---|---|---|---|
| 1.0 to 3.0 microns | Kn less than 0.1 | Viscous Laminar Flow | 10 to the power of minus 4 to 10 to the power of minus 3 mbar L/s | Linear pressure-driven fluid effusion |
| 0.3 to 1.0 microns | Kn between 0.1 and 1.0 | Transition Flow Regime | 10 to the power of minus 6 to 10 to the power of minus 4 mbar L/s | Mixed pressure and concentration driven flux |
| 0.05 to 0.3 microns | Kn greater than 1.0 | Knudsen Molecular Effusion | 10 to the power of minus 8 to 10 to the power of minus 6 mbar L/s | Pure partial pressure Knudsen diffusion |
Heat-seal thermal verification during pouch formation does not guarantee absolute package integrity over ten-year operational spans.
Volatility
Electrolyte formulations rely on binary or ternary carbonate mixtures whose differential vapor pressures drive preferential component depletion. Standard commercial electrolytes contain lithium hexafluorophosphate dissolved in cyclic carbonates, such as ethylene carbonate, and linear carbonates like dimethyl carbonate, ethyl methyl carbonate, or diethyl carbonate. Linear carbonates have substantially higher saturation vapor pressures than cyclic carbonates at normal storage temperatures.
A sub-micron defect with an equivalent helium leak rate of 10-6 mbar·L/s drives an annual linear carbonate mass loss of 180 milligrams at 25 degrees Celsius.
Preferential evaporation of low-viscosity, low-boiling linear components shifts the bulk electrolyte composition over time. Dimethyl carbonate has a vapor pressure of approximately 53 hectopascals at 20 degrees Celsius, while ethylene carbonate sits below 0.01 hectopascals at the same temperature. As linear carbonates escape, the remaining fraction of cyclic carbonate rises, increasing electrolyte viscosity and lowering ionic conductivity.
Thermodynamic Depletion Profiles in Carbonate Blends
Evaporation rates through micro-defects follow Raoult’s law modified by activity coefficients in non-ideal liquid mixtures. Linear carbonate molecules evaporate into the internal cell headspace, maintain partial pressure equilibrium, and effuse through microchannels into the surrounding air. The internal partial pressure differential persists as long as liquid linear carbonate remains in the electrolyte.
In a pouch cell filled with 15.0 grams of electrolyte containing ethylene carbonate and dimethyl carbonate in a 1:1 weight ratio, a sub-micron defect produces an estimated dimethyl carbonate escape flux of 5.7 × 10⁻⁹ grams per second at 25 degrees Celsius. Over five years of room-temperature storage, cumulative dimethyl carbonate loss reaches roughly 0.90 grams ~ 12 percent of the total linear solvent mass. Elevated temperatures accelerate this depletion exponentially: at 45 degrees Celsius, logarithmic vapor pressure scaling increases the escape flux by a factor of 3.4.

Ternary Vapor Pressure Equilibrium
Adding ethyl methyl carbonate or diethyl carbonate creates a ternary system with stepped vapor pressures. Depletion proceeds sequentially: dimethyl carbonate evaporates first, followed by ethyl methyl carbonate, leaving ethylene carbonate largely intact. Evaporation rates stabilize only when the partial pressure of volatile linear components drops inside the header space, which happens only after near-total linear solvent dry-out.
Higher ambient storage temperatures widen the vapor pressure gap between linear and cyclic carbonates. Accelerated aging trials at 60 degrees Celsius distort natural evaporation kinetics because linear carbonate partial pressures rise faster than cyclic pressures, altering escape ratios relative to real-world operational aging.
Higher storage temperatures accelerate linear solvent loss while leaving the initial cyclic solvent quantity unchanged.


Impedance
Progressive solvent depletion elevates internal cell resistance long before visible deformation or sudden voltage drops appear. Mass loss reduces the liquid volume required to keep separator pores saturated and ensure uniform wetting across high-loading electrodes. As the liquid volume shrinks, dry spots form inside the winding core, forcing lithium ions through longer, more tortuous transport paths.
Dry-out concentrates dissolved lithium hexafluorophosphate in the remaining liquid phase. Higher salt concentrations initially raise ionic strength, but exceeding optimal limits increases viscosity and reduces ionic mobility. If local concentration exceeds saturation, salt precipitates out, clogging separator pores and permanently deactivating regions of active material.

Electrochemical Decay Signatures of Mass Loss
Electrochemical impedance spectroscopy tracks solvent depletion through high-frequency and mid-frequency spectral shifts. Ohmic resistance increases steadily as bulk electrolyte volume shrinks and separator pore resistance grows. At the same time, charge-transfer resistance rises at electrode interfaces owing to non-uniform current distribution and localized de-wetting.
| Solvent Mass Loss Percentage | Ohmic Resistance Shift | Charge Transfer Impedance Change | 1C Discharge Capacity Retention | UN 38.3 Altitude Test Safety Impact |
|---|---|---|---|---|
| 1.0 to 3.0 percent | Less than 5 percent increase | Negligible change | Greater than 98 percent | Passes standard vacuum exposure |
| 3.0 to 8.0 percent | 10 to 25 percent increase | 15 to 35 percent increase | 92 to 96 percent | Passes vacuum exposure, elevated impedance |
| 8.0 to 15.0 percent | 30 to 80 percent increase | 50 to 120 percent increase | 80 to 90 percent | Risk of pouch swelling under 11 kPa test |
| Greater than 15.0 percent | Greater than 100 percent increase | Greater than 200 percent increase | Less than 75 percent | High risk of internal micro-shorting |
Solid Electrolyte Interphase Degradation under Solvent Depletion
Loss of linear carbonate solvents compromises the mechanical and chemical stability of the solid electrolyte interphase (SEI) on the graphite anode. While cyclic carbonates sustain the passivation film structure, high local salt concentrations accelerate transition-metal dissolution from the cathode. These metals deposit on the anode and break down the film; subsequent re-passivation consumes remaining liquid solvent and active lithium, driving non-linear capacity fade late in cell life.
Unchecked sub-micron seal defects void UN 38.3 dangerous goods transport certifications by inducing internal cell de-wetting during mandatory low-pressure altitude simulation tests.
Capacity loss from micro-leak solvent depletion follows a two-stage kinetic profile. The first stage shows slow, linear capacity loss driven by steady solvent evaporation. The second stage brings rapid, exponential loss once separator de-wetting hits a critical threshold, triggering localized lithium plating during fast charging.
Uncorrected sub-micron leaks lead to early field failures, high warranty return rates, and severe capacity loss after 18 months in service.

Sensing
Standard production checks rarely catch gas leak rates below 10-6 mbar·L/s during high-throughput end-of-line testing. Optical inspection, direct pressure decay, and vacuum bubble testing lack the sensitivity to resolve sub-micron pinholes. Identifying these pathways requires tracer gases paired with high-vacuum mass spectrometry.
Can Vacuum Helium Mass Spectrometry Identify Sub Micron Channels?
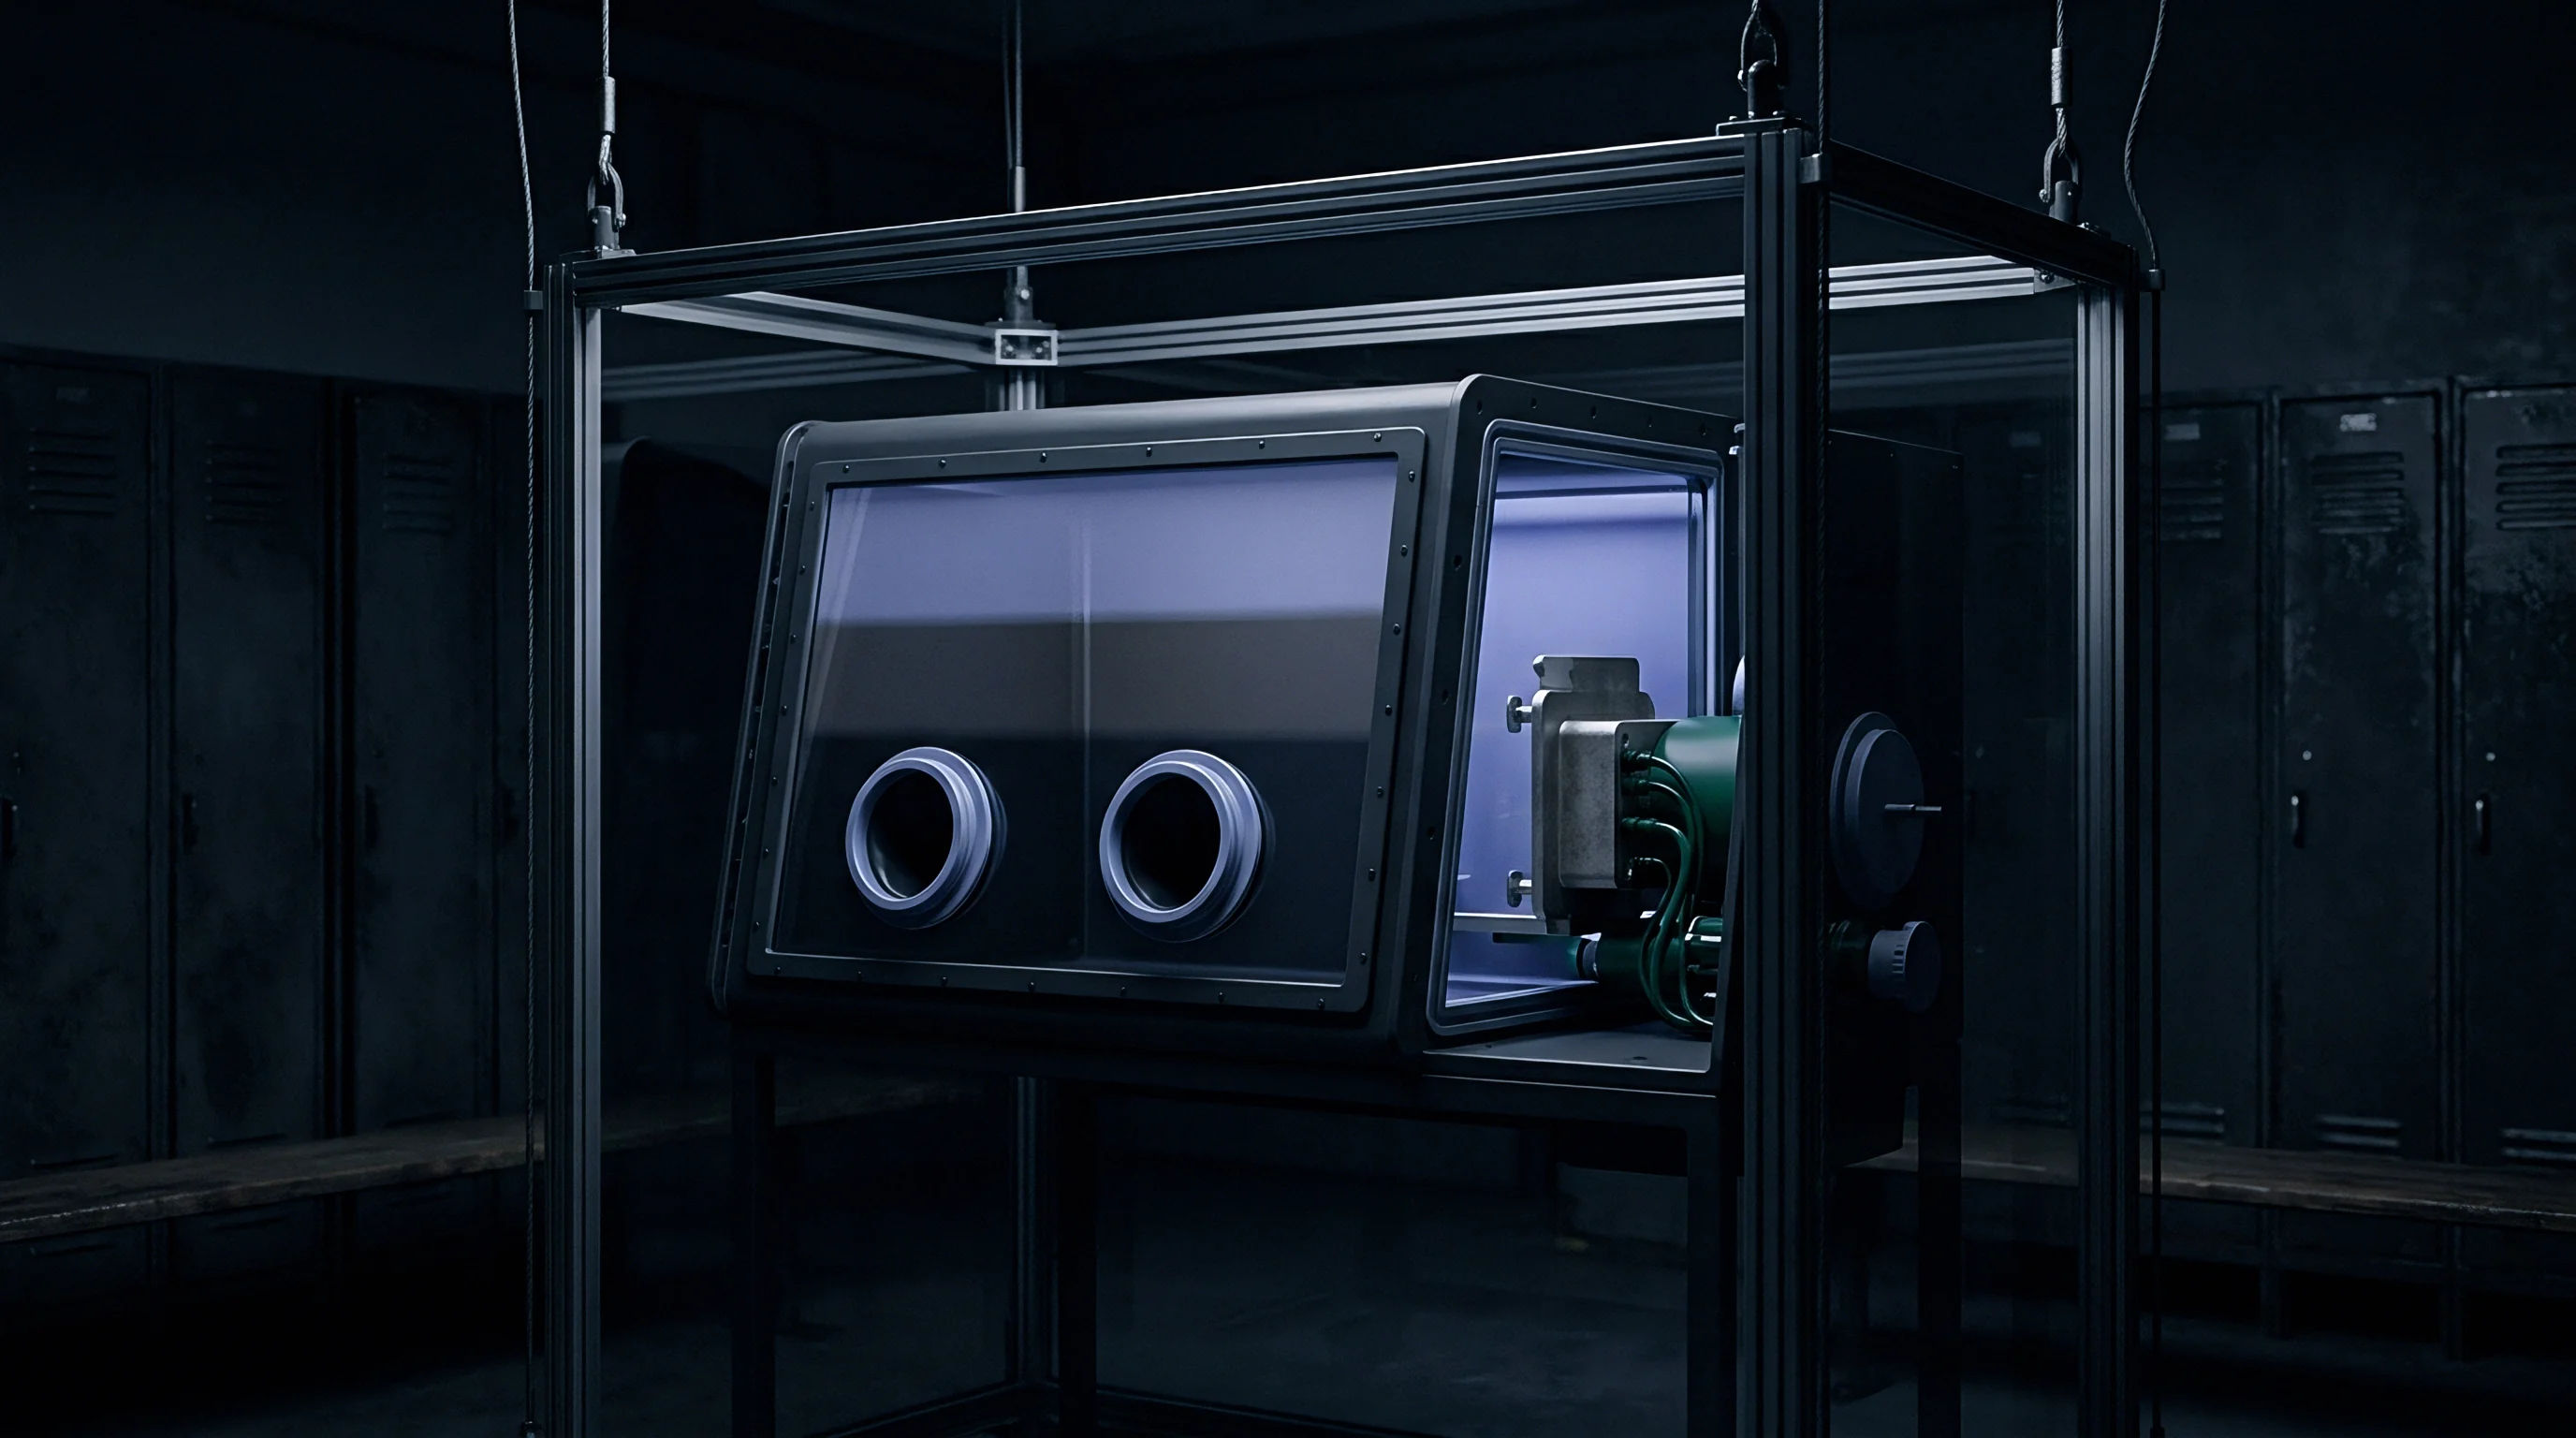
Vacuum helium mass spectrometry offers enough sensitivity to detect sub-micron seal defects down to 10-9 mbar·L/s. Cells are either bombed in a helium-pressurized chamber or dosed with trace helium during electrolyte filling before final sealing. Inside a vacuum test chamber, helium escaping through microchannels enters the analyzer manifold, where electron-impact ionization and magnetic sector separation measure tiny tracer ion currents.
Surface helium sorption on polyolefin pouch films presents a practical challenge. Helium adsorbs onto polymer surfaces during bombing and desorbs slowly inside the vacuum chamber, creating false leak readings. Nitrogen back-flushing and optimized pump-down schedules remove surface-bound helium background interference to isolate true leak channels.
Quantitative Detection Thresholds and Production Line Limits
Integrating helium detection into automated mass production requires balancing cycle time against measurement resolution. Industrial mass spectrometers reach high sensitivity only when chamber pressure drops below 10-4 millibar, requiring substantial pumping capacity.
Sub-micron seal integrity defects stem from specific production root causes:
- Thermal seal contamination occurs when liquid electrolyte splashes onto pouch seal margins during high-speed filling, preventing polyolefin fusion.
- Laser seam voiding develops from power fluctuations or shield gas interruptions during header welding on metallic cylindrical cell casings.
- Grommet crimp relaxation occurs when inconsistent mechanical crimping force leaves microscopic elastic recovery gaps along elastomer gaskets in cylindrical header caps.
- Polyolefin film delamination stems from improper temperature control during thermal sealing, leaving sub-micron gas escape channels between layers.
Quality control protocols require specific qualification steps before cell lots are approved for transport documentation:
- Helium background calibration verifies mass spectrometer noise floors before loading cell trays into vacuum test chambers.
- Pressure dwell optimization ensures trace helium reaches partial pressure balance inside cell header spaces prior to testing.
- Chamber pump-down verification confirms test chamber vacuum levels drop below absolute pressure thresholds within specified time limits.
- De-sorptive air-wash cycling strips helium from cell exterior surfaces to prevent false reject signals.
Whether inline helium tracer testing can reach sub-three-second cycle times per cell without compromising sub-micron resolution remains an open question for high-speed assembly line design.


Warranty
Procurement contracts without explicit helium equivalent leak rate specifications transfer long-term cell dry-out risk to the pack integrator. Datasheets routinely report initial capacity and impedance measured immediately after formation, masking sub-micron seal defects that appear only after months in the field. Cell buyers should set explicit maximum helium leak rates in incoming quality control terms.
A baseline seal standard specifying a maximum helium leak rate of 10-7 mbar·L/s bounds five-year electrolyte mass loss below 2 percent under standard ambient storage conditions.

Contractual Allocation of Solvent Depletion Exposure
Cell supply agreements should base lot acceptance criteria on quantitative leak rate verification rather than visual or dimensional inspection. If incoming sample testing shows leak rates above threshold limits, responsibility for lot rejection, freight costs, and quarantine processing falls to the cell manufacturer.
Warranty terms must define specific performance metrics for solvent loss during the coverage period. Standard capacity retention clauses are often insufficient because suppliers can attribute capacity loss to aggressive cycling or improper thermal management. Specifying impedance growth rate caps and differential voltage spectroscopy markers helps isolate solvent-loss degradation from normal aging.

Dangerous Goods Compliance and UN 38.3 Certification Scope
Transport regulations under the UN Recommendations on the Transport of Dangerous Goods require cells to pass UN 38.3 test protocols, including Section 38.3.4.2 Test T.2 for altitude simulation. Test T.2 subjects cells to an absolute pressure of 11.6 kilopascals or less for at least six hours at 20 degrees Celsius. Cells with sub-micron defects can lose volatile linear carbonates rapidly under low ambient pressure, causing pouch distortion, mass loss, or structural failure.
A UN 38.3 test summary certifies design type compliance at initial testing, but it does not guarantee that subsequent production lots are free from sub-micron seal defects. Lot conformity requires ongoing batch-level verification supported by statistical process control records.
- Define helium equivalent leak rate ceilings in the cell supply master agreement specification sheet.
- Mandate batch test summaries containing quantitative mass spectrometry leak rate distributions for every production lot.
- Execute third-party incoming vacuum leak testing on statistical sample sizes per ISO 2859-1 acceptance sampling plans.
- Audit cell manufacturer seal tool maintenance logs and thermal seal temperature calibration records annually.
The standard procurement agreement clause governing seal integrity reads: “The supplier warrants that all delivered cells exhibit a helium-equivalent leak rate non-exceeding 1.0 × 10⁻⁷ mbar·L/s as tested per ASTM E499, and supplier shall indemnify buyer for all direct costs, recall expenses, and dangerous goods transport liabilities arising from electrolyte dry-out caused by non-conforming seal defects.”
| Helium Leak Rate Limit | Estimated 5-Year Mass Loss | UN 38.3 Compliance Risk | Recommended Commercial Action |
|---|---|---|---|
| Greater than 10 to the power of minus 5 mbar L/s | Greater than 15 percent loss | High risk of failure during T.2 altitude test | Immediate lot rejection and supplier recall |
| 10 to the power of minus 6 mbar L/s | 5 to 12 percent loss | Moderate risk of elevated impedance growth | Require supplier corrective action plan and screening |
| 10 to the power of minus 7 mbar L/s | 1 to 3 percent loss | Low risk, within safe design margins | Standard lot acceptance threshold |
| Less than 10 to the power of minus 8 mbar L/s | Less than 0.5 percent loss | Negligible transport or operational risk | Optimal specification for high-reliability packs |